DOI: 10.12928/TELKOMNIKA.v14i3.3292 1175
Image Retrieval Based on Multi Structure
Co-occurrence Descriptor
Agus Eko Minarno*1, Arrie Kurniawardhani2, Fitri Bimantoro3
1
Universitas Muhammadiyah Malang, Malang, Indonesia
2Universitas Islam Indonesia, Yogyakarta, Indonesia 3
Universitas Mataram, Mataram, Indonesia *Corresponding author, e-mail: [email protected]
Abstract
This study presents a new technique for Batik cloth image retrieval using Micro-Structure Co-occurence Descriptor (MSCD). MSCD is one of feature extraction method. It is a developed method based on Enhanced Micro Structure Descriptor (EMSD). In previous study, EMSD has been used for extracting texture, color, and shape feature simultaneously. However, EMSD could not achieve an optimal precision for Batik cloth image retrieval. Therefore, MSCD is proposed to overcome the EMSD drawback using global feature approach, namely Gray Level Co-occurrence Matrix (GLCM). There are 300 batik cloth images, which contain 50 classes used for dataset. The performance result shows that MSCD can increase precision and recall, by 19.03% and 18.33%, respectively. It indicates that MSCD can retrieve Batik cloth images more effective than EMSD.
Keywords: batik, image retrieval, micro structure, gray level co-occurrence matrix
Copyright © 2016 Universitas Ahmad Dahlan. All rights reserved.
1. Introduction
Batik is a word came from Javanese that consist of “ngembat” and “nitik” [1]. From those stems, Batik is a traditional method to draw a motif on cloth [2-3]. Batik is acknowledged by UNESCO as one of Indonesian cultural heritage on 2 October 2009. Patterns composed Batik cloth is a symbol that has a particular meaning, especially for Javanese people [3-4]. There are some specific patterns that must be used in a specific moment and by a specific person. Batik patterns are composed repeatedly and either geometrically or non-geometrically. According to those patterns, Batik images are recognized in order to facilitate on making documentation.
Some studies have been proposed to recognize Batik images. Ida, et al., [1] have done performance comparison on three feature extraction methods, namely Gray Level Co-occurrence Matrices (GLCM), Canny Edge Detection, and Gabor filters. That study showed that GLCM is superior to Canny Edge Detection and Gabor filters when it was used to represent Batik images. Cheong and Loke [5] used Tchebichef Orthogonal Polynomials to obtain shape feature of Songket and Batik image from Multispectral Co-occurrence Matrices. That study indicated that Tchebichef Orthogonal Polynomials can be used to improve the accuracy of Batik Color image recognition. Loke and Cheong [6] had done feature reduction using Principal Component Analysis (PCA). That study showed that PCA can reduce features precisely, so it can help to make recognition faster without reducing the accuracy. Rangkuti, et al., [7] developed Content-based Image Retrieval (CBIR) for Batik image using canny edge detection and shape invariant momentfor extracting texture and shape feature, respectively. Those studies, however, provided unsatisfied result for Batik images that have more complicated pattern which contains various patterns in a Batik image. As a consequence, Batik images inter-class have similar pattern [1]. Because of that, a more reliable feature extraction method is needed.
TELKOMNIKA Vol. 14, No. 3, September 2016 : 1175 – 1182
Classification using SIFT [18], etc. EMSD is one of reliable, simple, and efficient method for extracting features. EMSD extract texture, color, and shape feature simulltaneously based on micro-stucture and edge orientation similarity but EMSD cannot achieve an optimal precision. Therefore, Micro-Structure Co-occurrence Descriptor (MSCD) is proposed to overcome the EMSD drawback using global feature approach, namely GLCM.
2. Dataset
Batik image dataset is collected by capturing 50 types of Batik cloth. Each cloth is captured to as much as six random images and then resized to 128x128 pixels size in JPEG format. Thus, the total number of images in a dataset is 300 and consists of 50 classes. Examples of batik images are shown in Figure 1. In general, there are two patterns of captured batik images, geometric and non-geometric patterns.
Figure 1. Example of Batik images
3. Multi Structure Co-occurrence Descriptor
MSCD is a developed method based on EMSD that is combined with GLCM to overcome EMSD drawback. EMSD has 78 features which consist of color feature and edge orientation derived from micro-structure map of edge detection. Whereas GLCM has 16 feature as global feature representation of an image.
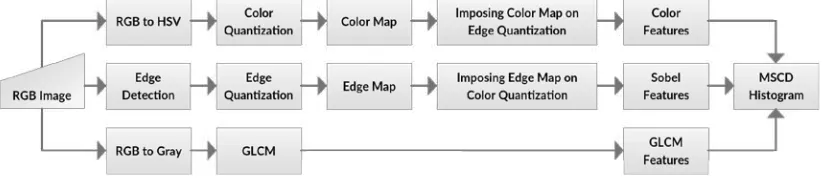
Figure 2. Features extraction diagram of Micro-Structure Co-Occurrence Descriptor
According to Figure 2, first stage of MSCD is converting RGB image to HSV image. Then, that HSV image is quantized into 8 bins for H, 3 bins for S, and 3 bins for V. Thus, there are 8x3x3=72 color features.
Second stage of MSCD is edge orientation detection using Sobel operator. Edge orinetation stretchs from 0º to 180º. Then, that edge orientationis quantized into 6 orientation bins with 30º as the step-length for each bin. Thus, there are 6 edge orientation features.
orientation image using 3x3 grid kernel. The orientation values that are compared are center grid orientation of kernel to 8-neighbor grids of kernel that is 1 grid distance from the center. The micro-structure map is arranged from patterns where the orientation of neighbor grids have the same value with the orientation of center grid. Then that pattern become a mask that will be superimposed over quantized HSV image. This stage is illustrated in Figure 3(a)-3(g).
Fourth stage is building a micro-structure map from HSV image that has been quantized to make a mask that will be superimposed over edge orientation image that has been quantized. A micro-structure map is built based on intensity similarity detection in quantized HSV image using 3x3 grid kernel. The intensity values that are compared are center grid intensity of kernel to 8-neighbor grids of kernel that is 1 grid distance from the center. The micro-structure map is arranged from patterns where the intensity of neighbor grids have the same value with the intensity of center grid. Then that pattern become a mask that will be superimposed over quantized edge orientation image. This stage is illustrated in Figure 3(h)-3(j).
Fifth stage of MSCD is according to GLCM is applied to the original image [17]. GLCM features that are used are energy, entropy, contrast,and correlation feature at 0º, 45º, 90º, and 135º. Thus, there are 4x4 = 16 GLCM features. Hence, The total fatures that MSCD has are 72+6+16 = 94 feature.
3.1. HSV Color Space and Color Quantization
Color provides spatial correlation information that very reliable for CBIR and object recognition. Color histogram is used frequently as color feature extraction method in CBIR. RGB color space is easy and practical to be used but cannot represent human visual perception well. HSV color space is better to represent human visual perception than RGB.
HSV color space consists of three components, namely hue, saturation, and value. Hue represents color based on their dominant wavelength. Saturation represents the purity of color or the amount of white lights mixed with a hue. Value represents the brightness of color.
Hue (H) ranges from 0º to 360º modeled in a circle form, while red at 0º, green at 120º and blueat 240º.Saturation (S) ranges from 0 to 1. Value (V) ranges from 0 to 1. In this study, we quantize HSV color space into 72 bins that consist of 8 bins for H, 3 bins for S, and 3 bins for V. Thus, HSV image that has been quantized has 72 features.
3.2. Edge Orientation Detection in HSV Color Space
There are various edge detection methods, such as Sobel, Robert, Prewit, Canny, and LoG operator. Sobel operator is used in this study that applied at each component of HSV color space separately. In Cartesian space the dot product of vectors a(x1,y1,z1) and b(x2,y2,z2) is
defined as:
ab = x1x2+y1y2+z1z2 (1)
cos(�,�) = ��
|�||�|=
�1�2+�1�2+�1�2 ��12+�12+�12��22+�22+�22
(2)
HSV color space based on cylinder coordinate must be transformed into Cartesian coordinate. Let (H,S,V) are a point of cylinder coordinate, and (H’,S’,V’) are a point of Cartesian coordinate, so that H’ = S.cos(H), S’=S.sin(H),andV’=V. After point of H’,S’, and V’ is obtained, Sobel operator is applied in each H’,S’,and V’ layer to do edge detection. Edge detection yields the gradients along x and y directions that denoted by a(H’x, S’x, V’x) and b(H’y, S’y, V’y), where H’xis gradient of H’ along horizontal direction, H’y is gradient of H’ along vertical direction, and so
on. The dot product of vectors a(H’x, S’x, V’x) and b(H’y, S’y, V’y), is defined as:
|�| = �(�’�)2 + (�’�)2+ (�’�)2 (3)
|�| = �(�’�)2 + (�’�)2+ (�’�)2 (4)
��= �′��′�+�′��′�+�′��′� (5)
TELKOMNIKA Vol. 14, No. 3, September 2016 : 1175 – 1182
cos(�,�) = ��
|�||�| (6)
�= arccos(��) = arccos � ��
|�|.|�|� (7)
After � of edge orientation is obtained, it is quantized into m-bins, where m={6,12,18,24,30,36}. While edge orientation is quantized into six bins, each bin has 30º as the step-length interval.
3.3. Micro-structure Definition and Map Extraction
Micro-structure of an image is found using 3x3 kernel convolved onto throughout pixels on image while looking for the similarity among the pixel that aligned with center grid of kernel to the pixels that aligned with 8-neighbor grids of kernel that has 1 grid distance from the center. Padding is added into an image at convolution step.Kernel is moved with a step-lengthof two pixelsfrom right to left and from top to bottom with different starting point. Starting points used in this study are M1(0,0), M2(0,1), M3(1,0), andM4(1,1). The different starting point is used to avoid an overlapping. The micro-structure map is built in each convolution from positions of pixel that has the same value with the center pixel. The final micro-structure is obtained by combining four micro-structure map, M1, M2, M3, and M4, based on following rule:
M(x,y)=UNION(M1(x,y), M2(x,y), M3(x,y,M4(x,y))) (8)
1 1 4 3 4 4 1 1 4 3 4 4 1 1 4 3 4 4 1 1 4 3 4 s
After micro-structure map (M) is obtained, the next process is finding the micro-structure feature based on M, in both edge orientation image that has been quantized and HSV image that has been quantized. M is as a mask. If we want to find micro-structure feature in quantized HSV image, M obtained from quantized edge detection image is superimposed over quantized HSV image, as illustrated in Figure 3(a)-3(g).
(a) (b)
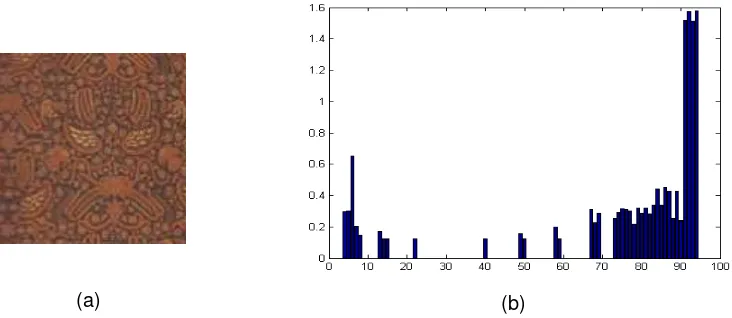
Figure 4. Feature representation of MSCD: (a) Batik Cloth Image. (b) Feature extraction result
Do the same way to find micro-structure feature in quantized edge detection image, M obtained from quantized HSV image is superimposed over quantized edge detection image, as illustrated in Figure 3(h)-3(j). Micro-structure features are obtained from values of pixels that their position is aligned with M. While values of pixels that their position is not aligned with M, are neglected. Figure 3(k) and 3(l) are micro-structure feature of quantized HSV color and micro-structure feature of quantized edge orientation respectively. Then, those Micro-structure features are plotted to histogram as shown in Figure 4. Figure 4(b) is feature extraction result using MSCD of Batik image in Figure 4(a).
4. Gray Level Co-occurrence Matrix
The use of Gray Level Co-occurrence Matrix (GLCM) is performed to detect four features, these are energy, entropy, contrast and correlation in four directions; 0°, 45°, 90° and 135°; so there are 16 features totally. The first step of GLCM is transforming the RGB image into gray scale image. The second step is creating a co-occurrence matrix. The third step is deciding a spatial relationship between the reference pixel and the neighbour pixel. Parameters that are considered are edge orientation (θ) and distance (d). Furthermore, the next step is creating a symmetrical matrix by adding co-occurrence matrix with its transposed matrix. Then, it is followed by normalizing the symmetrical matrix by computing the probability of each matrix element. Moreover, the final step is computing GLCM features. Each feature is computed by one distance pixel in four directions, those are 0°, 45°, 90° and 135°, to detect co-occurrence. When GLCM has a matrix with a size LxL, in which L is the number of gray levels of the original image and when the probability of pixel i is the neighbour of pixel j within distance d and edge orientation θ is P, the energy feature, the entropy feature, the contrast feature and the correlation feature can be calculated by equations (9), (10), (11) and (12).
���=∑�−1�,�=0�2(�,�,�,�) (9)
���=∑�−1�,�=0�(�,�,�,�). log�(�,�,�,�) (10)
TELKOMNIKA Vol. 14, No. 3, September 2016 : 1175 – 1182
����=∑ (�−��)��−����(�,�,�,�)
���� �−1
�,�=0 (12)
Where ��=∑�−1�,�=0�.�(�,�,�,�), ��=∑��−1,�=0�.�(�,�,�,�), ��=∑�−1�,�=0(� − ��)2.�(�,�,�,�), ��=
∑�−1�,�=0(� − ��)2.�(�,�,�,�). Energy, also called as Angular Second Moment, is the representation of image homogeneity. When the value of energy is high, the relationships between pixels are highly homogenous. Entropy is the opposite of energy which represent the randomness value between images. A higher value of entropy indicates that the relations between pixels are highly random. Contrast is a variation of an image’s gray level. An image with a smooth texture has a low contrast value and an image with a rough texture has a high contrast value. Correlation is a linear relationship between pixels. Let, each GLCM feature 0°, 45°, 90° and 135° as Hasm(θ),
Hent(θ), Hcont(θ), Hcorr(θ) where �=∈0,45,90,135. So, the feature of GLCM is denoted as
follows:
�����= [����(0°) …����(135°),����(0°) …����(135°),
�����(0°) … �����(135°),�����(0°). . .�����(135°)] (13)
So, the final feature of a batik image is a combination of EMSD features and GLCM features denoted as follows:
�= [�����,�����] (14)
For example, if we set the quantization of color = 72, it consists of R=8, G=3, B=3; quantization edge orientation = 6 and the total GLCM features are 16, so the total feature = 94.
5. Performance Measure
For each template image in the dataset, an K-dimensional feature vector T=[T1,T2,…TM] is extracted and stored in the database. Let Q=[Q1,Q2,…QM] be the feature
vector of a query image and the distance between them is simply calculated as:
�(�,�) =∑ |��−��|
|��+��|+|��+��| �
�=1 (15)
Where �� =∑ ��
� �
�=1 and�� =∑��=1���. The class labels of the template image that yield the smallest distance will be assigned to the query image. In this experiment, performance was measured using precision and recall which are defined as follows:
����������=���_���������
���_�������� * 100 (16)
����������=���_���������
���_�������� * 100 (17)
Where img_retrieved is the number of retrieved images, img_relevant is the number of relevant retrieved images, and img_database is the number of all relevant images in the database.
6. Results and Discussion
In this study, there are 4 feature extraction methods of CBIR used to test the performance of MSCD, namely, MSD, EMSD, GLCM, and MSCD. MSD has 72 features, EMSD has 78 features, and GLCM has 16 features, whereas MSCD has 94 features. We compare the performance among those methods in order to know the performance MSCD against to its predecessor (MSD and EMSD) and the famous GLCM.
6, and 8 retrieval images. Scheme of 4 retrieval images is chosen to know the maximum precision that can achieve. Then, scheme of 6 retrieval images is chosen as a baseline of this CBIR, because there are 6 images in each class of dataset. Whereas, scheme of 8 retrieval images is chosen to know the maximum recall that can achieve.
Table 1 and Table 2 show the performance results of four feature extraction methods of CBIR. According to that table, MSCD is superior to MSD, EMSD, and GLCM in all schemes. Adding some features to a method does not give guaranty that it can help the method to achieve an optimal precision or to increase the precision. Even so, the performance results show that our proposed method fusing local features and global features can increase the precision effectively and significantly. Thereby it indicates that feature extraction results of MSCD is more visually relevant compared to MSD, EMSD, and GLCM. The results show that adding GLCM features on EMSD is the right decision because it can increase the precision of CBIR. GLCM is a well-known feature extraction method for its reliable and simple enough. GLCM represents features globally, whereas EMSD represents features locally. Thus, MSCD is a combination method of local method and global method.
Based on Haralick proposed method [17], GLCM calculated 14 features on 4 orientation angles. We have done some examinations to know which features on which orientation angle should be used in this study. Because feature representation and orientation angle are important things in GLCM that can influence the retrieval result of an image. Our examinations indicate that energy, entropy, contrast, and correlation features on 0°, 45°, 90°, and 135° are the best combination features to represent Batik image, because they can increase the precision and recall significantly. When we use just three or two or one of those orientation angle, the precision and recall are going down.
MSCD is superior compared to MSD by 20.25% and 19.55% for average precision and average recall respectively. Compared to EMSD, MSCD is superior by 19.03% and 18.33% for average precision and average recall respectively. Moreover, compared to GLCM, MSCD is superior by 14.86% and 14.67% for average precision and average recall respectively.
Table 1. Average comparison of precision
Performance Retrieval MSD EMSD GLCM MSCD (Proposed) Precision (%) 4 70.50 71.50 78.00 92.50
Precision (%) 6 61.67 63.33 67.33 84.67 Precision (%) 8 51.50 52.50 54.50 67.25
Average (%) 61.22 62.44 66.61 81.47
Table 2. Average comparison of recall
Performance Retrieval MSD EMSD GLCM MSCD (Proposed)
Recall (%) 4 47.00 47.67 52.00 61.67
Recall (%) 6 61.67 63.33 67.33 84.67
Recall (%) 8 68.67 70.00 72.67 89.67
Average (%) 59.11 60.33 64 78.67
7. Conclusion
This study explains a combination method of local feature extraction method and global feature extraction method for CBIR, namely MSCD. MSCD combines EMSD and GLCM as local and global feature extraction method respectively. According to experimental results, combination of local and global feature extraction method can improve the precision effectively and significantly. Some examinations have been done to determine the appropriate features that should be used for Batik image retrieval, in order to achieve the optimal performance. At GLCM, the determination that should be done is the right selection of feature representations and orientation angles. Whereas, at EMSD, the determination that should be done is the right quantization selection on color space and edge orientation. Those selections are very sensitive that can influence the result of CBIR significantly, especially the precision.
TELKOMNIKA Vol. 14, No. 3, September 2016 : 1175 – 1182
Moreover, compared to GLCM, MSCD is superior by 14.86% and 14.67% for average precision and average recall respectively.
References
[1] Ida Nurhaida, Ruli Manurung, Aniati Murni Arymurthy. Performance Comparison Analysis Features Extraction Methods for Batik Recognition. In Proc. ICACSIS. 2012.
[2] A Haake. The Role of Symmetry in Javanese Batik Patterns. Journal of Computers Math. Applic. 1989; 17(4-6): 815-826.
[3] Hamidin AS. Batik, Warisan Budaya Asli Indonesia. Yogyakarta: Penerbit NARASI. 2010.
[4] [Veldhuisen-Djajasoebrata. On the origin and nature of Larangan: forbidden batik patterns from the central Javanese principalities. In Irene Emery Round Table on Museum Textiles, 1979 Proc. (Eel. M. Gittinger). 1979: 201-221.
[5] M Cheong, KS Loke. An approach to texture-based image recognition by deconstructing multispectral co-occurrence matrices using Tchebichef orthogonal polynomials. In Proc. ICPR’08, IEEE. 2008. [6] Kar-SengLoke, Marc Cheong. Efficient Textile Recognition via Decomposition of Co-occurrence
Matrices. 2009 IEEE International Conference on Signal and Image Processing Applications. 2009. [7] A Haris Rangkuti, Rizal Broer Bahaweres, Agus Harjoko. Batik Image Retrieval Based on Similarity of
Shape and Texture Characteristics. In Proc. ICACSIS. 2012..
[8] Jun Yue, Zhenbo Li, Lu Liu, Zetian Fu. Content-based image retrieval using color and texture fused features. Journal of Mathematical and Computer Modelling. 2011; 54: 1121-1127.
[9] Guang-Hai Liu, Jing Yu Yang. Image Retrieval based on the texton co-occurrence matrix. Journal of Pattern Recognition. 2008; 41.
[10] Guang-Hai Liu, Lei Zhang, Ying-Kun Hou, Zuo Yong Li, Jing Yu Yang. Image Retrieval based on multi-texton histogram. Journal of Pattern Recognition. 2010; 43.
[11] Guang-Hai Liu, Zuo-Yong Li, Lei Zhang, Yong Xu. Image Retrieval based on micro-structure descripor. Journal of Pattern Recognition. 2011.
[12] Agus Eko Minarno, Nanik Suciati. Batik Image Retrieval Based on Color Difference Histogram and Gray Level Co-Occurence Matrix. TELKOMNIKA Telecommunication Computing Electronics and Control. 2014; 12(3): 597-604.
[13] Agus Eko Minarno, Nanik Suciati. Image Retrieval using Multi Texton Co-Occurence Descriptor. Journal of Theoretical and Applied Information Technology. 2014; 67(3).
[14] Agus Eko Minarno, Yuda Munarko, Fitri Bimantoro, Arie Kurniawardhani, Nanik Suciati. Texture Feature Extraction using Co-Occurence Matrix of Sub-Band Image for Batik Image Classification. ICoICT 2014. Bandung. 2014.
[15] Agus Eko Minarno, Yuda Munarko, Fitri Bimantoro, Arrie Kurniawardhani, Nanik Suciati. Batik Image Retrieval Based on Enhanced Micro Structure Descriptor. Asia-Pasific Conference on Computer Aided System Engineering, APCASE. Bali. 2014: 91-96.
[16] Fanani A, Yuniarti A, Suciati N. Geometric Feature Extraction of Batik Image Using Cardinal Spline Curve Representation. TELKOMNIKA Telecommunication Computing Electronics and Control. 2014; 12(2): 397-404.
[17] Haralick, Robert M. Statistical and structural approaches to texture. Proceedings of the IEEE 67. 1979; 5: 786-804.