DOI: 10.12928/TELKOMNIKA.v14i3A.4386 47
Harmonic Estimation Algorithm based on ESPRIT and
Linear Neural Network in Power System
Xiangwen Sun*1, Ligong Sun2, Shuai Zhao3
1,2
School of Electrical Engineering, Henan University of Science and Technology, Luoyang, P.R. China
3State Grid Luoyang Power Supply Company, Luoyang, P.R. China
*Corresponding author, e-mail: [email protected]
Abstract
In this paper, the drawbacks of current harmonic frequency estimation algorithm in power system are pointed out. In order to improve the detection accuracy and reduce the computational complexity, a new harmonic estimation algorithm for power system is proposed by combining the ESPRIT algorithm with linear neural network. Theoretic analysis and simulation experiments indicated that the new algorithm has super resolution characteristics, ideally suited for harmonic analysis in power system.
Keywords: Harmonic frequency estimation, ESPRIT, neural network
Copyright © 2016 Universitas Ahmad Dahlan. All rights reserved.
1. Introduction
Over the past few years, with the rapid development of power electronic technology, more and more power electronic equipments have been introduced into power system, which causes an increasingly severe waveform distortion. When the harmonic component of voltage and current in power system is surpasses the limitation standard, the security, reliability of power system and electrical equipment operation will be seriously affected. Therefore, harmonics parameters rapid detection method becomes an hot research subject for scholars at home and abroad ,substantial achievements have been made, such as fast Fourier transform (FFT) [1, 2], multiple signal classification (MUSIC) algorithm [3, 4] and so on.
Theoretically, when synchronous sampling condition is met, the precise harmonic frequency, amplitude and phase can be obtained through FFT algorithm. However, as the actual grid frequency often fluctuates near industrial frequency, which caused nonsynchronous sampling. Hence, spectrum leakage and picket fence effect will be appeared, thus limiting FFT application in accurate detection of harmonics. The results can be corrected by interpolated FFT [5], but with high load.
MUSIC algorithm, one of the most effective methods for frequency estimation, time delay estimation, DOA estimation, is with extremely high accuracy and is ideally suited for harmonic analysis in power system. The defects of MUSIC algorithm [4] are: (1) huge computation complexity; (2) the information about harmonic phase and amplitude lost during the course of constructing pseudo space spectrum, Therefore, we can only estimate harmonics frequency. The main reason which caused high computational complexity is MUSIC algorithm needs to calculate the sample covariance matrix and carries out eigen decomposition. It is well known that for the eigen decomposition of N-dimension matrix, the computational complexity is O(N3). Beyond that, the other reason is that the MUSIC algorithm needs to calculate space spectrum and compare each other point-by-point in whole frequency domain in order to find the peak. If high estimation accuracy is required, the search step should not be too large; otherwise it will lead to the picket fence effect.
In this paper, a low-complexity method for harmonics parameter estimation algorithm based ESPRIT and linear neural network is proposed, which achieves high-precision detection to harmonic frequency, amplitude ad phase with lower computational complexity.
described estimation strategy of the signal subspace ranks. Section 6 discussed the method to obtain the harmonic amplitude and phase. Section 7 verified performance of the new algorithm we proposed through simulation experiment. Finally a conclusion is given in Section 8.
2. Signal Model
Hypothesize the harmonic signal in power system can be described as
1
cos 2
M
i i i
i
x n
A
f n
e n
(1)Where
A
i,f
i,
i are the amplitude, normalized harmonic frequency, Initial phase, respectively,e n
is the zero-mean wide-sense stationary Gaussian white noise, M is the order of harmonic. Using complex representation for the mathematical simplicity, formula (1) can be expressed as:
2
1
i i M
j n i i
x n
A e
e n
Where
2
f
,j
1
(2)Denote
[ ( ), ( -1),
x n x n
, (
x n
K
1)]
TasX(n)
and[ (
1), ( ),
, (
2)]
Tx n
x n
x n K
as
Y(n)
,X(n)
can be expressed as:( )
( )
AS n
E n
X(n)
(3)Where
1 2
1 2
1
1
1
M
M
j j j
jK jK jK
K M
e
e
e
A
e
e
e
C
1 1 2 2
( ) ( ) ( ) 1
1 2
1
( ) ( ) ( 1) ( 1)
( ) j n j n j n M M T M
M
T M
E n e n e n e n M C
S n A e A e A e C
Y(n)
can be expressed as:1 =
(
1)
(
1)
=A
(
1)
(
1)
AS n
E n
S n
E n
Y(n)
X(n
)
(4)
Where
diag e
{
j1,
e
j2,
e
j M}
C
M
M
3. Frequency Estimation Method based Esprit
Denoted
R
Xas the covariance matrix of X(n),R
XYas the cross-correlation matrix ofX(n)and Y(n) :
2
{ ( )
( )}
{[
( )
( )][
( )
( )] }
AE{ ( ) ( ) }A
{ ( ) ( ) }
H H
X
H H H
H
R
E X n X
n
E
AS n
E n
AS n
E n
S n S n
E E n E n
APA
I
2
{ ( )
H( )}
{[
( )
( )][A
(
1)
(
1)] }
HXY
H H
R
E X n Y
n
E AS n
E n
S n
E n
AP
A
Z
(6){ ( )
H( )}
P
E S n S
n
,
2
E E n E n
{ ( ) ( ) }
H0 1 0
0 Z=
1
0 0
Where, H is the Hermitian transpose operator.
Structure matrix pencils
D
R
XX-
2I R
,
XY-
2Z
, it can prove that eji isgeneralized eigenvalue [5] of D. Therefore, harmonic frequency estimation can be obtained by request of generalized eigenvalue of
C
XX,
C
XY at unit circle.As mentioned above, ESPRIT algorithm need to compute eigen decomposition of sample autocorrelation matrix and matrix pencils D. In which the computational complexity is high. Therefore, find a method with a smaller expense of computational complexity to obtain signal eigen subspace and thereby reduce time cost makes sense.In order to do this, many researchers have conducted lots of studies on this area, and achieved considerable valuable results, including QR iteration, power method, Lanczos algorithm and so on. By which the course of eigen decomposition can be preventd in some degree.however, these methods still need calculation of sample covariance matrix and the complexity is still relatively high.
4. Rapid Subspace Decomposition Based MSWF
As is known to all, canonical linear Wiener filter can estimate desired signal
d k
through observed data
x k
under the linear minimum mean-square error criterion. The coefficient of Wiener filter can be obtained by solving the Wiener-Hopf equation:1
wf x xd
W
R r
(7)Where,
r
xd
E x k d k
[ ( )
*( )]
.Evidently, IfR
x1 can be get efficiently, Wiener filter will well suited for estimate desired signal through received data. Unfortunately, the computation cost is amazing for solving the Wiener-Hopf equation directly, because the computation complexity of computingR
x1 directly isO N
(
3)
. Numerous scholars dedicated themselves to deal with this problem, and have gained considerable achievement. The basic idea of these methods is project the received signal onto a well-chosen reduced-rank subspace, so that, the approximate solution can be obtained at faster convergence speed and lower computation complexity. Multistage Wiener Filter (MSWF) is a typical representative of these methods.The first step of MSWF is applying a full rank unitary pre-filtering matrix
T k
1( )
to theobserved- signal vector
x k
0( )
to get new observation signalz k
1( )
. Where, 1 1 1( )
( )
( )
H
h
k
T k
B k
,1
B
is the nullspace ofh
1 and 1 1 0 1 0 11
1 0
( )
( )
( )
( )
( )
( )
( )
( )
( )
H
b k
h
k x k
z k
T k x k
x k
B k x k
.h
1 is thenormalized cross-correlation vector of signal vector
x k
0( )
and desired signal vectord k
0( )
1 1 1 0
1 1 1
1 1 1 1 1
1
1
d bz z z
x x
w
R r
R r
w
(8)Clearly,
h
1 can be partitioned to a scalar Wiener filter
1 and another vector Wiener filterw
1which spans a space orthogonal to the space spanned by
1.The new observationx
1can also be pre-filtered with
2 2 2
( )
( )
( )
Hh
k
T k
B k
, Performing this decomposition N-1 times wil leadto a series of
h
i. which can be proven thatspan
{ ,
h h1 2,
hM}
V
s.The basic steps of MSWF algorithm based on related subtraction structure are as follows:
1. Use N-point sampling data to construct data array
X
Define training signal 0
( )
1 1(
)
Td k
e x k
, observation signal 0
[x , x
2 3,, x ]
T pX
. 2. M times forward recurrence:
FOR i1, 2,,M
*
1 1
*
1 1 2
[ ( ) (k)]
[ ( ) (k)]
i i
i
i i
E d k X h
E d k X
H
1
i i i
d k
h X
k
1
( )
i i i i
X k
X
k
h d k
Constructured m dimensional Krylov subspace
1
(
, )
{ ,
,
,
}
m m
x x x
R f
Span f R f
R
f
Composed of
R
x
C
N N and any vectorf
C
N1. According toError! Reference source not found. and the shift invariant property of Krylov subspace, it can be
derived directly that:
2 2 2 2
(
, )
(
, )
(
, )
(
(
)
, )
m mx x n N
m H H
s s s n n n n N
m H
s s n s
R
f
R
I
f
V
V
V V
I
f
V
I V
f
(9)FromError! Reference source not found., we can know that if
f
span V
{ }
s ,(
, )
m x
R f
is equivalent to the signal subspace.
It can be proved that [6-9], when
e
n
is white noise,d k
0( )
e x k
1T 0(
)
span V
{ }
s ’Therefore,
(
,
0( ))
mx
R d k
is equivalent to the signal subspace
V
s.Meanwhile, according to MSWF theory,{ , ,
h h1 2
hM}
obtained by M times MSWF forward recurrence is a set ofstandard orthogonal basis [8-10] of
(
,
0( ))
mx
R d k
. Therefore, MSWF can be used for rapid calculation of signal subspace.
computation of signal subspace with MSWF forward recurrence can significantly reduce calculation amount of algorithm.
5. Estimating the Number of Signal M
As mentioned before, the dimension of signal subspace M is required to obtain the signal subspace using MSWF. Apparently M cannot be obtained directly in the actual situation.
Theoretically, when the real covariance matrix Rx is known, as mentioned before, the dimension of signal subspace M is required to obtain the signal subspace using MSWF.
Apparently Rx cannot be obtained directly in the actual situation, and the approximate
estimation
R
x can just be obtained. So the number of harmonic M must be estimated by other effective methods. At present, the two common criterions are AIC criterion and MDL criterion used to estimate the dimension of signal subspace. In comparison, the AIC criterion is not the consistent estimation of M and overestimation will appear with fewer samples. In contrast, MDL criterion is the consistent estimation, which is described below:( )
1 1
1
( ) ln (2 ) ln
2
1
M k N
M M k i i k M i i k k
MDL k M k N
M
k
where the k (k∈[0, 1, …, M-1]) is the signal subspace dimension number M when the
minimum value of the formula is obtained. Obviously, the eigenvalue of
R
xis required, which needs to calculateR
xand carry out eigen decomposition. It can be proved that in the absence of eigenvalues of covariance matrix, the MDL criterion can be calculated by the following formula using MSWF recursive results:( ) 1 2 1 2 1
( ) ln (2 ) ln
2
1
M k N i
i
M M k
d i k M d i k k
MDL k M k N
M
k
where 2 2
( ) i
d E di
. Thus the information generated by the MSWF recursion can be made full use of to obtain the estimation of signal subspace dimension number M.6. Estimate the Harmonic Amplitude and Phase Rewrite formula (1) into
1 1 1
c o s 2
= [c o s ( 2 ) c o s s in ( 2 ) s in ] (n )
[ c o s ( 2 ) s in ( 2 )] (n )
M
i i i
i
M
i i i i i
i
M
i i i i
i
x n A f n e n
A f n f n e
B f n C f n e
(10)cos
i i i
B
A
,
C
i
A
isin
i.Rearrangement of formula Error! Reference source not found. in a matrix form gives:
x n
r n W
e n
(11)whewe,
r n
( ) [cos(2
f n
1),sin(2
f n
1),
cos(2
Mf
1),sin(2
Mf
1)]
,1 1
[ , , , ]T
M M
W B C B C
It is well known that artificial neural networks can approximate arbitrary function with high accuracy. Therefore a neural network can be constructed to approximate the function with
( )
r n
as input and x(n) as output so as to calculate W. after that , the harmonic amplitudeA
iand phase
ican be calculated as follow:2 2 i
i i i i
i
C
A
B
C
arctg
B
(12)Considering the linear relationship between x(n) and
r n
( )
, in order to reduce computational load, we does not adopt BP or RBF neural network, instead of utilizing a linear network with single neuron to realize the method.In summary, the harmonic frequency estimation algorithm in power system proposed in this paper is as follows:
1. Apply MSWF forward recurrence. With the recursive result, combine the MDL criterion to estimate signal subspace dimension M.
2. Use MSWF recurrence to complete decomposition of
R
X. Take its minimumeigenvalue as the estimate of noise power
2.3. Structure matrix beam
C
XX,
C
XY and use MSWF to complete its generalized characteristic decomposition.4. Use characteristic root of
C
XX,
C
XY on the unit circle to complete harmonic frequency estimation.5. Construct linear neural network, and estimate weigh vector W. Calculate harmonic amplitude and phase using W.
7. Results and Analysis Experiment 1:
The simulation analysis each harmonic parameter of line voltage
V
bc of Xi’an 35kV steel busbar, with phase position to be self-designed. The simulation signals are as follows:
37.66cos 2 50 / 4 0.933cos 2 100 /36
1.813cos 2 150 /18 0.885cos(2 200 /12)
1.943cos 2 250 /9 0.97cos 2 300 /8
x t t t
t t
t t
Figur 1. Test 1 time series analysis result
[image:7.595.215.377.89.210.2]For comparison, under the same condition, spectrum estimation result conducted by FFT is shown in Figure 2.
Figure 2. FFT analysis result
The experimental result revea that, even no noise and the synchronous sampling condition is met, if the amplitude of the harmonic component is low and amount of sample data is small, FFT may miss some harmonic components.
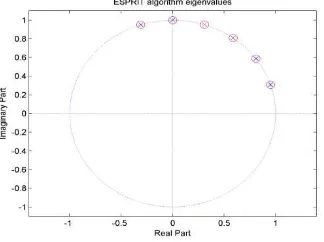
For comparison, the algorithm we propsed in this paper accurately estimates six harmonic components (corresponding to 6 characteristic roots in circle unit in Figure 1) in the detected signals.
Experiment 2:
0.3cos 2 37 70 0.7cos 2 50 80
1.0cos 2 87 30 0.5cos 2 88.66 90
+0.4cos 2 150 40
x t t t
t t
t
Figure 3.Experiment 2 analysis result
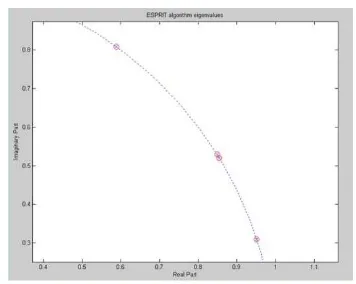
As two harmonic frequencies of 88.6Hz, 87 Hz are very close, the local details in the above figure is especially enlarged as in Figure 4.
[image:8.595.208.386.321.463.2]For comparison, use MUSIC algorithm and FFT algorithm to estimate the harmonic frequency under the same condition, the result is shown Table 1.
Figure 4.Partial enlarged figure of experiment 2
Table 1. Experiment 2 harmonic frequency estimation result
True value
(Hz) 37 50 87 88.66 150
ESPRIT
estimation 37.00 50.00 86.99 88.66 150
Relative
error (%) 0 0 0.01 0 0
MUSIC
estimation 37.10 50.00 87.10 88.71 150
Relative
error (%) 0.2 0 0.11 0.05 0
Analysis the data in Table 1, we can find that, the estimation accuracy of the algorithm we proposed in this paper is better than MUSIC algorithm. It should be stressed that our algorithm avoids the course of Eigen decomposition and pseudo-spatial spectrum peak search, so its computational complexity is much lower than MUSIC algorithm.
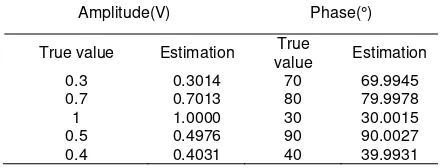
[image:8.595.175.415.518.613.2]Table 2. Detection Results of Harmonic Amplitude and Phase
Amplitude(V) Phase(°)
True value Estimation value True Estimation
0.3 0.3014 70 69.9945
0.7 0.7013 80 79.9978
1 1.0000 30 30.0015
0.5 0.4976 90 90.0027
0.4 0.4031 40 39.9931
Analysis the data in Table 2, its clearly that, the algorithm realized the estimation of harmonic amplitude and phase with high accuracy, where the error is less than 1%.
8. Conclusions
MUSIC algorithm, one of the most effective methods for frequency estimation, time delay estimation, DOA estimation, is with extremely high accuracy and is ideally suited for harmonic analysis in electric power. But as the algorithm requires eigen decomposition of sampling signal autocorrelation matrix, and search space spectral peak in the full frequency domain, which is not conducive to real-time detection of harmonics. This paper combines ESPRIT algorithm based on MSWF fast subspace decomposition technique and linear neural network, dramatically reduces computational complexity without affecting estimation accuracy. The simulation result shows that the algorithm can achieve estimation of harmonic with ultra-high resolution and has a good anti-noise effect. Such algorithm does not need synchronous sampling, and there is no spectrum leakage problem. Thus, it is very suitable for harmonic analysis in power system, with superiority incomparable for Fourier analysis method.
References
[1] Jia QQ, Yang XW, Song ZY. A windowed frequency shift algorithm for harmonics signal in power system. Journal of Chinese Electrical Engineering Science. 2014; 36(10): 1631-1640.
[2] Blazek P, Kolb M, Partl M, et al. The usage of social media applications in product configurators.
International Journal of Industrial Engineering and Management (IJIEM). 2012; 3(4): 179-183.
[3] Sun XW, Sun LG. MUSIC algorithm for harmonic frequency high resolution estimation in power system. Electrical Measurement & Instrumentation. 2008; 10: 28-31.
[4] Sun XW, Sun LG. Harmonic frequency estimation based on modified-music algorithm in power system. The Open Electrical and Electronic Engineering Journal. 2015; 9(1): 38-42.
[5] Wang XL, Li N. Study on interharmonics detection method based on windowed interpolation FFT algorithm.Modern Power. 2012; 29(5): 28-31.
[6] Saad Chakkor, Mostafa Baghouri, Abderrahmane Hajraoui. ESPRIT Method Enhancement for Realtime Wind Turbine Fault Recognition. International Journal of Power Electronics and Drive Systems (IJPEDS). 2015; 5(4): 552-567.
[7] Rahnemaei A, Salimi M. A Novel Grid Connected Photovoltaic System. Bulletin of Electrical Engineering and Informatics. 2016; 5(2): 133-143.
[8] Schmidt, RO. Multiple emitter location and signal parameter estimation. IEEE Transactions on Antennas and Propagation. 1986; 34(3): 276-280
[9] Hu R, Yi G, Xu Y. Study on the Impact of Grid Harmonic Voltage on SVG and the Suppression.
Indonesian Journal of Electrical Engineering and Informatics. 2015; 3(3): 129-134.