Versi Online tersedia di : http://jurnal.buddhidharma.ac.id/index.php/te
JURNAL TECH-E
| 2581-1916 (Online)|
Article
Application of Neural Network Methods Based on
Genetic Algorithm for Breast Cancer Prediction
Rino1
1University of Buddhi Dharma, Information System, Banten, Indonesia
SUBMISSON TRACK A B S T R A C T Received: 15 Agustus 2017
Final Revision: 20 Agustus 2017 Online Available: 15 September 2017
Cancer is a big challenge for mankind. Cancer can affect various parts of the body. This deadly disease can be found in humans of all ages. Breast cancer is the most common cancer among women, and is the biggest cause of death also for women. In a similar study, there are several methods used but there are problems due to the formation of nonlinear cancer cells. Neural network can solve the problem, but neural network is weak in terms of parameter values, so it needs to be optimized. Genetic Algorithm is one of the best optimization methods, therefore the parameter values of neural network will be optimized by using Genetic Algorithm so as to get the best parameter value. Neural Network algorithm based on genetic algorithm has a higher accuracy value than using only Neural Network algorithm. This is evident from the increase of accuracy value for neural network algorithm model of 95.42% and the accuracy value of Neural Network algorithm based on Genetic Algorithm of 96.85% with difference of 1.43% accuracy. So it can be concluded that the application of Genetic Algorithm optimization technique can increase accuracy value on Neural Network algorithm KEY WORDS
Neural Network, Genetic Algorithm, Prediction, Breast Cancer
CORRESPONDENCE
Telepon: 089658939791 E-mail: [email protected]
INTRODUCTION
Cancer is a big challenge for mankind, cancer can affect various parts of the body. Breast cancer is the most common cancer found among women (Dellen, Walker, & Kadam, 2005, p 2). Information about tumors from certain examinations and diagnostic tests collected determines how malignant the cancer is. By knowing the malignancies of the cancer, treatment measures can be performed better and the mortality rate can be reduced.
In this research will be applied Neural Network method optimized with Genetic Algorithm in predicting breast cancer.
I. METHOD
a. Neural Network
RINO /JURNAL TECH-E -VOL.1.NO.1(2017)
- Knowledge gained by the network from the environment, through a learning process.
- The power of connection between units called synaptic weights, serves to store the knowledge that has been obtained by the network.
b. Genetic Algorithm
Optimization is about finding the optimal parameter values for an object or system that minimizes goals (costs) and functions (Shukla, 2010, p. 147). In optimization, we are given a function, known as a function of purpose. The goal is to minimize or maximize the value of the objective function by adjusting various parameters. Each combination of parameters marks solutions that may be good or bad, depending on the value of the purpose function. Soft-computing techniques produce the best set of parameters that provide the best values of the destination function in view of the constraints of the time. The genetic algorithm (GA), developed by John Holland in the 1960s and 1970s, is an attempt to mimic the computational process in which natural selection operates.
The steps in the Genetic Algorithm are as follows:
Ultimately, the Genetic Algorithm processes from the initial population through a series of genetic operations, such as selection, crossover and mutation, to find a better space, step by step until it reaches the optimal solution.
II. RESULTS
The purpose of this research is to develop the model that has been formed with Neural Network algorithm. Data were analyzed by doing two comparison that is using Neural Network Algorithm and Neural Network Algorithm based on Genetic Algorithm.
Neural Network Calculation Result
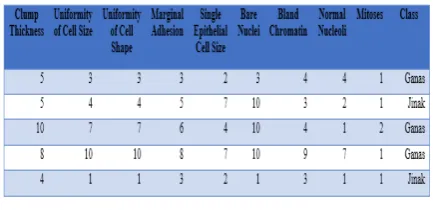
Neural network modeling will be performed on a dataset consisting of 9 attributes that are attributes of breast cancer, and a class representing benign or malignant.
Table 1. Dataset Of Breast Cancer
begin
x 0; initialize P(x);
evaluate P(x);
while(not termination condition) do recombine P(x) to yield O(x); evaluateO(x);
select P(x + ) from P(x) and O(x); x++;
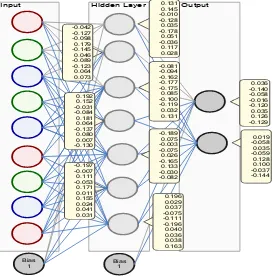
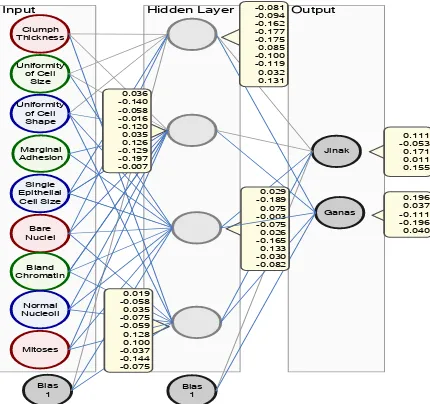
From that data, the hidden layer will be calculated by the calculation with (number of attributes + results) / 2 + 1 is 7 hidden layers, the weights for the hidden layer are initially
randomly assigned, the models with randomly assigned weights can be seen in Figure 1 Model will be formed with momentum of 0.1 and learning rate 0.3.
Output
Figure 1. Initial Model of Neural Network
𝑦ℎ𝑖𝑑𝑑𝑒𝑛1 = 𝑓(0.028 + (5 ∗ 0.131)
RINO /JURNAL TECH-E -VOL.1.NO.1X(2017)
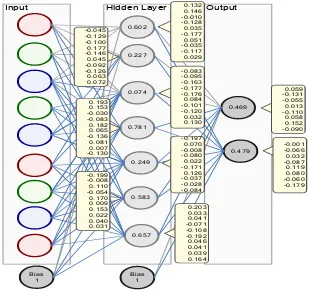
Output
Figure 3. Value Image of New Weight Change
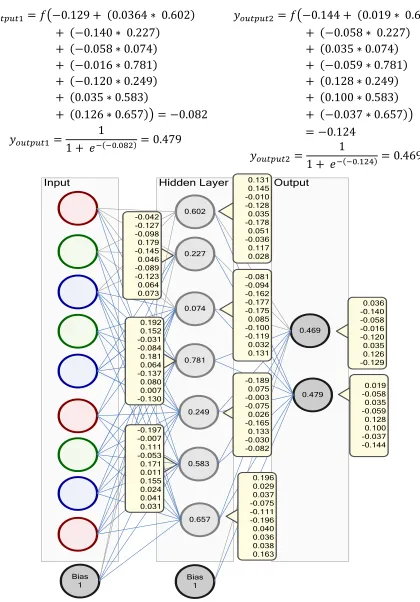
The calculation continued by applying the
model that has been adjusted to the second data.
The second data is entered into the input
variable, then adjusted the weights until it
becomes output, then calculated the error value,
and obtained the value of delta for output, then
the delta value is adjusted to the hidden layer
node and then calculated the new weight. The
following model is formed with 2 hidden layer
as in Figure 4
RINO /JURNAL TECH-E -VOL.1.NO.1X(2017)
Continue up to 9 hidden layers.
Result of model optimization calculation with
Genetic Algorithm
1. Determine the initial population C1 [0.3_0.1_3] = 95.14% C2 [0.2_0.4_8] = 96% C3 [0.5_0.9_4] = 96.57% C4 [0.1_0.2_5] = 96% C5 [0.02_0.08_9] = 96.57%
2. Evaluation of fitness values
Fitness C1 = 1/ (1 + |95.14 - 100|) = 1/ 5.86
= 0.170648
Fitness C2 = 1/ (1 + |96 - 100|) = 1/ 5
= 0.2
Fitness C3 = 1/ (1 + |96.57 - 100|) = 1/4.43
= 0.225734
Fitness C4 = 1/ (1 + |96 - 100|) = 1/5
= 0.2
Fitness C5 = 1/ (1 + |96.57 - 100|) = 1/4.43
= 0.225734
Total fitness = 0.170648 + 0.2 + 0.225734 + 0.2 + 0.225734 = 1.022116
The probability of each chromosome becomes: P[C1] = 0.170648 / 1.022116 = 0.166956 P[C2] = 0.195672507
P[C3] = 0.220849688 P[C4] = 0.195672507 P[C5] = 0.220849688
3. Selection of the parent Chromosome For the selection process used Roullete Wheel, for it required the cumulative value of probability of each chromosome, namely as follows:
C1 = 0.166956
C2 = 0.166956 + 0.195672507 = 0.362628117 C3 = 0.166956 + 0.195672507 + 0.220849688 = 0.583477805
C4 = 0.166956 + 0.195672507 + 0.220849688 + 0.195672507 = 0.779150312
C5 = 0.166956 + 0.195672507 + 0.220849688 + 0.195672507 + 0.220849688 = 1
The next step is to use a random number R between 0 until 1. Random numbers are used as many as chromosomes, for example as follows:
R1 = 0.227186742 R2 = 0.221614966 R3 = 0.857372275 R4 = 0.649737022 R5 = 0.799273008
Choosing chromosome to x as Parent. The result of Roulette Wheel selection in this population for crossover becomes:
P1 -> C2 -> 0.2_0.4_8
P2 -> C2 -> 0.2_0.4_8 -> because the same then repeated
P2 -> C5 -> 0.02_0.08_9
Both parent to be taken are C2 and C, then the child that produced by the parent chromosome will replace the existing chromosome, then taken R value randomly again
R1 = 0.849110706 R2 = 0.300092891 R3 = 0.002780315 R4 = 0.305677568 R5 = 0.306442102
is done by taking a random value of a number of attributes that is 1- 3.
R[C2] = 2 R[C4] = 3 Results of crossover
C2 = 0.2_0.4_8 >< 0.02_0.08_9 => 0.2_0.08_8
C4 = 0.2_0.4_8 >< 0.02_0.08_9 => 0.2_0.4_9
New populations are formed with crossover results that have occurred to be:
C1 [0.3_0.1_3] = 95.14% C2 0.2_0.08_8] = ? C3 0.5_0.9_4] = 96.57%
C4 [0.2_0.4_9] = ? C5 [0.02_0.08_9] = 96.57% 5. Chromosome Mutations
The number of chromosomes undergoing mutase in one population is determined by the percentage of p mutation. The mutation process is performed by substituting one randomly selected gene with a new value obtained randomly.
Total gen = (gene in chromosome) * number of chromosomes
= 3 * 5 = 15
In determining the position of the mutated gene is done by using a random number between 1 to total genes, ie between 1 to 15. Suppose we determine 10% then the number of genes that have mutations is 10% of 15 that is 1.5 or 1 gene. Then using a random number and the selected gen position 12 that mutated. Thus the mutation will be the 3rd chromosome of the number 8 gene. Then the gene value in that position we replace with a
random number 0-1 (Momentum). Suppose that the random number used is 0.3, the 8th chromosome changes to [0.5_0.3_4]. The population in the first generation becomes:
C1 [0.3_0.1_3] = 95.14% C2 [0.2_0.08_8] = 95.71% C3 [0.5_0.3_4] = 95.42% C4 [0.2_0.4_9] = 96.57%
C5 [0.02_0.08_9] = 96.57%
III. DISCUSSION
Testing Results with Confusion Matrix
Evaluation Model with Confusion Matrix, confusion matrix model will form a matrix consisting of true positive or positive tuple and true negative or negative tuples, then input the test data that has been prepared into confusion matrix so that the results obtained in Table 2 as below:
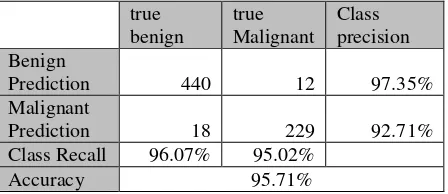
Table 2. Result of Confusion Matrix With 2 Hidden Layer
true benign
true Malignant
Class precision Benign
Prediction 440 12 97.35% Malignant
Prediction 18 229 92.71% Class Recall 96.07% 95.02%
Accuracy 95.71%
In Table 2 the accuracy of 95.71% and for the number of True Positive (TP) is 229, for False Negative (FN) is 440, for False Positive (FP) is 12, and for True Negative (TN) is 18. Confusion Matrix in continue until with 9 hidden layers.
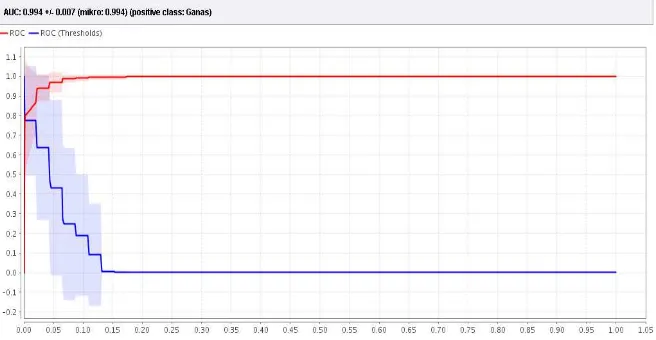
Testing Results With ROC Curve (AUC)
RINO /JURNAL TECH-E -VOL.1.NO.1X(2017)
Figure 5. The value of AUC in ROC Curve With 2 Hidden Layer
ROC is continued up to 9 hidden layers.
1.1.1. Determination of parameter values
The result of model testing conducted in chapter three is the determination of parameter value with Neural Network algorithm and Neural Network algorithm based on Genetic Algorithm to determine parameter value. The results obtained from the parameter values determined by the Genetic Algorithm tested on
the Neural Network method will result in accuracy and AUC.
Seeking to result of test of parameter value determination by Genetic Algorithm got best result for parameter value of Learning Rate is equal to 0.562070136566738 and Momentum parameter value is 0.9366372796859641 with 4 Hidden Layer. Comparison of results can be seen in table 3 below.
Table 3. Parameter Value Determination Results (Learning Rate, Momentum, Hidden Layer)
Learning Rate Momen
tum
Comparison Results Using Neural Network with Neural Network Based Genetic
Algorithm
a. Evaluation Model With Confusion Matrix
The confusion matrix model will form a matrix consisting of either positive or positive tuples and true negative or negative tuples, then input
the test data that has been prepared into the confusion matrix.
Table 4. Result of Confusion Matrix NN
true Benign
true malignant
Class precision Benign
Prediction 442 16 96.51% Malignant
Prediction 16 225 93.36% Class
Recall 96.51% 93.36% Accuracy 95.42%
After optimizing the visible increase as shown in Table 4-12 with 96.85% accuracy and for the number of True Positive (TP) is 234, for False Negative (FN) is 443, for False Positive (FP) is 7, and for True Negative (TN ) is 15 with the number of Hidden Layer 4.
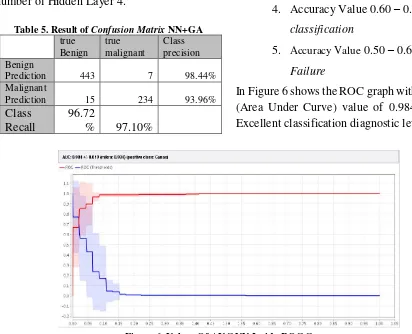
Table 5. Result of Confusion Matrix NN+GA
true Benign
true malignant
Class precision Benign
Prediction 443 7 98.44% Malignant
Prediction 15 234 93.96%
Class Recall
96.72
% 97.10%
Accurac
y 96.85%
b. Evaluation with ROC Curve
Accuracy has a diagnosis level that is
(Gorunescu, 2011):
1. Accuracy Value 0.90 – 1.00 =
Excellent classification
2. Accuracy Value 0.80 – 0.90 = Good
classification
3. Accuracy Value 0.70 – 0.80 = Fair
classification
4. Accuracy Value 0.60 – 0.70 = Poor
classification
5. Accuracy Value 0.50 – 0.60 =
Failure
In Figure 6 shows the ROC graph with the AUC (Area Under Curve) value of 0.984 with the Excellent classification diagnostic level.
Figure 6. Values Of AUC NN Inside ROC Curve
After optimized the increase as shown in Figure 4-22 shows the ROC graph with the value of
RINO /JURNAL TECH-E -VOL.1.NO.1X(2017)
Figure 7. Values of AUC Neural Network+GA inside ROC Curve
The result of the experiment is to get accuracy value, and the value of AUC (Area Under Curve) using parameter value that has been determined to get the best result as Table 4-13 as follows:
Table 6. Neural Network Testing and Neural Network Based genetic Algorithm
Accuracy AUC
Neural Network 95.42% 0.984
Neural Network Based GA
96.85% 0.993
The best neural network architecture obtained from the experiment can be seen in Figure 8
Figure 8. Best Neural Network Architecture from Experiment Results
The model test to determine the parameter values on the neural network is done using 10 folds cross validation which will randomly take 10% of the training data for as data testing. Then this process is done in rapid miner with initial test which then parameter value in adjusted and optimized so as to increase accuracy value.
IV. CONCLUSION
As for the model that is formed, later can be developed or implemented into an application. so it can help and facilitate for health
practitioners in diagnosing breast cancer, and the diagnosis can be more accurate and reliable.
REFERENCE
Abbas, H. A. (2002). An Evolutionary Artificial Neural Networks Approach For Breast Cancer Diagnosis. Artificial Intelligence in Medicine, vol.25, no.3, 1-30.
Adam, A., & Omar, K. (2006). Computerized Breast Cancer Diagnosis with Genetic Algorithms and Neural Network. Department of System and Management Sciences, Faculty of Technology and Information Sciences, 183-188.
Bellachia, A. (2000). Predicting Breast Cancer Survivability Using Data Mining Techniques.
Ninth Workshop on Mining Scientific and Engineering Datasets in conjunction with the Sixth SIAM International Conference on Data Mining (SDM 2006), Saturday, April 22, 2006. .
Calle, J. (2004). Breast cancer facts andfigures 2003—2004. American Cancer Society. p. 1—27. Retrieved from (http://www.cancer.org/).
Dellen, D., Walker, G., & Kadam, A. (2005). Predicting Breast Cancer Survivability: A Comparison of Three Data Mining
Methods. Artificial intelligence in medicine, Elsevier, 27-113.
Gorunescu, F. (2011). Data Mining Concepts, Models and Techniques. Springer; 1st Edition. edition (June 24, 2011).
Han, J., & Kamber, M. (2007). Data Mining: Concepts and Techniques 2nd Edition. Morgan Kaufmann Publishers is an imprint of Elsevier.
Haykin, S. (1999). Neural Networks: A Comprehensive Foundation.: Prentice Hall.
K. Hornik, M. Stinchcombe, H. White. (1989). Multilayer Feedforward Networks are Universal Approximators. Journal Neural Networks Volume 2 Issue 5, 1989, 359-366.
Larose, D. T. (2005). Discovering Knowledge In Data An Introduction to Data Mining. A John Wiley & Sons, Inc., Publication.
Lundin, M., & Burke, H. B. (1999). Artificial Neural Networks Applied to Survival Prediction in Breast Cancer. Journal Artificial Intelligence in Medicine Volume 34 Issue 2, June, 2005, 281-286.
Shukla. (2010). Real Life Application of Soft Computing. Taylor and Francis Group, LLC.
Wu, G. (2009). Research on Parameter Optimization of Neural Network. International Journal of Hybrid Information Technology Vol. 2, No. 1, January, 2009, 81.
Zhang, Q., & Wang, C. (2008). Using Genetic Algorithm to optimize Artificial Neural
BIOGRAPHY