DOI: 10.12928/TELKOMNIKA.v15i2.3965 665
Predicting the Level of Emotion by Means of
Indonesian Speech Signal
Fergyanto E. Gunawan*, Kanyadian Idananta
Binus Graduate Programs, Bina Nusantara University, Jl. Kebon Jeruk Raya No. 27, Jakarta 11530, Indonesia
Corresponding author, e-mail: [email protected]*, [email protected]
Abstract
Understanding human emotion is of importance for developing better and facilitating smooth interpersonal relations. It becomes much more important because human thinking process and behavior are strongly influenced by the emotion. Align with these needs, an expert system that capable of predicting the emotion state would be useful for many practical applications. Based on a speech signal, the system has been widely developed for various languages. This study intends to evaluate to which extent Mel-Frequency Cepstral Coefficients (MFCC) features, besides Teager energy feature, derived from Indonesian speech signal relates to four emotional types: happy, sad, angry, and fear. The study utilizes empirical data of nearly 300 speech signals collected from four amateur actors and actresses speaking 15 prescribed Indonesian sentences. Using support vector machine classifier, the empirical findings suggest that the Teager energy, as well as the first coefficient of MFCCs, are a crucial feature and the prediction can achieve the accuracy level of 86%. The accuracy increases quickly with a few initial MFCC features. The fourth and more features have negligible effects on the accuracy.
Keywords: Indonesia speech, mel frequency cepstral coefficient, teager energy, support vector machine
Copyright © 2017 Universitas Ahmad Dahlan. All rights reserved.
1. Introduction
This study focuses on establishing a quantitative relation between human emotion and Indonesian speech signal. Such relation is very important considering that human thinking process and behavior are strongly influenced by the emotion [1, 2]; thus, understanding human emotion is important for developing better and facilitating smooth personal relations. Failure in understanding human emotion may damage interpersonal relations and on extreme occasions, it may have catastrophic consequences. For example, in the case of the accident of Korean Air Flight 801 bound for Antonio B. Won Pat International Airport in Guam on August 6, 1997, the failure in communicating the runway position and the proximity of the aircraft to the ground between the aircraft pilot, the flight engineer, and the air traffic controller had resulted in fatalities of 228 passengers and crews [3].
We adopt Frieda's [1] definition of the human emotion, which is an intense feeling such as happy, angry, or afraid, directed toward a person or a thing. The feeling intensity is assumed to be rather significant such that its affects the person speeches, body gestures, or facial expressions [2].
Understanding the quantitative relation between the emotional state and a speech signal, in particular, is a prerequisite to establishing an automatic emotion detection system. The relation is clearly affected by the nature of the language and many studies have been previously conducted for languages: English [4], German [5], Mandarin [6], Assamese [7], Persian [8], and Danish [9].
have been evaluated so far. Kandali et al. [7] used Gaussian Mixture Model (GMM) for classifying emotion of Assam tribe in India where the speech features were obtained from Mel-Frequency Cepstral Coefficient (MFCC). They found that the surprise emotion state was difficult to be identified correctly. Instead of using speech signal, Chibelushi and Bourel [2] related the emotion to the facial expression. Muda et al. [10] utilized the method of Dynamic Time Warping (DTW) and MFCC and concluded that these methods were effective for the emotion classification. Magre and Deshmukh [11] evaluated the strengths and weaknesses of a few feature extraction methods of speech signals; their conclusions are reproduced in Table 1.
The objective of this work is to study to what extent Indonesian speech signal can be related to the emotion type, how much is the accuracy of the prediction, and what are the most relevant features for the emotion prediction. For this purpose, the speech signal will be analyzed using MFCC for their features and support vector machine will be used for classification. This article is composed of four sections. Section 2 Research Methods will briefly discuss the MFCC, the data acquisition method, and research procedure. Section 3 Results and Discussion will present the most important and relevant findings. Finally, Section 4 Conclusion will provide a brief summary of the discussed problem and findings.
Table 1. Advantages and disadvantages of Mel-Frequency Cepstral Coecient (MFCC), Linear Predictive Coecient (LPC), and Dynamic Time Warping (DTW) in modeling speech
signal [11]
Method Advantages Disadvantages
MFCC As the frequency bands are positioned logarithmically in MFCC, it approximates the human system response more closely than any other system.
MFCC values are not very robust in the presence of additive noise, and so it is common to normalize their values in speech recognition systems to lessen the in influence of noise. LPC Provides a good approximation within vocal
spectral envelope.
On certain condition, the noise may become dominant.
DWT Reduced storing space for the reference template. Increased recognition rate.
Difficult to find the best reference template for certain words.
2. Research Methods
The research procedure is as the following. We collected the speech data in Indonesia language. The speakers were two actors and two actresses. All of them were amateur and were active members of Theater Student Activity of Bina Nusantara University in Jakarta, Indonesia. They were asked to simulate four emotional states, namely, happy, sad, angry, and fear. The speech scripts were prepared by the researchers containing 15 sentences in Indonesia language, see Table 2. The speakers were asked to speech the sentences with the four emotional states. Several speech data were obtained per person, per sentence, and per emotional state. As the results, 291 speech signals in Indonesia language were collected. As much as 66% of the dataset were utilized for training, and the remainder was for testing.
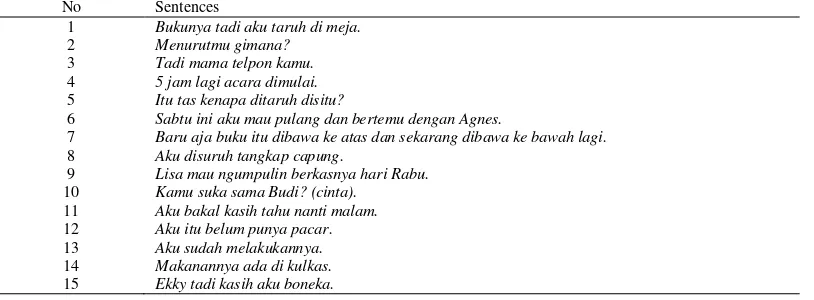
Table 2. The four speakers, two men and two women, were asked to speak the following sentences in four emotional states: happy, sad, angry, and fear
No Sentences
6 Sabtu ini aku mau pulang dan bertemu dengan Agnes.
7 Baru aja buku itu dibawa ke atas dan sekarang dibawa ke bawah lagi. 8 Aku disuruh tangkap capung.
9 Lisa mau ngumpulin berkasnya hari Rabu. 10 Kamu suka sama Budi? (cinta).
2.1. Mel-Frequency Cepstral Coefficient
The speech data were processed to provide Mel-Frequency Cepstral Coefficients (MFCC) and Teager Energy (TE). MFCC is based on human hearing perceptions, which are difficult to perceive frequencies over 1 kHz. MFCC is based on known variation of the human ears critical bandwidth frequency [10]. In summary, the MFCC procedures are: apply the Fourier transform to every segment of the speech signal, map the frequency into the Mel scale and apply triangular overlapping windows on the powers of the spectra, apply logarithmic transformation on the power spectra on each Mel frequency, and apply the discrete cosine transform. The results are 12 MFCC coefficients on each segment.
The computation of the MFCC in detail is of the following [12, 13]. The pre-processing proses is called pre-emphasis process where the speech signal is filtered with the equation,
(1)
where is an integer index, is the value of the speech signal at the discrete time-step , and is the filtered signal. Then, the filtered signal is divided into several small frames where the length of each frame is within the range of 20–40 ms. The voice signal is divided into frames of samples. The adjacent frames are separated by where . Typically, , and . The signal on each frame is scaled with a window function. The most widely window function is the Hamming window. The windowing process is mathematically written as:
, and (2)
( ) (3)
where is a segment of signal prior windowing process, is after windowing process, and . Then, Fourier transform is applied to each frame signal to transform the time-domain signal to the frequency-domain signal:
∫
(4)
where the signal in the time domain is denotes by and in the frequency domain by . The computation of Eq. (4) is performed numerically by the Fast Fourier Transform algorithm. The obtained Fourier spectra are expressed in form of the power spectra. The next step is transformation of the Fourier frequency to Mel-scale frequency by:
, (5)
and applying triangular overlapping windows. The resulted spectra are subjected to logarithmic transformation. Finally, the discrete cosine transform is applied to the log power spectra.
2.2. Teager Energy
The Teager energy of a speech signal is defined by [14]:
, (6)
where is the first derivative and is the second derivative of .
2.3. Support Vector Machine
are advised to the two sources for detail exposition. In addition, readers may also consult Refs. [17, 18].
We consider the point sets , as the support vectors, with the categories . The hyperplane that separates from those of should satisfy
, (7)
where , denotes the inner dot product of and , and is a scalar constant. The hyperplane is obtained by solving:
∑ (8)
where .
2.4. Accuracy Indicator
The classification accuracy is computed by:
(9)
where TP stands for True Positive, TN for True Negative, FP for False Positive, and FN for False Negative.
3. Results and Discussion
Firstly, we discuss how the accuracy of the emotion-state classification changes as the number of features is increased. We should note that in the MFCC analysis, we utilized 12 Mel filter banks from the lowest frequency to the highest frequencies. The coefficients in each bank are preserved in a cepstral vector. For each vector, we determine the minimum and maximum coefficients, and compute its average and standard deviation. Those statistical characteristics are used in the feature vector.
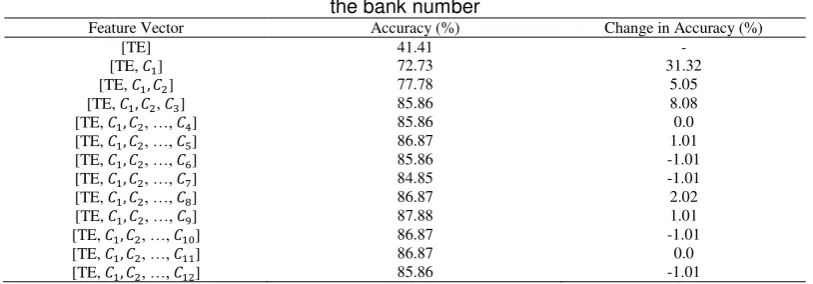
Table 3 shows the computed accuracies with the increasing of the number feature vectors. The first row shows the accuracy level when only the Teager energy is used as the feature. The second row shows for the case where the features involve the Teager energy and the statistical characteristics of the MFCC in the first bank. The characteristics on the second bank are added in the third row case. The analysis is repeated until all banks are taken into account.
Table 3. The changes in the level of accuracy as the function of the contents of the feature vector. The TE denotes the Teager energy, denotes the feature vector of the
i-bank of MFCC where the vector contents are
meanand is the bank number
Feature Vector Accuracy (%) Change in Accuracy (%)
[TE] 41.41 -
[TE, ] 72.73 31.32
[TE, ] 77.78 5.05
[TE, , ] 85.86 8.08
[TE, , …, ] 85.86 0.0
[TE, , …, ] 86.87 1.01
[TE, , …, ] 85.86 -1.01
[TE, , …, ] 84.85 -1.01
[TE, , …, ] 86.87 2.02
[TE, , …, ] 87.88 1.01
[TE, , …, ] 86.87 -1.01
[TE, , …, ] 86.87 0.0
The results suggest that the most important feature is the Teager energy and then followed by the statistical characteristics in the MFCC first bank. The Teager energy only is capable to achieve 41.4% of the level of accuracy. The features from the rest MFCC bank is able to increase the accuracy by 31%. The features from the third MFCC bank have a slightly better quality to increase the accuracy in comparison to those features in the second MFCC bank. The features from the fourth to the last banks can be ignored without sacrificing the accuracy.
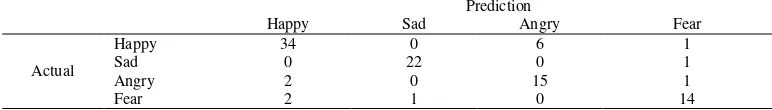
The confusion matrix for the case where the feature vector consisting [TE, C1, C2, …, C12] is shown in Table 4. The table shows that a few cases of happy-emotion state were detected as angry emotion. Meanwhile, the motion states of sad, angry, and fear were classified with high accuracy.
Table 4. The Computed Confussion Matrix for the case with 49 Speech Features Prediction using the speech signals in English, German, Mandarin, Persian, and Danish languages. This work has similar nature but different in the aspects of the language of interest and of the feature vector. The study focuses on Indonesia language and the Teager energy is taken into account as an important feature alongside the features of the statistical descriptive of MFCC. The performed numerical trials suggest that the Teager energy indeed is an important feature as it contributes to the classification accuracy by about 41%. In addition, some statistical descriptive of MFCC associated with low frequencies power spectra are also crucial for accurate classification. The final finding is that the happy-emotion state seems slightly difficult to be differentiated from the angry-emotion state and the emotion states of angry, sad, and fear are detectable from the speech signal at a rather high accuracy.
References
[1] KKN Frieda, Moods, Emotion Episodes, and Emotions, Guilford Press, New York. 1993.
[2] C Chibelushi, F Bourel. Facial expression recognition: A brief tutorial overview, retrieved on January 2015 (January 2003). URL http://homepages.inf.ed.ac.uk/rbf/CVonline/LOCAL_ COPIES/CHIBELUSHI1/CCC_FB_FacExprRecCVonline.pdf
[3] POM Gladwell. The Ethnic Theory of Plane Crashes\Captain the Weather Radar Has Helped Us a Lot. In Success, Outliers: The Story of Success, Little, Brown and Company, New York, United States of America. 2008.
[4] TM Galla, A Sapra, N Panwar, S Panwar. Emotion Recognition from Speech. International Journal of Emerging Technology and advanced engineering. 2013; 3(2): 341-345.
[5] BV Sathe-Pathak, AR Panat. Extraction of Pitch and Formants and its Analysis to Identify Three Different Emotional States of a Person. International Journal of Computer Science. 2012; 9(4): 296-299.
[6] TL Pao, Y Chen, JH Yeh, J Lu, Detecting Emotions in Mandarin Speech. ROCLING. 2004: 365-373. [7] AB Kandali, A Routray, TK Basu. Emotion Recognition from Assamese Speeches using MFCC
Features and GMM classifier. TENCON 2008-2008 IEEE Region 10 Conference, IEEE. 2008: 1-5. [8] M Hamidi, M Mansoorizade. Emotion Recognition from Persian Speech with Neural Network,
International Journal of Artificial Intelligence & Applications. 2012; 3(5): 107.
[9] YL Lin, G Wei. Speech Emotion Recognition based on HMM and SVM, in: Machine Learning and Cybernetics. Proceedings of 2005 International Conference on. IEEE. 2005; 8: 4898-4901.
[11] SB Magre, RR Deshmukh. A Review on Feature Extraction and Noise Reduction Technique.
International Journal of Advanced Research in Computer Science and Software Engineering. 2014; 4(2): 352-356.
[12] SK Kopparapu, M Laxminarayana. Choice of Mel Filter Bank in Computing MFCC of a Resampled Speech. Information Sciences Signal Processing and their Applications (ISSPA), 2010 10th International Conference on, IEEE. 2010: 121-124.
[13] J Kaur, A Sharma. Emotion Detection Independent of User Using MFCC Feature Extraction.
International Journal of Advanced Research in Computer Science and Software Engineering. 2014; 4(6): 230-234.
[14] E Kvedalen. Signal Processing Using the Teager Energy Operator and other Nonlinear Operators, Master Thesis, Department of Informatics, University of Oslo. 2003.
[15] N Christianni, J Shawe-Taylor. An Introduction to Support Vector Machines and Other Kernel-Based Learning Methods, Cambridge University Press, Cambridge, UK. 2000.
[16] T Hastie, R Tibshirani, J Friedman. The Elements of Statistical Learning, Springer, New York. 2008. [17] AB Mutiara, R Refianti, NRA Mukarromah. Musical Genre Classification Using SVM and Audio
Features. TELKOMNIKA Telecommunication, Computing, Electronics and Control. 2016;14(3). [18] M Mulyati, WA Kusuma, M Nurilmala. Identification of Tuna and Mackerel based on DNA Barcodes