DOI: 10.12928/TELKOMNIKA.v14i1.2634 47
Demosaicing of Color Images by Accurate Estimation
of Luminance
V.N.V. Satya Prakash*1, K. Satya Prasad2, T. Jaya Chandra Prasad3 1,3
Dept. of ECE, Rajeev Gandhi Memorial college of Engineering and Technology (RGMCET), Nandyal, A.P., India
2
Dept. of ECE, Jawaharlal Nehru Technological University, Kakinada (JNTUK), Kakinada, A.P. India
*Corresponding author, email: [email protected], [email protected], [email protected]
Abstract
Digital cameras acquire color images using a single sensor with Color filter Arrays. A single color component per pixel is acquired using color filter arrays and the remaining two components are obtained using demosaicing techniques. The conventional demosaicing techniques existent induce artifacts in resultant images effecting reconstruction quality. To overcome this drawback a frequency based demosaicing technique is proposed. The luminance and chrominance components extracted from the frequency domain of the image are interpolated to produce intermediate demosaiced images. A novel Neural Network Based Image Reconstruction Algorithm is applied to the intermediate demosaiced image to obtain resultant demosaiced images. The results presented in the paper prove the proposed demosaicing technique exhibits the best performance and is applicable to a wide variety of images.
Keywords: Demosaicing, frequency, color filter array, luminance, chrominance
Copyright © 2016 Universitas Ahmad Dahlan. All rights reserved.
1. Introduction
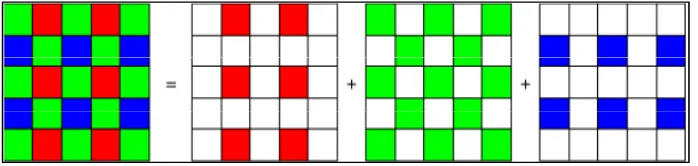
A color image is usually composed of three color planes and, accordingly, three separate sensors are required for a camera to measure an image. To reduce the cost, many cameras use a single sensor covered with a color filter array (CFA). The most common CFA used is the Bayer CFA [1, 2], which is shown in Figure 1. In the CFA-based sensor configuration, only one color is measured at each pixel and the missing two color values are estimated by interpolation. The estimation process is known as color demosaicing.
Figure 1. Bayer CFA Pattern along with its red, green and blue samples
over independent channel reconstruction. But still there is a possibility for improvement. Template matching, filtering and luminance based approaches are basis for various techniques, but they are limited in the capability of reconstruction with different spatial and chromatic characteristics and results in some artifacts in the reconstructed images.
Demosaicing techniques can be broadly classified as frequency domain [4-7] based and spatial domain based [8-10]. A detailed survey of the varied demosaicing techniques is presented in [3] and [11]. Based on the literature reviewed it is evident that the existing state of art demosaicing algorithms induce artifacts in the reconstructed image [3, 9], [11-12]. A detailed report on the types of artifacts observed in demosaiced images is presented in [13]. To minimize occurrences of artifacts in demosaiced images, the use knowledge derived from of local region or local patches [14-17] to interpolate/estimate the missing color components is proposed. An iterative demosaicing technique is essential to derive local knowledge and achieve accurate estimation [18, 19]. In recent times the adoption of neural networks in image processing [20, 21] to derive knowledge is a motivating factor for the authors of this paper. A neural network based demosaicing technique proposed in [22] bears the closest similarity to the work proposed here. In [22] the rotational invariance is used to train the neural networks and estimate the missing color pixel.
In this paper a frequency domain based demosaicing technique is proposed. Based on the frequency components, luminance and chrominance information is used to represent the image. The input image’s luminance and chrominance components are segregated. Using bilinear interpolation the luminance and three chrominance channels are combined to produce an intermediate image that exhibits errors or artifacts. To eliminate the errors in the intermediate image, a neural network based reconstruction is proposed. Reconstruction algorithm is referred to as Neural Network Based Image Reconstruction Algorithm (NNIRA) in the proposed system. The neural networks derive local knowledge from the image patches constructed. The knowledge assists in estimating the missing components.
The remaining paper is organized as follows. The proposed system is presented in section two. The experimental study and performance comparison of our proposed with other state of art demosaicing algorithms is presents in section three. The conclusions and future work is discussed in the last section of the paper.
2. Frequency Domain NNIRA Approach (Proposed System)
NNIRA based techniques have been employed to reconstruct the image but to the best of our knowledge no author has attempted to consider Luminance component (extracted in the Frequency domain) to reconstruct the original image (using neural networks).
The steps of the proposed image demosaicing technique considering luminance information in the frequency domain are as follows:
1) Image Alignment: Align the set of images pairwise using the low frequency (luminance) information of the CFA Fourier transform images.
2) Luminance/Chrominance Separation: Extract the luminance and chrominance information from each of the input images. Bilinear interpolation is adopted to combine the luminance and the three chrominance channels resulting in an intermediate image that is not artefact free.
3) Image Reconstruction: Neural Network Based Image Reconstruction Algorithm (NNIRA) is used for image reconstruction and removal of artifacts observed in the intermediate image. During training phase, the model is furnished with both the intermediate image patches P for
i , , , … . . N and the original patches Q .After training, NNIRA will be able to reconstruct
the corresponding demosaiced image for any given error observation.
3. Research Method
∑ x, y T x, y
with
T x, y cos Πx cos Πy ⁄ red
T x, y cos Пx cos Πy / green
T x, y cos Πx cos Πy ⁄ blue
(1)
The image x, y is the ith color channel image, and T x, y is a modulation matrix, which is ‘1’ at the measured positions of the image, and ‘0’ elsewhere. As these modulation functions are a combination of cosines, their Fourier transform is a combination of Diracs. Using the fact that a product in spatial domain corresponds to a convolution in frequency domain, we obtain:
u, v u, v ∗ δ u, v δ u , v
δ u , v δ u, v ∗ δ u , v (2)
δ u , v δ u , v δ u , v
Where Fourier transforms are indicated in bold. Any color image u, v can be represented as a sum of a scalar representing its luminance α u, v and a length three vector u, v that is called chrominance and represents opponent colors as below in Equation (3)
u, v u, v u, v
u, v
α u, v u, v u, v
u, v
(3)
Luminance is defined as α / , we obtain:
u, v u, v u, v
u, v
u, v u, v u, v / u, v u, v u, v u, v u, v
u, v u, v
(4)
Using this definition, we can see that the first term in Equation (2) corresponds to the luminance signal α u, v and the two other terms represent the chrominance u, v .Because of the modulation functions, the luminance part appears in low frequency region of the spectrum, and a the chrominance part appears in high frequency region.
Using a low pass filter, the luminance information from the images is extracted In this paper, a frequency domain approach is used, which uses only the low frequencies for image alignment, which are less prone to aliasing. As this is also the part of the CFA Fourier transform that contains the luminance information, we apply our algorithm directly on the raw CFA images. Next, we separate the images into luminance and chrominance using a low pass filter, and interpolate the two separately.
The frequency domain approach presented by Vandewalle et al [24] is used to align Bayer CFA images and this algorithm selects only the low frequency information since this part of the spectrum is less corrupted by aliasing and to get luminance information a part of Spectrum encoding is done as shown in Equation (2), therefore we can directly apply alignment algorithm to the raw CFA images. First we perform planar rotation estimation, followed by planar shift estimation. The rotation angle is estimated by computing the frequency content δ of the image as a function of the angle for each of the input images.
Where ρ,θ is the Fourier transform of the CFA image , converted in polar coordinates, the rotation angle between two images can then be found at the maximum of the correlation between two such functions. Next, the rotation is canceled, and the shifts are estimated by computing the least squares fit of a plane through the (linear) phase difference between the images. As we only use the low frequency information of the images, we do not need to separate luminance and chrominance for this phase. The use of the raw sensor data for the image alignment allows a higher precision of the alignments, as no additional filtering or interpolation errors are introduced.
3.1. Luminance / Chrominance Separation
Here we separate the luminance and chrominance information in each of the images in order to interpolate them separately. As indicated in Equation (2), we extract the luminance signal from the CFA images using a low-pass filter specified by Alleysson et al [23]. The three chrominance parts (for red, green and blue) are then obtained by subtracting this luminance information from the red, green and blue channels of the CFA image and demodulating the result. This results in a luminance image α and three chrominance images , and all at the original image size.
α ∗
α ʘ T ∗
α ʘ T ∗
α ʘ T ∗
with / , / (6)
The matrices and are two demodulation (or interpolation) filters, and the symbol ʘ is used for a point wise multiplication of two matrices.From separated and demodulated luminance and chrominance signals we compute their high resolution versions using Normalized Convolution (NC) approach proposed in [27]on each of the four channel separately. A Gaussian weighting function (applicability function) is used to have the highest contributions from samples close to the considered pixel and used a variance σ .
A pixel of the high resolution image is computed from the pixels in a neighbourhood around it as:
P′ (7)
Where is an vector containing the neighborhood pixels, is an matrix of basis functions sampled at the local coordinates of the pixels ,and is an weighting matrix containing the Gaussian weights sampled at the pixel coordinates. The first element of the vector P′ gives the interpolated pixel value. For neighbourhood selection, a circular region with radius four times the pixel distance of the high resolution image is used. Due to the nonuniform grid, the number of pixels in this region may vary depending on the position.
We perform bilinear interpolation for the luminance channel , as well as for each of the chrominance channels , and then we add luminance and chrominance together, which results in an intermediate high resolution colour image P . If we consider pixels of the high resolution image to be computed then P can be given as:
P ′ (8)
Here P induces error / artifacts, as the final high resolution image are computed by fitting a polynomial surface to compute high resolution image and also scale of the applicability function plays a decisive role in the quality of interpolation such as using Low-order NC with a large applicability window cannot reconstruct small details in the image.
3.2. Image Reconstruction
P ῼ Q (9)
Where ῼ R → R is an arbitrary stochastic error process induced due to the polynomial surface fitting. Then, demosaicing learning objective becomes:
g argming A ||g P Q|| (10)
In Equation (10) we see that the task is to find a function ′g′ that best approximates ῼ . We can now treat the image demosaicing problem in a unified framework by choosing appropriate ῼ in different situations.
3.3. Image Reconstruction Demosaic Auto-encoder [IRDA]
Let Q be the original data for i , , , … . . N and P be the corrupted version of corresponding Q.
h P φ W b (11)
Q P φ W′h P b′ (12)
Where φ P exp P is the sigmoid activation function which is applied component-wise to vectors, h is the hidden layer activation, Q P is an approximation of Q and ω
W, b, W′, b′ represents the weights and biases. IRDA can be trained with various optimization
methods to minimize the reconstruction loss.
ω argminω ∑ ‖ Q Q P ‖ (13)
After training IRDA, we move on to training the next layer by using the hidden layer activation of the first layer as the input of the next layer.
3.4. Neural Network Based Image Reconstruction Algorithm
In this section, we will describe the structure and optimization objective of the proposed model Neural Network Based Image Reconstruction Algorithm (NNIRA). Due to the fact that directly processing the entire image is intractable, we instead draw overlapping patches from the image as our data objects.
In the training phase, the model is supplied with both the corrupted error image patches P , for i , , , … . . N and the original patches Q. After training, IRDA will be able to reconstruct the corresponding clean image given any error observation.
To combine sparse coding and neural networks and avoid over-fitting, we train IRDA to minimize the reconstruction loss regularized by a sparsity-inducing term.
M P, Q,ω ∑ ‖Q Q P ‖ δKM Γ‖Γ λ ‖W‖ W′ (14)
KM Γ Γ ∑|Γ| ΓlogΓΓ Γ log ΓΓ , Γ ∑ h P (15)
Where h . and Q . are defined in Equation (11) and Equation (12) respectively. Here Γ is the average activation of the hidden layer. We regularize the hidden layer representation to be sparse by choosing small Γ so that the KM divergence term will encourage the mean activation of hidden units to be small. Hence the hidden units will be zero most of the time and achieve sparsity.
We then initialize a deep network with the weights obtained from K layered IRDAs. The network has one input layer, one output and K hidden layers. The entire network is then trained using the standard back-propagation algorithm to minimize the following objective:
M P, Q,ω ∑ ‖Q Q P ‖ λ ∑ ‖W ‖ (16)
Here we removed the sparsity regularization because the pre-trained weights will serve as regularization to the network [25], according to [26], during pre-training and fine tuning stages the loss functions are optimized with L-BFGS algorithm to achieve fastest convergence in our settings.
3.5. Hidden Layer Feature Analysis
During the training of image reconstruction demosaicing auto-encoders [IRDA], the error training data is typically generated with indiscriminately selected simple error distribution regardless of the characteristics of the particular training data. However, it is proposed that this process deserves a lot of attention in real world problems; the clean training data is in fact usually subject to error. Hence, if we tend to estimate the distribution of error and more using it to generate error training data, the ensuing IRDA will learn to be more robust to errors in the input data and produce better features. It can be suggested that training image reconstruction auto-encoders [IRDA] with totally different color intensity images that fit to specific situations can also improve the performance.
The resulting image obtained post neural network reconstruction is considered as the demosaiced image. In the next section the experimental study to evaluate the performance of the proposed demosaicing technique is presented.
4. Experimental Study and Performance Comparisons:
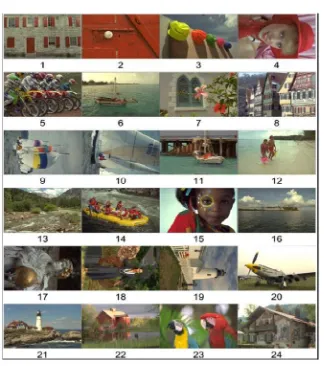
To validate our proposed system the most commonly used Kodak dataset [28] is considered in the experimental study and performance comparisons. The Kodak dataset consists of 24 images each having a high resolution of 768x512 and 24 bit color depth. The Kodak dataset considered in the experimental study and performance comparisons is shown in Figure 2. The proposed demosaicing technique is developed using MATLAB. To evaluate the performance of demosaiced images obtained in the proposed system, color-peak signal-to-noise ratio (CPSNR) defined in [23] is used. The CPSNR is computed using.
log (17)
Where CMSE represents the Color Mean Square Error and is defined as:
∑ ∑ ∑ , , , , (18)
Where and are the intensity levels of original image and demosaiced images of height and width . ‘ ’ value varies from 1 to 3 for the three color planes.
Figure 2. Kodak Image dataset of 24 images considered for testing
Table 1. Average PSNR (of red, green and blue channels) and CPSNR results in dB obtained using our proposed demosaicing technique
Image No. Red channel Green channel Blue channel CPSNR
1(“Stone building”) 43.41 45.4 43.45 43.93
2(“Red door”) 44.69 47.94 45.92 45.84
3(‘Hats”) 46.59 48.74 46.86 47.22
4(“Girl in red”) 45.78 48.09 46.2 46.5
5(“motor cross bikes”) 44.15 46.12 44.48 44.77
6(“sail boat”) 44.03 46.27 44.12 44.61
7(“Widow”) 46.74 48.91 47.12 47.42
8(“Market Place”) 42.54 44.99 42.65 43.16
9(“Sail boat”) 46.43 48.45 46.39 46.92
10(“sail boat race”) 46.48 48.53 46.4 46.96
11(“sail boat at pier”) 44.48 46.83 44.9 45.21
12(“couple on beach”) 46.24 48.54 46.32 46.82
13(“Mountain stream”) 42.58 44.21 42.5 42.98
14(“Water raflets”) 43.38 46.1 44.41 44.38
15(“Girl with Painted face”) 44.9 47.69 45.61 45.81
16(“Island”) 45.12 47.41 45.24 45.72
17(“Roman statue”) 46.3 47.94 46.01 46.61
18(“Model girl”) 44.34 46 44.08 44.67
19(“Light house in maine”) 44.54 46.74 44.7 45.14
20(“Propeller plane”) 45.61 47.78 45.85 46.24
21(“Head Light”) 44.52 46.47 44.51 45.01
22(“Barn and Pond”) 44.78 46.71 44.81 45.28
23(“Two macaws”) 46.66 49.33 47.61 47.63
24(“Mountain chalet”) 44.01 45.71 43.33 44.16
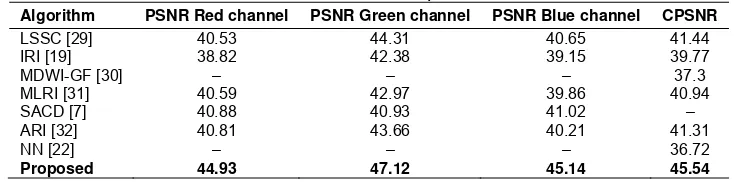
To compare the performance of the proposed demosaicing technique with the other state of art demosaicing techniques the average PSNR of the red, green, blue channels and the CPSNR results obtained is considered. The performance of the proposed demosaicing technique is compared with learned simultaneous sparse coding (LSSC) [29], Iterative Residual Interpolation (IRI) [19], multi-directional weighted interpolation and guided filter (MDWI-GF) [30], MLRI [31], similarity and color difference (SACD) based demosaicing [7], adaptive residual interpolation (ARI) [32] and multilayer neural network (NN) based demosaicing technique [22]. The NN technique proposed in [22] bears the closest similarity to the work proposed here. The average PSNR of the red, green, blue channel and CPSNR is considered for comparison. The results obtained are shown in Table 2 of the paper. Compared with multilayer neural network (NN) based demosaicing technique [22], the proposed demosaicing technique exhibits an improvement of 8.82 dB in average. An improvement of 4.1 dB and 4.23dB is reported based on our proposed technique against the LSSC [29] and ARI [32]. Based on the results it is evident that our proposed demosaicing technique outperforms the existing state of art demosaicing techniques.
Table 2. Performance comparison result
Algorithm PSNR Red channel PSNR Green channel PSNR Blue channel CPSNR
LSSC [29] 40.53 44.31 40.65 41.44
In this paper a frequency domain based demosaicing technique is proposed. The luminance and chrominance information obtained from the frequency domain is extracted. A bilinear interpolation technique implemented on the luminance and chrominance information is used to partially derive the missing components and produce an intermediate image. The intermediate image is split into patches. The novelty of the proposed demosaicing technique is the adoption of neural network to learn from the local patches and estimate the missing components. A novel Neural Network Based Image Reconstruction Algorithm is presented in the proposed demosaicing technique. The experimental results and performance comparison results presented prove the robustness and demosaicing efficiency over existent state of art demosaicing techniques.Evaluation of the proposed demosaicing technique on additional image datasets is considered as the future of the work presented here.
References
[1] BE Bayer. Color imaging array. US Patent 3,971,065. 1976.
[2] Ousman Boukara, Laurent Bitjokaa, Gamraïkréo Djaowéa. Nondestructive Determination of Beans Water Absorption Capacity Using CFA Images Analysis For Hard-To-Cook Evaluation. International Journal of Electrical and Computer Engineering (IJECE). 2013; 3(3): 317-328.
[3] X Li, B Gunturk, L Zhang. Image demosaicing: A systematic survey. SPIE. 2008; 6822: 68221.
[4] Dubois E. Frequency-domain methods for demosaicking of Bayer-sampled color images. In Signal Processing Letters, IEEE. 2005; 12(12): 847-850.
[5] Nai-Xiang Lian, Lanlan Chang, Yap-Peng Tan, Zagorodnov V. Adaptive Filtering for Color Filter Array Demosaicking. In Image Processing, IEEE Transactions on. 2007; 16(10): 2515-2525.
[6] Lu Fang, Au OC, Yan Chen, Katsaggelos AK, Hanli Wang, Xing Wen. Joint Demosaicing and Subpixel-Based Down-Sampling for Bayer Images: A Fast Frequency-Domain Analysis Approach. In Multimedia, IEEE Transactions on. 2012; 14(4): 1359-1369.
[7] R Niruban, T Sree Renga Raja, R Deepa. Similarity and Variance of Color Difference Based Demosaicing. TELKOMNIKA Indonesian Journal of Electrical Engineering. 2015; 13(2): 238-246. [8] Dengwen Z, Xiaoliu S, Weiming D. Colour demosaicking with directional filtering and weighting. In
[9] Xiao Zhou, Fanfan Yang, Chunxiao Zhang, Chengyou Wang. Improved adaptive demosaicking using directional weighting. In Computer Science & Education (ICCSE), 9th International Conference on. 2014: 615-618.
[10] Zhang D, Xiaolin Wu. Color demosaicking via directional linear minimum mean square-error estimation. In Image Processing, IEEE Transactions on. 2005; 14(12): 2167-2178.
[11] D Menon, G Calvagno. Color image demosaicking: An overview. Signal Processing: Image Communication (Elsevier). 2011; 26.
[12] Kim Y, Jeong J. Four Direction Residual Interpolation for Demosaicking. In Circuits and Systems for Video Technology, IEEE Transactions on. 99: 1.
[13] Maschal RA, Young SS, Reynolds JP, Krapels K, Fanning J, Corbin T. New Image Quality Assessment Algorithms for CFA Demosaicing. In Sensors Journal, IEEE. 2013; 13(1): 371-378. [14] Xiangdong Chen, Liwen He, Gwanggil Jeon, Jechang Jeong. Multidirectional Weighted Interpolation
and Refinement Method for Bayer Pattern CFA Demosaicking. In Circuits and Systems for Video Technology, IEEE Transactions on. 2015; 25(8): 1271-1282.
[15] Wachira Kinyua, Mwangi Elijah, Jeon Gwanggil. A pentomino-based path inspired demosaicking technique for the bayer color filter array. In AFRICON. 2015: 1-5.
[16] Michael G, Kiryati N. Example based demosaicing. In Image Processing (ICIP), 2014 IEEE International Conference on. 2014: 1832-1836.
[17] Moriya S, Makita J, Kuno T, Matoba N, Sugiura H. Advanced demosaicing methods based on the changes of colors in a local region. In Consumer Electronics, IEEE Transactions on. 2006; 52(1): 206-214.
[18] Lu YM, Karzand M, Vetterli M. Demosaicking by Alternating Projections: Theory and Fast One-Step Implementation. In Image Processing, IEEE Transactions on. 2010; 19(8): 2085-2098.
[19] Wei Ye, Kai-Kuang Ma. Color Image Demosaicing Using Iterative Residual Interpolation. In Image Processing, IEEE Transactions on. 2015; 24(12): 5879-5891.
[20] Burger HC, Schuler CJ, Harmeling S. Image denoising: Can plain neural networks compete with BM3D?. In Computer Vision and Pattern Recognition (CVPR), 2012 IEEE Conference on. 2012: 2392-2399.
[21] Budi Rahmani, Supriyadi. Early Model of Traffic Sign Reminder Based on Neural Network. TELKOMNIKA. 2012; 10(4): 749-758.
[22] Yi-Qing Wang. A multilayer neural network for image demosaicking. In Image Processing (ICIP), 2014 IEEE International Conference on. 2014: 1852-1856.
[23] Alleysson D, Susstrunk S, Herault J. Linear demosaicing inspired by the human visual system. In Image Processing, IEEE Transactions on. 2005; 14(4): 439-449.
[24] P Vandewalle, S S¨usstrunk, M Vetterli. A Frequency Domain Approach to Registration of Aliased Images with Application to Super-Resolution. EURASIP Journal on Applied Signal Processing, Special Issue on Super-Resolution Imaging. 2006.
[25] D Robinson, P Milanfar. Statistical performance analysis of super-resolution. IEEE Transactions on Image Processing. 2006; 15: 1413-1428.
[26] QV Le, A Coates, B Prochnow, AY Ng. On optimization methods for deep learning. Learning. 2011: 265-272.
[27] TQ Pham, LJ van Vliet, K Schutte. Robust Fusion of Irregularly Sampled Data Using Adaptive Normalized Convolution. EURASIP Journal on Applied Signal Processing. 2006.
[28] The Kodak color image dataset, Image Available [Online]. Available: http://r0k.us/graphics/kodak/. [29] J Mairal, F Bach, J Ponce, G Sapiro, A Zisserman. Non-local sparse models for image restoration. In
Proc. IEEE 12th Int. Conf. Comput. Vis. 2009: 2272–2279.
[30] Xiangdong Chen, Liwen He, Gwanggil Jeon, Jechang Jeong. Multidirectional Weighted Interpolation and Refinement Method for Bayer Pattern CFA Demosaicking. In Circuits and Systems for Video Technology, IEEE Transactions on. 2015; 25(8): 1271-1282.
[31] D Kiku, Y Monno, M Tanaka, M Okutomi. Minimized-laplacian residual interpolation for color image demosaicking. In Proc. IST/SPIE Electronic Imaging. 2014; 9023: 1-8.