Theoretical Analysis of Complex Oscillations in Multibranched
Microvascular Networks
M. URSINO,* S. CAVALCANTI,* S. BERTUGLIA,†ANDA. COLANTUONI†
*Department of Electronics, Computer Science and Systems, University of Bologna, 40136 Bologna,
Italy; and †CNR Institute of Clinical Physiology, University of Pisa, 56100 Pisa, Italy
Received April 25, 1995
A mathematical model was used to study the origin of complex self-sustained diameter oscilla-tions in multibranched microvascular networks. The model includes three branching levels (order 3, 2, and 1 arterioles) of a microvascular network derived from in vivo observation in the hamster dorsal cutaneous muscle. The main biomechanical aspects covered by the model are (1) the dependence of the elastic and active wall stress on the inner radius and (2) the static and dynamic myogenic response. Simulations on isolated arterioles indicate that self-sustained periodic diame-ter oscillations may occur at constant transmural pressure. Conversely, simulations on the entire network reveal different oscillatory patterns, including periodic, quasiperiodic, and chaotic fluc-tuations. Chaos in the model is revealed by the presence of a broad noise-like component in the frequency spectrum and by the sensitivity dependence of model results on small perturbations. Our results suggest that, owing to the intrinsic nonlinearity of the system, a contracting mecha-nism, such as the myogenic response, may induce different oscillatory patterns. The change from periodic to chaotic oscillations may be a consequence of a modest variation in a parameter (systemic pressure or arterial resistance) not necessarily related to pathophysiological conditions. Accordingly, our in vivo observations in the skeletal muscle showed that in some instances arteriolar vasomotion is converted from regular to highly irregular patterns in basal conditions. Vasomotion is found to affect mean blood flow compared with the nonoscillatory steady state. Chaotic oscillations tend to maintain a constant ratio of blood flows entering into bifurcation vessels, whereas periodic vasomotion determines a different flow distribution at branches. q1996 Academic Press, Inc.
INTRODUCTION
The time pattern of arteriolar diameter changes may exhibit disparate characteristics in in vivo microvascular preparations. Intaglietta and Breit (1991) recognized arterioles with periodic self-sustained oscillations and with random diameter fluctuations without any evident periodicity. The last pattern has been frequently reported in different experimental models (Colantuoni et al., 1984, 1990; Meyer and Intaglietta, 1986; Bertuglia et al., 1991).
The presence of periodic or aperiodic diameter fluctuations of arterioles (vasomo-tion) is conditioned by the interaction of many biomechanical and regulatory variables which operate simultaneously on microvessels: the characteristics of the smooth mus-cle cells, the activity of local control mechanisms (myogenic, metabolic, neurogenic, and endothelium-dependent), and the branching pattern of the microvascular network. Owing to the nonlinear nature of arteriolar hemodynamics, arteriolar oscillations may modify blood flow distribution to tissues and microvascular fluid exchange. Significant
229
0026-2862/96 $18.00
functional effects might occur when arterioles oscillate compared with those evaluated under nonoscillatory conditions.
Factors which contribute to microvascular hemodynamics and their interactions can be advantageously analyzed by mathematical models. The recent finding that deterministic models can produce irregular, unpredictable fluctuations, called chaos, can provide a deeper insight into the behavior of physiological systems. The hypothesis that the microcirculation may present a chaotic behavior has been stressed recently, based on the evaluation of phase – space trajectories from laser Doppler measurements (Intaglietta and Breit, 1991) or on the calculation of the fractal dimension of perfusion pressure oscillations (Griffith and Edwards, 1993).
In the model of Ursino et al. (Ursino and Fabbri, 1992; Ursino et al., 1992) microvas-cular instability and periodic oscillations in arteriolar diameter arise from the myogenic mechanism, especially from its rate-dependent component at the level of terminal arterioles. The model by Gonzales-Fernandez and Ermentrout (1994) incorporates ionic transport and cell membrane potential and shows that interaction of Ca2/and
K/
fluxes mediated by gated channels results in periodicity of these transports and periodic changes in vessel diameter. Ackari et al. (1994) theoretically investigated the conditions leading to low-frequency oscillations in muscular arteries. In a mathematical model of microvascular network Kiani et al. (1994) analyzed fluctuations in blood flow parameters caused by hemorrheological properties and by other mechanisms (such as the myogenic response). None of these models, however, analyzed a regulated multibranched microvascular network exhibiting transition to more complex patterns like those observed in vivo.
The aim of our paper is to develop a mathematical model of a microvascular branching system including first- to third-order arterioles. The model is based on the myogenic mechanism, for which a mathematical model was studied earlier (Ursino and Fabbri, 1992; Ursino et al., 1992) and includes the interaction of arterioles of various branching orders. Geometrical and mechanical model parameters are obtained from in vivo measurements in the hamster dorsal cutaneous muscle microcirculation. The occurrence of periodic, quasiperiodic, and chaotic oscillatory patterns of vessel diameter is then predicted with this mathematical model. Moreover, the model is used to investigate whether oscillations may change distribution of mean blood flow at bifurcation in the microvascular network.
MATERIALS AND METHODS
Experimental Method
Experimental measurements were made in cutaneous muscle microcirculation in hamsters implanted with a plastic chamber, as previously described (Colantuoni et al., 1984). Experiments were made in 10 male Syrian hamsters (Charles River, Calco Co., Italy), weighing 80 – 100 g, housed individually with free access to water and food pellets. One of the microvascular networks was chosen for the present paper since it presented average parameters common to different animals.
layer of skin muscle (M. cutaneus maximus) attached to the subcutaneous tissue. The tissue was covered by a microcover glass which was fixed to one of the plastic frames, while the other part stayed open so that the skin was in its natural environment. Permanent catheters filled with heparinized saline were implanted in the jugular vein and the carotid artery. They were passed under the skin to the upper posterior part of the neck and fixed to the upper part of the window. The animals were allowed to recover for 48 hr in an incubator at 30{0.57with free access to food and water.
Unanesthetized animals were placed in a transparent tube that minimized move-ments without impeding respiration. Both the tube and the extending frame of the chamber were fixed to the microscope stage. The microcirculation was studied with fluorescent microscopy (Bertuglia et al., 1991), where fluorescein isothiocyanate bound to dextran (MW 150,000) was injected intravenously (50 mg/100 g body wt in 5% solution) and observed under a Leitz Orthoplan microscope fitted with a long-working-distance objective (14, na 0.12; 120, na 0.25; 132, na 0.60) and 110 eyepiece. It was then televised by a COHU 5253 SIT low-light-level camera, viewed on a Sony PVM 122 CE monitor and recorded with a Sony U-Matic VO 5800 PS videorecorder. Fluorescence excitation was obtained by filtering the emission of a xenon 150-W lamp using a Leitz I2Ploemopack filter block.
Mean arterial blood pressure (Statham PD 23 transducer connected to catheter in carotid artery) and heart rate were monitored by a Honeywell RM 300 monitor inter-faced to an IBM XT 286 personal computer. The temperature of the chamber was controlled at 30{0.57 by a jet of warmed air.
The vessels in each preparation were ordered by the Strahler method (Bertuglia et al., 1991); the scheme was applied to the terminal arteriolar networks originating from the arterioles feeding the muscle. First, the capillaries were defined and assigned order 0. Thereafter, the terminal arterioles were assigned order 1 and vessels upstream were assigned progressively higher orders.
Vessel diameters were measured with a computerized technique. The sequences of interest were digitized in real time, using a custom-designed image-processing system based on extension boards (Matrox PIP-640 B) installed in a HP Vectra RS/25C computer. The vessel under study was aligned vertically and measured by positioning a window across its lumen. An edge-direction algorithm detected the inside wall of the blood vessel and computed the average diameter within the window. To individuate the most significant frequency components of the diameter fluctuations, periods of vasomotion lasting up to 1 hr were considered. Since during these periods vasomotion pattern was clearly unstationary showing different aspects in the time course, several short epochs 1-min long were extracted and, for each one, power spectral density was calculated by using an autoregressive technique. As an advantage, autoregressive approach, compared with the fft-based technique, permits an efficient filtering of noise effects and a more accurate frequency resolution in the case of short-time series. Qualitative Model Description
The characteristics of the model reproduce the network architecture, the elastic and muscular properties of isolated microvessels located along the microvasculature, and the static and dynamic myogenic response. A quantitative description of equations and parameter numerical values are given in the Appendix.
Network Layout
FIG. 1. (a) Schematic representation of the hamster dorsal cutaneous muscle microcirculation. The portion indicated has been reproduced in the mathematical model. The diagram is not in scale. OR 1, OR 2, OR 3: order 1, order 2, order 3 arterioles. (b) Electric analog of the network reported in a. R0, vascular resistance of the upstream circulation down to and including order 4 arterioles; R1, vascular resistance of a order 3 arteriole; R2and R3, vascular resistances of order 2 arterioles; R4and R5, load resistances including order 1 arterioles. Pa, systemic arterial pressure; Pv, venular pressure.
viscous pressure losses. This simplification is commonly adopted in microvascular hemodynamic studies. Second, we assume that venular pressure changes are negligible throughout the simulations, in accordance with experimental findings (Borgstrom and Gestrelius, 1987) and justified by the large venous compliance when compared to that of the arteriolar network.
The model partly reproduces a hamster microvascular network including order 3 to order 1 arterioles. Simulation data were chosen from the hamster whose values were closer to the average values of the examined population (Fig. 1a). There were no significant differences in simulation results using different hamster data. The vascular resistance of the upstream systemic circulation, including order 4 arterioles, is R0 in
the electric analog (Fig. 1b). R1 is the vascular resistance of a order 3 arteriole with
an acute branching angle from the order 4 vessel. R2and R3are the resistances of two
order 2 arterioles branching from the previous microvessel. Finally, R4and R5
corre-spond to the resistance of the microvasculature downstream the two order 2 arterioles, from order 1 arterioles to the venular pressure Pv. It was assumed that R4 and R5
The resistance R0 is scarcely affected by the hemodynamic alterations within the
two downstream arteriolar branches, hence, its value was maintained constant through-out each individual simulation. However, R0was significantly changed between
simu-lations to study upstream influences on vasomotion pattern.
According to the Hagen – Poiseuille law, segment 1 – 5 resistances are inversely proportional to the fourth power of the corresponding arteriolar radius,
RjÅ
KRj
r4
j
, jÅ1, 2, . . ., 5, (1)
where rjis the inner radius in the segment and KRjis a constant parameter dependent
on microvessel length. The values of parameters KRjwere determined from
measure-ments of order 3, order 2, and order 1 arteriole length in hamster dorsal cutaneous muscle microcirculation (Fig. 1a) and using the hydrostatic pressure profile in the hamster macro- and microcirculation measured by Davis et al. (1986).
Length – Tension Characteristics of the Arterioles
The inner radius of each arteriole [Eq. (1)] was obtained from a force balance in the vessel wall. The force per unit length acting on the wall, caused by the difference between intravascular and extravascular pressure, dilates the vessel, and must be equilibrated by total wall tension. According to the Laplace law,
pijrrj0per(rj/ hj)Å(sej /smj /svj)rhj, jÅ1, 2, . . ., 5, (2)
where pij is intravascular pressure in the jth segment, evaluated with reference to the
atmosphere; peis extravascular pressure (considered equal to zero); hjis wall thickness;
and sej, smj and svjare elastic, active (muscular), and viscous circumferential wall
stresses, respectively.
The intravascular pressure, pij, was computed as the weighed average of pressures
in the inflow and outflow sections. Since smooth muscle activity is usually predominant at the bifurcations and then propagates downstream (Meyer et al., 1987; Bertuglia et al., 1991), scaling factors were chosen so as to emphasize the microvessel sections close to the upstream inflow sections.
Elastic and active stresses depend on the inner radius through sharply nonlinear relationships. These reflect different stretching of elastin and collagen fibers in the wall and different overlapping of myosin and actin filaments in the muscle fibers. The dependence of the elastic and active wall stress on inner radius was reproduced using length – tension data of isolated microvessels reported by Davis and Gore (1989) in hamster cheek pouch. According to Davis and Gore, maximal active wall stress of 2A and 3A arterioles, corresponding to order 3 and order 2 arterioles, during con-striction by high K/ or norepinephrine solution is about 2.4
1 106
dyn/cm2
(1800 mm Hg).
Viscous stress in Eq. (2) is proportional to the rate of change of inner radius, hence it falls to zero in steady-state conditions. Finally, wall thickness, as a function of inner radius, was computed considering the wall incompressible.
We consider smooth muscle cell activity in basal condition about 13of that during
TABLE 1a
Note. Parameters in segment 3 are equal to those in segment 2. Similarly, parameters in segment 5 are
equal to parameters in segment 4. We only have KR2xKR3since the network is asymmetrical.
Maximal vasoconstriction in the model reduces the order 3 vessel radius by018.53%, while total vasodilation increases the radius by /47.2%. Analogous results were obtained for the order 2 and order 1 arterioles.
Table 1a shows the geometrical and biomechanical parameters of the network (see the Appendix for the meaning of symbols). Moreover, Table 1b reports the inner radii, intravascular pressures, total wall tension, and wall thickness evaluated under steady-state conditions, assuming pa Å 100 mm Hg as mean arterial pressure under basal
conditions. The simulations in the subsequent section, however, were performed on a network with an asymmetric layout (in particular, KR2xKR3in accordance with the
experimental data reported in Fig. 1a). The asymmetry introduces a small alteration in the steady-state values of the hemodynamic quantities. More significant alterations will be simulated by changing different hemodynamic parameters of the upstream arterial circulation (i.e., the inflow resistance R0and the systemic arterial pressure pa,
see Results).
The Myogenic Response
In our model feedback regulatory mechanisms and other vasoactive substances affect the amplitude of the active length – tension curve. In this paper attention is focused on the myogenic response, since our purpose is to demonstrate its role on arteriolar quasiperiodic or chaotic oscillations. Indeed, other vasodilatory or vasocon-strictory variables are described as additional constant inputs acting on smooth muscle
TABLE 1b
Basal Values of the Main Hemodynamic Parameters
r1nÅ11.261100
Note. These are coincident with the equilibrium values of the nonregulated symmetrical network (KR2Å
KR3Å 3.511006
TABLE 1c
Parameters Describing the Myogenic Response
Gms1Å40 mm Hg01cm01 Gmd1Å1600 sec mm Hg01cm01 tm1Å4 sec
Dm1Å5 sec Gms2Å40 mm Hg01cm01 Gmd2Å2400 sec mm Hg01cm01
tm2Å4 sec Dm2Å5 sec Gms4Å40 mm Hg01cm01
Gmd4Å3200 sec mm Hg01cm01 tm4Å4 sec Dm4Å5 sec
Note. Values in segment 3 are equal to those in segment 2, while values in segment 5 are equal to those
in segment 4.
cells. Additional mechanisms, such as flow-dependent or neurogenic factors, can be included in the model with further feedback loops.
Both ‘‘static’’ and ‘‘rate-dependent’’ components of the myogenic response have been considered, as in Ursino and Fabbri (1992). In particular, we assumed that the amplitude of the active length – tension curve depends on the instant value and the time derivative of total wall tension through a first-order linear differential equation. The coefficients in this equation represent the ‘‘static’’ and the ‘‘dynamic’’ gains of the myogenic response [Gmsand Gmdin Eq. (10) of the Appendix]. A notable difference
in this model with respect to the previous one is that we incorporated the presence of a latent period in the myogenic response. This choice is supported by several observations on the time pattern of the arteriolar radius following rapid step pressure changes. In particular, Grande and Mellander (1978) state that the myogenic response starts 1 – 2 sec after the beginning of a transmural pressure variation at the highest rate of change employed, but is somewhat more delayed at slower rates. Even greater delays are evident from other experiments (Davis and Sikes, 1990). We assumed a basal value for the latent period of the myogenic response as high as 5 sec, which agrees with the observation by Grande et al. (1979).
We assume that the dynamic myogenic response is predominant in terminal arteri-oles, whereas it progressively decreases in upstream parent vessels. The gains and the time constant of the mechanism in basal condition have been given (Table 1c) ac-cording to experimental results on myogenic response (Johnson and Intaglietta, 1976; Grande et al., 1979; Osol and Halpern, 1985; Davis and Sikes, 1990; Davis, 1993). Since the experimental results, however, show a wide range of values for the magnitude of the static and dynamic responses, a sensitivity analysis of these parameters is reported under Results.
RESULTS
Experimental Data
The hamster cutaneous muscle microcirculation consists in an arcading arteriolar system that gives origin to terminal branchings. It was possible to differentiate two different types of terminal networks related to the length of arteriolar orders. The first constituted a long loop feeding the muscle fibers, the second loop was shorter and was composed of three orders of arterioles. For the purpose of our study we used the data of short-loop microvasculature. The arterioles were classified according to Strahler ordering scheme, starting from capillaries assigned order 0 vessels. Order 1 were terminal arterioles and order 4 corresponded to arcading arterioles (Fig. 1a).
TABLE 2
Means of Length, Diameter of Arterioles, Frequency, and Percentage Amplitude of Vasomotion
Arteriolar Length Diameter Frequency Amplitude
order n (mm) (mm) (cpm) (%)
1 95 80{ 7 7.80{1.0 8.9{1.5 60 – 100
2 55 126{ 22 11.5 {2.2 7.8{1.6 50 – 100
3 25 234{ 40 20.1 {3.7 7.8{1.6 30 – 80
4 10 3147{629 35.4 {9.7 2.5{1.8 10 – 20
Note. Mean{SD; n, number of arterioles.
(percentage changes of mean diameter). However, order 3 arterioles originating in the short loop dominated order 2 daughter vessel vasomotion frequency, while order 1 terminal arterioles presented a higher frequency. The diameter, length, frequency, and amplitude of vasomotion in the different arteriolar orders of the short loop networks are reported in Table 2. Examples of vasomotion and corresponding power spectrum analyses are reported in Figs. 2a and 2b. During the basal observation period of vasomotion activity different temporal and spectral patterns were observed: epochs of regular activity alternated to highly irregular ones.
Simulations on the Isolated Arterioles
Preliminary simulations were conducted on isolated arterioles whose intravascular and extravascular pressures were considered input quantities. The consequent values of arteriolar diameter and resistance were computed.
We found that when a latent period is included in the myogenic response, the arteriole may exhibit self-sustained oscillations even at constant intravascular and extravascular pressure values (Fig. 3). Figure 4 shows how a pair of parameters describing the myogenic mechanism should vary concurrently to maintain the isolated microvessel in a condition of self-sustained oscillations. There are various combina-tions of the myogenic parameters (i.e., the static and dynamic gains and the latent period) which can trigger self-sustained oscillations. If the latent period and/or the dynamic gain of the myogenic response increases, self-sustained oscillations develop even in the presence of a weak static gain. By contrast, very high values of the static gain are required to induce self-sustained oscillations if both the dynamic response and the latent period are low.
Simulations on the Entire Network
The entire network simulations showed a variety of different kinds of oscillatory behavior including periodic, quasiperiodic, and chaotic patterns. These patterns may vary significantly in response to small changes in the value of a parameter. We present an example of the role of arterial pressure, whereas the results of other simulations will be briefly summarized.
When arterial pressure was 90 mm Hg, periodic self-sustained oscillations, with a fundamental frequency of about 6 cpm (Fig. 5), were observed. Therefore, the different oscillating microvessels are phase locked and, as is evident from the three-dimensional subspace (r1, r2, r4), the entire system is forced to oscillate at a single frequency.
FIG. 2. (a) Vasomotion pattern of an order 3 arteriole and the corresponding power spectrum (autoregres-sive modeling). (b) Vasomotion pattern of an order 1 arteriole and the corresponding power spectrum (autoregressive modeling).
segment 5 is constricted and vice versa. The spectrum is typical of a periodic signal, since it contains harmonic frequencies (Fig. 5).
FIG. 3. Inner-radius time changes of the simulated order 3 arteriole during experiments performed at a constant internal pressure of 40.5 mm Hg. The values of the microvessel parameters are the same as in Table 1.
quasiperiodic oscillations (Fig. 6). As is evident looking at the spectrum, system dynamics are characterized by the superimposition of two independent oscillations with incommensurate frequencies (about 6.5 and 10.5 cpm) (Fig. 6). Although the dynamics in the three-dimensional subspace appear more complex than in the previous case, the presence of chaos can be excluded since the results are insensitive to small initial perturbations and the spectrum does not exhibit a noise-like component.
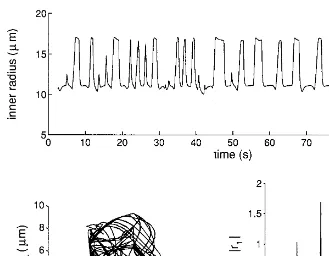
When arterial pressure was increased to 145 mm Hg the time pattern of diameter changes became extremely complex, without any well-defined periodicity (Fig. 7). The dominant oscillation frequency in the short period shows large variations. The trajectories describe a strange attractor in the phase space (Fig. 7). The dynamic is chaotic because of the sensitive dependence of the trajectories on small initial perturba-tions (Fig. 8). Moreover, the spectrum, computed over a long period, exhibits well-defined spikes superimposed on a noise-like component (Fig. 7).
Changes from periodic to quasiperiodic or chaotic patterns, consistent with those previously shown, were also observed at constant arterial pressure, modifying R0 or
simulating microvascular networks with a different geometrical asymmetry [parameter KR2in Eq. (1)].
FIG. 4. Relationships between the parameters of the myogenic mechanism (static gain, Gms; dynamic gain, Gmd; latent period, Dm) at the boundary from stability to instability. The graphs show how a pair of parameters should be modified together to maintain the isolated microvessel in a condition of self-sustained oscillation. The results concern an isolated order 3 arteriole with a constant intravascular pressure of 40.5 mm Hg. The left graph was obtained with a constant pure latency, DmÅ5 sec, and different combinations of the static and the dynamic gain. The right graph was obtained with a dynamic gain GmdÅ440 sec mm Hg01
cm01
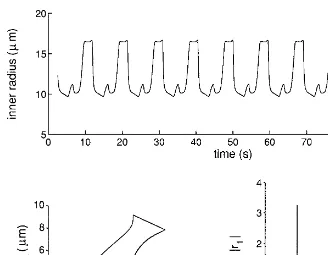
FIG. 5. Time pattern of inner radius in segment 1 (order 3 arteriole) (top), its frequency spectrum (bottom right), and a projection of the trajectories in a three-dimensional subspace (r1, r2, and r4, bottom left) of the simulated model with R0Å51106mm Hg sec cm03(upstream resistance) and PaÅ90 mm Hg (systemic arterial pressure). In this case the network exhibits periodic self-sustained oscillations, the spectrum is composed of equispaced lines, and the trajectories are limit cycles. Both the spectrum and the trajectories have been computed for a time period (400 sec) longer than the one shown at the top. In the data the initial simulation transient is omitted.
Simulation of Blood Flow Changes at Bifurcation in the Network
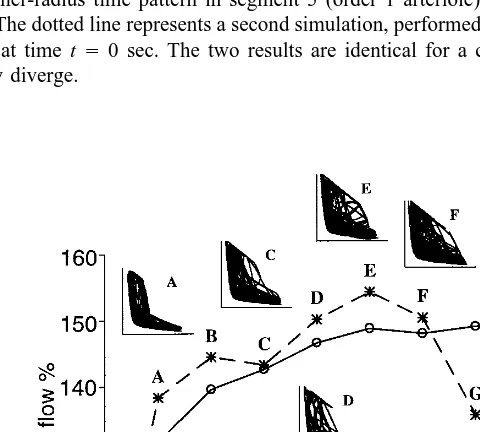
Finally, we analyzed whether the presence of arteriolar self-sustained oscillations, and their specific patterns, affects blood flow distribution at bifurcations. In these simulations the dynamic gain of the myogenic mechanism was changed by the same percentage amount in all the segments. We calculated the time-averaged blood flow entering segments 2 and 3 (Fig. 9). Since alterations in the dynamic myogenic compo-nent do not affect the steady-state level of the model, the observed variations in mean blood flow are imputable to the presence and the time pattern of the self-sustained oscillations. When the dynamic myogenic component is weak, the model settles at a stable equilibrium (Fig. 9) corresponding to the steady-state condition. A progressive increase in the dynamic myogenic response determines an unstable condition, and chaotic oscillations develop. A very high dynamic myogenic component induces more regular oscillations with a quasiperiodic behavior.
FIG. 6. Time pattern of inner radius in segment 1 (order 3 arteriole) (top), its frequency spectrum (bottom right), and a projection of the trajectories in a three-dimensional subspace (r1, r2, and r4, bottom left) of the simulated model with R0Å 51106mm Hg sec cm03(upstream resistance) and Pa Å120 mm Hg (systemic arterial pressure). In this case the network exhibits quasiperiodic oscillations, the spectrum is composed of lines at incommensurate frequencies, and the trajectories move on a closed surface. Both the spectrum and the trajectories have been computed over a time period (400 sec) longer than the one shown at the top. In the data the initial simulation transient is omitted.
segment 3 demonstrates a significant reduction (about0154020%) compared with the previous mean blood flow, whereas the blood flow in segment 2 does not show significant changes.
DISCUSSION
The main findings of our study are the occurrence of self-sustained diameter oscilla-tions in isolated arterioles and the presence of periodic, quasiperiodic, and chaotic oscillatory patterns in a microvascular network. Furthermore, vasomotion waveforms affect blood flow distribution at bifurcations.
Self-Sustained Oscillations in Isolated Microvessels
FIG. 7. Time pattern of inner radius in segment 1 (order 3 arteriole) (top), its frequency spectrum (bottom right), and a projection of the trajectories in a three-dimensional subspace (r1, r2, and r4, bottom left) of the simulated model using a value R0Å5110
6
mm Hg sec cm03
for the upstream resistance and a value
PaÅ145 mm Hg for the systemic arterial pressure. In this case the network exhibits chaotic oscillations, the spectrum is composed of a noisy component superimposed on spikes at incommensurate frequencies, and the trajectories move on a strange attractor. Both the spectrum and the trajectories have been computed over a time period (400 sec) longer than the one shown at the top. The data were obtained after a long initial simulation, which is not shown.
By using these parameters, the model reproduces diameter oscillations occurring when the arteriole is isolated from the circulation and its transmural pressure is at a constant level. The bifurcation diagrams (Fig. 4) show that there are various combina-tions of the parameters allowing the myogenic mechanism to cause biomechanical instability and diameter oscillations in isolated microvessels. The oscillation emerges from a Hopf bifurcation (Glass and Mackey, 1988) and has a frequency in the range 5 – 10 cpm. These results are in agreement with observations on cannulated arterioles (Duling et al., 1981; Osol and Halpern, 1988). The result that oscillations may occur at various values of the static and dynamic gain and of the latent period indicates that the model behavior is not critically conditioned by a particular parameter value.
A combination of model parameters which can cause oscillations in isolated microves-sels is not necessarily able to induce oscillations when microvesmicroves-sels are joined together to form a multibranched network. For example, in isolated vessels, the gain of the dynamic myogenic response can be lowered to 25% of its basal value (400 sec mm Hg01
cm01
FIG. 8. Effect of a small initial perturbation on model response in chaotic regimen. The continuous line shows the inner-radius time pattern in segment 5 (order 1 arteriole) computed with the same parameters as in Fig. 7. The dotted line represents a second simulation, performed by perturbing the segment 5 diameter by 0.01mm at time tÅ0 sec. The two results are identical for a certain period (about 200 sec shown) then abruptly diverge.
Complex Patterns in Multibranched Networks: Experimental and Theoretical Results
Arteriolar vasomotion was observed in all preparations under basal conditions and presented higher fundamental frequencies in order 3 arterioles compared with those previously reported (Bertuglia et al., 1991). This finding may be related to the charac-teristics of the terminal network used for this study since there was an arcading system of arterioles giving rise to shorter and longer terminal branchings. The short loop was characterized by the predominance of order 3 vessel vasomotion frequency on order 2 arterioles.
A few recent experimental studies (Yamashiro et al., 1990; Intaglietta and Breit, 1991; Griffith and Edwards, 1993) suggest that vasomotion may exhibit some aspects of chaotic dynamics. Griffith and Edwards (1993) observed that episodes of nearly periodic oscillations may alternate with irregular fluctuations, and the same perturba-tion may occasionally lead to large-amplitude oscillaperturba-tions or may suppress the rhyth-mic activity. This finding has been regarded as an example of the inherent unpredict-ability of vasomotion dynamics.
In this study we did not compute some index of chaos directly from the experimental tracings, as in the previous works, but we used a different approach. We demonstrated that vasomotion may be chaotic by formulating a deterministic mathematical model able to predict irregular diameter fluctuations similar to those observed experimentally. The simulation results indicate that a parameter change may induce periodic, quasi-periodic, or chaotic patterns of diameter oscillations in a multibranched network. In particular, changes in arterial pressure, in arteriolar resistance, or in the geometrical symmetry of the network can shift system dynamics from periodic to quasiperiodic to chaotic. Furthermore, the waveforms and frequencies of vasomotion were similar in the simulated and experimental situations, with both periodic and irregular patterns of behavior (Fig. 2).
Although our data showed the presence of chaotic fluctuations when systemic arte-rial pressure was increased (Figs. 5 – 7) or upstream resistance was decreased, there is no single, well-defined criterion to achieve chaos. Indeed, monotonic small changes in a parameter which initially cause the appearance of chaotic patterns can subse-quently lead to a stabilization of the trajectories on a new periodic attractor and afterward may cause the reappearance of chaos. This is a typical feature of many chaotic systems (Glass and Mackey, 1988). An example of this behavior, characterized by an abrupt change from chaos to periodicity is evident in Fig. 9 when passing from point F to point G.
It has been suggested that chaotic and periodic fluctuations may reflect an intrinsic difference in the control mechanisms operating on the system (Golderberger, 1990; Intaglietta and Breit, 1991). Whenever several control mechanisms work simultane-ously, the system might exhibit a random or chaotic behavior, typical of healthy subjects; by contrast, suppression of some mechanisms, as may occur in pathological conditions, might result in the appearance of a periodic oscillatory behavior.
Our results suggest that the shift from a periodic to a chaotic pattern may be a consequence of a modest change in a parameter not necessarily related to pathophysio-logical conditions. Accordingly, our in vivo observations in the skeletal muscle showed that in some instances periodic vasomotion became quasiperiodic or chaotic in normal conditions.
oscillatory patterns is not necessarily representative of a pathological mechanism and may reflect differences in the sensitivity and the initial conditions of microcirculation. Moreover, contractile responses not only elicited by the myogenic mechanism may induce oscillatory patterns.
In the model, chaos appears to emerge from a complex coupling among various oscillators. The simulations of isolated microvessels demonstrate that a pressurized arteriole may act as an autonomous oscillator. In the network, these oscillators inter-play, mutually influencing their intravascular pressures. Mathematical theories of two coupled nonlinear oscillators (Arnold, 1983) suggest that, if the amplitude and fre-quency of the oscillators are varied, many coupling patterns may occur. At certain values of amplitude and frequency, two coupled oscillators may exhibit a stable entrainment, characterized by N:M phase locking, with N and M integer numbers, i.e., N cycles of the first oscillator correspond to exactly M cycles of the second. In such a condition the whole system performs periodically. However, at other values of the amplitude and frequency, the oscillators may exhibit no stable entrainment. In this case, the frequencies of the two oscillators are incommensurate, and the whole system behaves quasiperiodically. Finally, if oscillation amplitudes are sufficiently high (for instance, when arterial pressure is increased), quasiperiodic and periodic trajectories can be converted by complex topological structures into chaos (Glass and Mackey, 1988; Arnold, 1983).
The present model is too complex for attempting a complete theoretical analysis of its transitions toward chaos. Indeed, our aim was not to build a simple theory of vasomotion, oriented to mathematical exploration, but rather to develop a comprehen-sive model based on biomechanical laws, geometrical parameters, and physiological data. The use of a complex rather than of a simple model may permit better understand-ing of the mechanisms leadunderstand-ing to vascular oscillations and, in perspective, may be used to study the role of vasomotion in clinical and/or pathophysiological conditions.
Vasomotion Effect on Flow Partition at Bifurcation
Our results indicate that arteriolar vasomotion may significantly affect the average rate of blood flow and may contribute to blood flow distribution in the network (Fig. 9).
The major findings of the simulations (Fig. 9) are that vasomotion determines a 40 – 60% increase in the mean blood flow compared with that under steady-state condition and that blood flow distribution at bifurcations depends on the oscillation waveforms. Furthermore, chaotic oscillations tend to maintain a constant ratio of blood flows in the branches, whereas more regular fluctuations cause a different partition of flow at bifurcation thus increasing flow in one branch compared with the other. We suggest that, during chaotic fluctuations, all arterioles exhibit similar random diameter changes; during periodic or quasiperiodic diameter fluctuations, the time period associ-ated with vasodilation or vasoconstriction may vary from one segment to the next. Based on these observations it appears that the response heterogeneity and vasomotion waveforms at bifurcations can exert a functional effective control on microvascular perfusion.
arterioles can increase more than reduce their diameter. Therefore, when diameter oscillations develop, vasodilation prevails on vasoconstriction, and the effective diame-ter increases. Ardiame-teriolar responsiveness, however, might be different when starting from vasodilated vessels.
In conclusion, our data support a strong correlation between myogenic mechanism and arteriolar vasomotion. The model predicted self-sustained diameter oscillations in isolated arterioles and more complex quasiperiodic or chaotic fluctuations in the networks. The activity pattern of vasomotion might alter blood flow distribution at bifurcations, thus affecting the total microcirculation hemodynamics.
APPENDIX: QUANTITATIVE MODEL DESCRIPTION
Mechanical Properties of a Single Microvessel
For the model of a single microvessel we used the Laplace law
pijrrj0per(rj/rj) ÅsjrhjÅTj, j Å1, 2, . . ., 5, (3)
where pij, rj, hj, and sjare intravascular pressure, inner radius, wall thickness, and
total wall stress (force per unit surface) in the jth segment and pe is extravascular
pressure.
Total wall stress is computed as the sum of elastic, active (muscular), and viscous stress (se,sm, andsv, respectively). Analytical expressions (Ursino and Fabbri, 1992),
are
A value to the parameters in Eqs. (5) – (7) has been given to reproduce the patterns of active and elastic wall stress (Davis and Gore, 1989) in the hamster cheek pouch and considering that the equilibrium point is located in the ascending portion of the active stress – inner radius curve. The basal values are denoted by the subscript n in Eqs. (3 – 7) and are shown in Table 1b of the text.
We assumed that feedback physiological mechanisms and other vasoactive factors affect smooth muscle activity by modifying the amplitude of the active stress – inner radius relationship [Eq. (6)]; i.e., we have
sm0j Åsm0jnr 3e
xj
exj
/2e00.5xj , (8)
where xjreproduces the effect of all vasoactive factors on smooth muscle tension at
the jth segment. The right-hand member of Eq. (8) has sigmoidal shape, reflecting the existence of upper and lower autoregulation limits.
myogenic response (xmj) and (ii) a term (xej) which includes all the remaining
vaso-active factors. We assume that interaction between these two terms is additive:
xj(t)Åxmj(t 0Dmj)/xej(t), j Å1, 2, . . ., 5, (9)
where t denotes the present instant of the simulation and Dmj is the latent period of
the myogenic response.
We assume that basal smooth muscle activity (i.e., when xjÅ0) is
1
3of the maximum
activity [Eq. (8)]. Different preexisting levels of tone can be simulated by assigning a nonzero value to the additional term xej(xejõ0 means vasodilation, hence a lower
preexisting tone, and vice versa).
While the xejin Eq. (9) ( jÅ1, 2,rrr5) are input quantities for the present model,
i.e., their value can be established during the simulation, the terms xmj depend on wall
tension through dynamical relationships, which reproduce the main features of the myo-genic response. The following equations include both static and rate-dependent compo-nents of the myogenic mechanism, according to the data by Grande et al. (1979):
xhmjÅ 0
1
tmj
r[xmj0Gmsjr(Tj0Tjn)0GmdjrTgj], jÅ1, 2, . . ., 5. (10)
The upper point in Eq. (10) represents the time derivative of the corresponding quan-tity. Tjin Eq. (10) is total wall tension, computed from Eq. (3). Its time derivative is
obtainable from Eqs. (3) and (4):
TgjÅphijrrj/pijrrhj0pher(rj/hj) 0per(rhj/ hhj) (11)
hhjÅ 0rhj/
rjrrhj
hj/rj
. (12)
Eq. (10) presumes that the state variable xmjis equal to 0 when wall tension is at
the basal value shown in Table 2. An increase in wall tension causes an increase in xmj, with consequent smooth muscle activation and reduction in vessel caliber. The
static and dynamic gains of the mechanism (Gmsj, Gmdj) and its time constant (tmj)
were chosen to reproduce the myogenic response (Johnson and Intaglietta, 1976; Grande et al., 1979; Davis, 1993).
The inner radius is a state variable for the present model. In fact, from Eqs. (3) and (7) one can write
The previous equations allow one to compute the time pattern of inner radius, rj,
Pressure and Flow Profile in the Network
To obtain the pressure and flow profile at the different sections of Fig. 1, we can consider the following steps:
(i) Since inner radii are state variables for the model [Eq. (13)], their values are known at a given instant. We can compute the value of the hydraulic resistances in the different segments as a function of inner radius, of arteriolar length, lj, and of
blood viscosity,m, by the Hagen – Poiseuille law
RjÅ
KRj
r4
j
Å8rmrlj
prr4j
, jÅ1, 2, . . ., 5. (14)
The constant parameters, KRj, in the order 3 and 2 arterioles (i.e., in segments 1–3 of
Fig. 1a) have been calculated with a blood viscosityÅ0.04 poise and using the length of microvessels measured in the hamster dorsal cutaneous muscle. Parameters KR4 and
KR5, concerning the downstream resistance from terminal arterioles down to postcapillary
venules, are given to set pressure in terminal arterioles at about 30 mm Hg (Table 1b). Moreover, by denoting with R1S the series arrangement of resistances R0 and R1,
with R2S the series arrangement of resistances R2 and R4, and finally with R3S the
series arrangement of R3and R5, i.e.,
R1SÅR0/R1, R2S ÅR2/ R4, R3SÅ R3/R5, (15)
one can easily compute the input resistances at points A and B of Fig. 1b (namely, RAand RB). We have
RB ÅR2SrR3S/(R2S/R3S) (16)
RAÅR1S /RB.
(ii) From the values of hydraulic resistances, computed by Eqs. (14) – (16), blood flow, qj, in the jth segment, and intravascular pressure, pk, at point k of the network,
are obtained by Kirchhoff laws. We have
q1Å( pa 0pv)/RA (17)
pA1Åpa0R0rq1 (18)
pBÅ pa 0R1Srq1 (19)
q2Å( pB0pv)/R2S (20)
q3Å( pB0pv)/R3S (21)
pc ÅpB0R2rq2 (22)
pDÅpB 0R3rq3 (23)
pi1Å(10a)rpA1/arpB (24)
pi2Å(10a)rpB/ arpc (25)
pi4Å (10a)rpc /arpv (27)
pi5Å (10a)rpD /arpv. (28)
pij in Eqs. (24) – (28) is intravascular pressure at a representative section of the jth
segment, to be used in Eqs. (3) and (13). Parameter a (0 õ a õ 1) describes the longitudinal position of this section along the segment. Since smooth muscle activity in microvessels is stronger in the vicinity of the branching points, we choseaÅ0.1
(the inflow section).
(iii) Once the values of intravascular pressures have been obtained [Eqs. (15) – (28)], the state equation (13) [together with Eqs. (1) – (12)] can be used to compute the time derivatives of inner radius (rgjÅdrj/dt; jÅ 1, 2, . . ., 5) in all segments of
the network.
(iv) From knowledge of the inner-radius time derivatives, Eqs. (14) – (16) can be used to obtain the time derivatives of vascular resistances:
RhjÅ 0
(v) Finally, the time derivatives of blood flows and intravascular pressures at all points of the networks can be computed from Eqs. (17) – (28) and using Eqs. (29) – (31). The expressions of pgijso obtained are used in Eq. (11) and Eq. (10) to evaluate
the time derivative of the state variables xmj.
The system of differential equations has been numerically integrated on MS-DOS 486 personal computers, using the fourth-order Runge – Kutta method with adjustable step length.
REFERENCES
Ackari, H., Rachev, A., Stergiopulos, N., and Meister, J. J. (1994). A theoretical investigation of low frequency diameter oscillations of muscular arteries. Ann. Biomed. Eng. 22, 253 – 263.
Arnold, V. I. (1983). ‘‘Geometrical Methods in the Theory of Ordinary Differential Equations.’’ Springer-Verlag, New York.
Bertuglia, S., Colantuoni, A., Coppini, G., and Intaglietta, M. (1991). Hypoxia- or hyperoxia-induced changes in arteriolar vasomotion in skeletal muscle microcirculation. Am. J. Physiol. 260 (Heart Circ.
Physiol. 29), H362 – H372.
Borgstrom, P., and Gestrelius, S. (1987). Integrated myogenic and metabolic control of vascular tone in skeletal muscle during autoregulation of blood flow. Microvasc. Res. 33, 353 – 376.
Borgstrom, P., Grande, P. O., and Mellander, S. (1982). A mathematical description of the myogenic response in the microcirculation. Acta Physiol. Scand. 116, 363 – 376.
Colantuoni, A., Bertuglia, S., Coppini, G., and Donato, L. (1990). Superposition of arteriolar vasomotion waves and regulation of blood flow in skeletal muscle microcirculation. In ‘‘Oxygen Transport in Tissue XII’’ (J. Piiper et al., Eds.), pp. 549 – 558. Plenum, New York.
Davis, M. J. (1993). Myogenic response gradient in an arteriolar network. Am. J. Physiol. 264 (Heart Circ.
Physiol. 33), H2168 – H2179.
Davis, M. J., and Gore, R. W. (1989). Length – tension relationship of vascular smooth muscle in single arterioles. Am. J. Physiol. 256 (Heart Circ. Physiol. 25), H630 – H640.
Davis, M. J., and Sikes, P. J. (1990). Myogenic responses of isolated arterioles: Test for a rate-sensitive mechanism. Am. J. Physiol. 259 (Heart Circ. Physiol. 28), H1890 – H1900.
Davis, M. J., Ferrer, P. N., and Gore, R. W. (1986). Vascular anatomy and hydrostatic pressure profile in the hamster cheek pouch. Am. J. Physiol. 250 (Heart Circ. Physiol. 19), H291 – H303.
Duling, B. R., Gore, R. G., Dacey, R. G., and Damon, D. N. (1981). Methods for isolation, cannulation, and in vitro study of single microvessels. Am. J. Physiol. 241 (Heart Circ. Physiol. 10), H108 – H116. Glass, L., and Mackey, M. C. (1988). ‘‘From Clocks to Chaos: The Rhythms of Life.’’ Princeton Univ.
Press, Princeton, NJ.
Goldberger, A. L., Rigney, D. R., and West, B. J. (1990). Chaos and fractals in human physiology. Sci.
Am. 262, 43 – 49.
Gonzales Fernandez, J. M., and Ermentrout, B. (1994). On the origin and dynamics of the vasomotion of small arteries. Math. Biosci. 119(2), 127 – 167.
Grande, P. O., and Mellander, S. (1978). Characteristics of static and dynamic regulatory mechanisms in myogenic microvascular control. Acta Physiol. Scand. 102, 231 – 245.
Grande, P. O., Borgstrom, P., and Mellander, S. (1979). On the nature of basal vascular tone in cat skeletal muscle and its dependence on transmural pressure stimuli. Acta Physiol. Scand. 107, 365 – 376. Griffith, T. M., and Edwards, D. H. (1993). Mechanisms underlying chaotic vasomotion in isolated resistance
arteries: Roles of calcium and EDRF. Biorheology 30, 333 – 347.
Intaglietta, M., and Breit, G. A. (1991). Chaos and microcirculatory control. In ‘‘Capillary Functions and White Cell Interaction’’ (H. Messmer, Ed.), Prog. Appl. Microcirc. 18, pp. 22 – 32. Karger, Basel. Johnson, P. C., and Intaglietta, M. (1976). Contributions of pressure and flow sensitivity to autoregulation
in mesenteric arterioles. Am. J. Physiol. 231(6), 1686 – 1698.
Kiani, M. F., Pries, A. R., Hsu, L. L., Sarelius, I. H., and Cokelet, G. R. (1994). Fluctuations in microvascular blood flow parameters caused by hemodynamic mechanisms. Am. J. Physiol. 266 (Heart Circ. Physiol. 35), H1822 – H1828.
Meyer, J. U., and Intaglietta, M. (1986). Measurement of the dynamics of arteriolar diameter. Ann. Biomed.
Eng. 14, 109 – 117.
Meyer, J. U., Lindbom, L., and Intaglietta, M. (1987). Coordinated diameter oscillations at arteriolar bifurcations in skeletal muscle. Am. J. Physiol. 253 (Heart Circ. Physiol. 22), H568 – H573.
Osol, G., and Halpern, W. (1985). Myogenic properties of cerebral blood vessels from normotensive rats.
Am. J. Physiol. 249 (Heart Circ. Physiol. 18), H914 – H921.
Osol, G., and Halpern, W. (1988). Spontaneous vasomotion in pressurized cerebral arteries from genetically hypertensive rats. Am. J. Physiol. 254 (Heart Circ. Physiol. 23), H28 – H33.
Ursino, M., and Fabbri, G. (1992). Role of the myogenic mechanism in the genesis of microvascular oscillations (vasomotion): Analysis with a mathematical model. Microvasc. Res. 43, 156 – 177. Ursino, M., Fabbri, G., and Belardinelli, E. (1992). A mathematical analysis of vasomotion in the peripheral
vascular bed. Cardioscience 3, 13 – 25.