Abstract—Cutting Stock Problem has been used in many industries like paper, glass, wood and etc. Cutting Stock Problem has helped industries to reduce trim loss and at the same time meets the customer’s requirement. The purpose of this paper is to develop a new approach which is Cuckoo Search Algorithm in Cutting Stock Problem. Cutting Stock Problem with Linear Programming based method has been improved down the years to the point that it reaches limitation that it cannot achieve a reasonable time in searching for solution. Therefore, many researchers have to turn to metaheuristic algorithms as a solution to the problem which also makes these algorithms become famous. Cuckoo Search Algorithm is selected because it is a new algorithm and outperforms many algorithms. Hence, this paper intends to experiment the performance of Cuckoo Search in Cutting Stock Problem.
Index Terms—Cuckoo search algorithm, swarm intelligence, cutting stock problem, optimization.
I. INTRODUCTION
The Cutting-Stock Problem (CP) is an optimization problem, or more specifically, an integer linear programming problem. It arises from many applications in industry, for examples, paper, glass, steel, furniture, leather and others. Not only cutting stock problem helps in saving material and also in optimizing the usage of resources, but also being part of the green manufacturing research purpose [1]. Importance of this research had been supported by many academic publications throughout this ten years period. One of the academic papers is written by G. Belov et al which implemented a cutting plane algorithm (CPA) in CP [2]. Based on the paper, this research attempts is to experiment Cuckoo Search Algorithm (CSA) in CP.
However, there is still limitation in Cutting Stock Problem (CSP) in meeting industrial requirement due to multiple sizes demanded from the customers which create multiple patterns that cause Cutting Stock Problem unable to search for the best solution. The best solution of Cutting Stock Problem is minimizing the wastage and at the same time meeting customer’s requirement. According to previous work, Linear Programming based method is used to overcome this problem, but unfortunately the wastage unable to be minimized. Therefore, Cuckoo Search is well suitable to replace the Linear Programming based method and assist Cutting Stock Problem to search the best solution.
Manuscript received July 2, 2014; revised September 6, 2014. This work was supported in part by the Universiti Teknikal Malaysia Melaka (UTeM) and the Ministry of Higher Education (MOHE) of Malaysia under the Research Acculturation Grant Scheme (RAGS).
The authors are with the Faculty of Electrical Engineering, Universiti Teknikal Malaysia Melaka, Malaysia (e-mail: [email protected], [email protected], [email protected], [email protected], [email protected], [email protected]).
II. CUTTING STOCK PROBLEM
Cutting stock problem is defined as an integer decision variable for each possible pattern. It is also known as a layout plan to predict the final result of the cutting patterns. The main objective is to minimize the trim loss or cost value. The other objectives of cutting stock problem are to minimize the number of stocks and to minimize the number of partially finished item [3].
The concept of CSP is to find the optimized cutting patterns along with the number of stock roll which is used to meet the demand of ordered rolls which is also known as customer orders, and also to bring the cost for the wastage to its least amount plus other controllable factors. In order to achieve the goal, the total amount of the roll width cut from each stock roll must not be more than the usable width of the stock roll. The formula for cutting stock is shown as follows [4]:
Let Ri be the nominal order requirements.
Wi be the rolls of width, where i = 1, …, m, to be cut from
the stock rolls of usable width, UW.
RLi is the lower bounds on the order requirement, whereas RUi is the upper bounds on the order requirement
Min ∑J Tj Xj (1)
Subject to RLi ≤ ∑J Aij Xj ≤ RUi for all i (2)
Xj ≥ 0and integer, (3)
∑J Aij Wj≤ UW, (4)
Aij≥ 0 and integer, (5)
Xj is the number of stock rolls to be slit using pattern j, and Tj the trim loss incurred by pattern j, Tj = UW - ∑J Aij Wj, (6)
III. METAHEURISTIC ALGORITHMS
Modern Metaheuristic algorithms are primarily influenced by biological nature. It seems that biological systems work in such a way that produces a remarkable result towards adaptation, reliability and robustness in the dynamic and even hostile environments in spite of individual simplicity. Metaheuristic algorithms are capable in dealing with a huge E. F. Shair, S. Y. Khor, A. R. Abdullah, H. I. Jaafar, N. Z. Saharuddin, and A. F. Zainal Abidin
Cuckoo Search Approach for Cutting Stock Problem
whereAijis the number of rolls of widthWi, to be slit from
each stock roll that is processed using pattern j. In order for the elements,Aij, i =1, …,m,to constitute a feasible cutting
total population in iteration and for each population’s individual, the function is evaluated and a fitness function is assigned [5]. Besides, metaheuristic algorithms are capable of solving non-differentiable nonlinear-objective functions. As for the classical optimization, it will be hard to get the solutions of these functions. Therefore, concept of metaheuristic algorithms works in a way that the intensification desires to search for the current best solution and choose the best among the candidates or solutions. On the other hand, metaheuristic algorithm is able to venture the search space effectively due to its diversification. Examples of metaheuristic algorithms are Genetic Algorithm, Particle Swarm Optimization, Simulated Annealing, Ant Colony Optimization and etc.
IV. CUCKOO SEARCH ALGORITHM
Based on paper by X. Yang, Cuckoo Search Algorithm has three laws [6]. Firstly, an egg laid by a cuckoo at a time, and then leave its egg in a random nest which is chosen by the cuckoo; secondly, for the eggs to proceed to the next
generation, it has to be the best nest and cuckoo’s egg is of high quality; lastly, the present number for host nests is fixed and the probability for the host to find out the egg belongs to a cuckoo is Pa ∈ [0, 1]. In this situation, there are two
possibilities; the host may dump cuckoo’s egg; leave the
present nest to build new nest. Based on this concept, the new nests with new randomly solutions replace the nest, n and the fraction, Pa of nest, and n is able to estimate the last assumption.
For maximization problem, a solution’s fitness is
corresponding to the objective function. Let each egg be a solution and let the new solution be a cuckoo’s egg, the objective is to replace a poorer result of solution in the nests with the new solutions which results in better egg. Furthermore, this algorithm can handle a nest own with numerous number of eggs represent a set of solutions; this situation is a complex case.
x(t+1)i = x(t) i + α ⊕ L´evy(λ) [6] (7)
The above L´evy flight equation x is a new solution and
i is a cuckoo. The new solution is generated when the L´evy flight is performed. Based on the paper, α must be greater than 0, α is the step size that is corresponded with the scales
of the interests’ problem, α = 1 is usually used [6]. The L´evy flight equation is a stochastic equation which is proposed for random walk. A random walk is called as a Markov chain, its future status and location are highly depending on the present location which is the first time in L´evy flight equation and the changing probability is the second time. The product ⊕ means entry wise multiplications. L´evy flight provides a random walk and L´evy distribution that has an infinite variance with an infinite mean provides the random step length.
∼ u = t−λ, (1< λ ≤ 3) [6] (8)
These steps are able to produce a process of random walk process with a power law step-length distribution and a heavy tail. L´evy should generate some of the new solutions walk around the best solution which is obtained. In this situation is able to speed up the local search. Far field randomization should generate a substantial fraction of the new solutions and the distance of the locations from the current best solution should be sufficiently far, in order to protect the system from stucking in a local optimum.
V. EXPERIMENTAL WORK
A. Design Cutting Stock Problem Model
In designing a cutting stock problem (CSP), the objectives are to minimize the trim loss and at the same time the
outcome of summation of the patterns’ rolls must meet the requirement order or customer’s order. In other words, the reduction of wastage is subjected to cutting roll to meet customer’s order or order requirement. The problem is formulated as linear program shown below [4].
Min ∑J Tj Xj (9)
RLi= the lower bounds on the order requirement, RUi = the upper bounds on the order requirement Xj = the number of stock rolls to be slit using pattern j j= pattern
In some cases, there are papers prefer to use this formula [7]. Algorithm will apply in this linear programming. CSP model is designed using Matlab based on its constraints which must be fulfilled. The following shows the constraints that must be satisfied [4].
, to be cut from the
L'evy
∑J Aij Wj ≤ UW, (15)
Aij ≥ 0 and integer, (16)
Tj = UW - ∑J Aij Wj, (17)
Tjis the trim loss incurred by pattern j Aijis the number of rolls of width Wi UW = stock rolls of usable width.
Wi= the rolls of width, where i = 1, …, m, to be cut from
the stock rolls of usable width, UW.
J = pattern
Calculations were done before proceed with Matlab modeling in order to check the Matlab result. Consider a situation where the stock rolls are 50 inch wide and the requirement orders are summarized, 1 final of width 10 inch, 1 final of width 50 inch, 1 final of width 30 inch, 1 final of width 15 inch, 2 finals of width 25 inch.
Let
UW= 50 (inch);
aij = 10 (inch), a2j = 50 (inch), a3j = 30 (inch) a4j = 15 (inch), a5j= 25 (inch)
The table shows the acceptable cutting patterns which is less than stock rolls inch, UW.
TABLEI:ACCEPTABLE CUTTING PATTERNS
j 1 2 3 4
A1j 1 0 0 0
A2j 0 1 0 0
A3j 0 0 1 0
A4j 0 0 1 0
A5j 0 0 0 2
When j = 1
Tj (Trim Loss) = UW –(a1j) Tj= 50 –10 = 40
When j = 2
Tj = UW –(a2j) Tj= 50 – 50 = 0
When j = 3
Tj = UW –[(a3j)+ (a4j)] Tj = 50 – [(30) + (15)] = 5
When j = 4
Tj = UW –2[(a5j)] Tj = 50 – [2(25)] = 0
Total trim loss
Tj= 40 +5 = 45
B. Design Cuckoo Search Algorithm in Cutting Stock Problem
The previous design of Cutting Stock Problem is based on its constraint which is not completed; hence, Cuckoo Search Algorithm is applied to fulfil the whole concept of Cutting Stock Problem. Basically, the purpose of Cuckoo Search Algorithm is to search for the feasible solution or best fitness in Cutting Stock Problem. The best fitness is referring to low wastage or trim loss which is obtain from the Cutting Stock
Problem’s constraint. Cuckoo Search Algorithm is designed
in accordance to Cutting Stock Problem’s formula in (12), (13) and (14).
In other words, in exploring the fitness which is obtained from constraint of Cutting Stock Problem, Cuckoo Search Algorithm is subjected to the formula above by finding the lowest wastage or trim loss as its best fitness and at the same time the outcome of summation of the rolls of patterns must
meet the requirement order or customer’s order.
Cuckoo Search Algorithm is characterized by Xin-She Yang in three rules:
Each cuckoo lays one egg at a time, and dumps its egg in randomly chosen nest
The best nests with high quality of eggs will carry over to the next generations
The number of available host nests is fixed, and the egg laid by a cuckoo is discovered by the host bird with a probability pa∈ [0, 1].
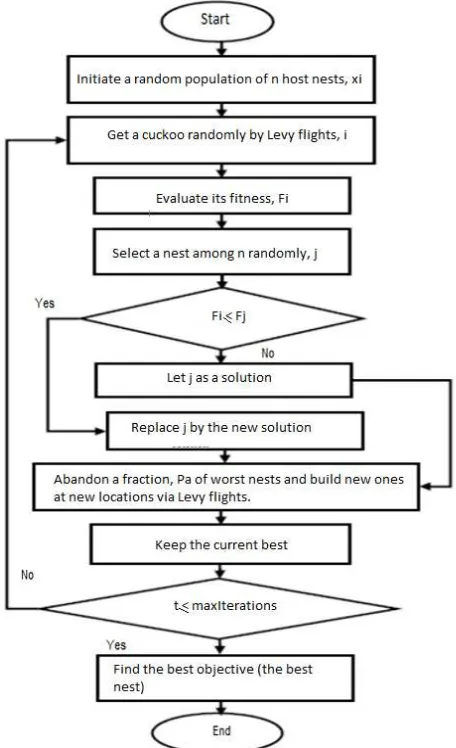
The flow chart in Fig. 1 shows Cuckoo Search Algorithm in searching the feasible solution.
Fig. 1.Flow chartfor Cuckoo Search Algorithm [8].
VI. RESULTS AND DISCUSSION
In this section, there are two sets of data collections done in order to obtain the optimal solution which is the minimum wastage. Cuckoo Search Algorithm (CSA) consists of 4 parameters which is Pa (probability), β (beta), n (nest) and Ni
contributing to the optimal solution. In other words, to obtain the optimal solution, the values of the four parameters must be determined. Therefore, the two sets of data collections needed to be carried out through the designed coding are β versus Pa and n versus Ni. It is started with β versus pa to
determine the best value for β and Pa and at the same time, Ni
and n is set as constant. Once the value forβ and Pa is found, it is applied in n versus Ni which is the final step to determine
the optimal solution. Before the CSA parameter is determined, input data of Cutting Stock Problem are considered too. The input data of Cutting Stock Problem are width of stock rolls, demand width and number of demand width.
In this case, width of stock rolls is 5600 mm wide and its
number is unlimited. As for the demand width and number of
demand width are shown in Table II. This set of values is based on paper [9].
TABLEII:DEMAND WIDTH AND NUMBER OF DEMAND WIDTH [8]
Demand Width Number of Demand Width
1380 22
1520 25
1560 12
1710 14
1820 18
1880 18
1930 20
2000 10
2050 12
2100 14
2140 16
2150 18
2200 20
Hence, the parameters of Cutting Stock Problem remain constant throughout the data collection.
A. β versus Pa
β versus Pa is carried out first which is shown in Table III, to determine the best combination of values for β and Pa that contribute to the best fitness. In this case, the best fitness is the lowest wastage, Ni and n is set as constant with the value
of 1000 and 25 respectively. In Table III, all the fitness is an average of 10 values which obtained from the same combination of β and Pa. For an example, in Table IV, β = 0.5 and Pa = 0.1 which gives the fitness of 58200, to get this fitness, β= 0.5 and Pa = 0.1 are used to run 10 times in the program, in order to get the average fitness of 10 fitness. The tested values of pa are from 0.1 to 0.9 and the tested values of β are from 0.5 to 2.5.
TABLEIII:Β VERSUS PA
From Table III, the worst fitness is 62680 which is obtain from Pa = 0.5 and β = 2.25. Furthermore, the most common
fitness is 57640 and 58200 which appear 13 times and 10 times respectively in the table. As for the best fitness also known as the lowest wastage is 55400 which obtained from
Pa = 0.8 and β = 0.5. Based on the best fitness in β versus Pa,
Pa = 0.8 and β= 0.5 are applied as a constant in n versus Ni.
Based on Table III it seems that fitness changes according to β and Pa. As β increases, it increases the possibility of getting poor fitness that is more than 60,000. The possibility of poor fitness appears from β = 1.25 to β = 2.5. For example, when β = 1.25, there is one poor fitness which is 60440; when β = 1.5, there is one poor fitness which is 60440; when β = 1.75, there is 6 poor fitness which is 61560, 61000, 61000, 61000, 61000 and 60440; when β = 2, there is 5 poor fitness which is 61000, 62120, 60440, 61000 and 61560; when β = 2.25, there is 4 poor fitness which is 60440, 61000, 60440 and 62680; when β = 2.5, there is 7 poor fitness which is 61000, 61000, 61560, 62120, 61000 and 61560. On the contrary, Pa shows a different function compared to β, it seems that Pa increases, a low possibility of poor fitness appears. Pa = 0.1 to Pa = 0.9 is observed; when Pa = 0.1, there is 3 poor fitness which is 61540, 61000 and 61000; when Pa = 0.2, there is 4 poor fitness which is 60440, 62120 and 61000; when Pa = 0.3, there is 4 poor fitness which is 61000, 60440 and 60440; when Pa = 0.5, there is 4 poor fitness which is 61000, 61000, 62680 and 62120; when Pa = 0.6, there are 3 poor fitness which is 60440, 61560 and 61000; when Pa = 0.7, there is 2 poor fitness which is 61000 and 61560; when Pa = 0.8, there is no poor fitness; when Pa = 0.9, there is one poor fitness which is 60440. Therefore, to obtain a feasible solution, the value of Pa must be high; on the other hand, value of β must be low. In this case, the best fitness is obtained from Pa = 0.8 which is high and β= 0.5 which is low.
Fig. 2. β versus Pa.
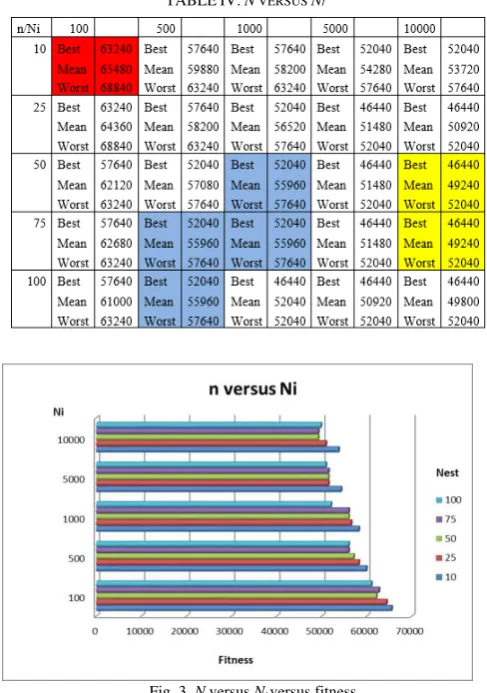
B. N versus Ni
The set of data collection in Table IV is the final step to determine the optimal solution which also known as the minimum wastage. The value for β = 0.5 and Pa = 0.8 are obtained from the previous Table III are used in n versus Ni as
constant values. In Table IV, nest with the value from 10 to 100 is used to test with iteration of 100 to 10000. Each combination of nest and iteration revealed the values for
“Best”, “Mean” and “Worst”. “Best” is known as the best
iteration which runs 10 times. “Mean” is defined as the
average fitness of the 10 values that obtained from the same
combination of nest and iteration. “Worst” is the worst fitness
or highest wastage which is selected from the 10 values that obtained from the same combination of nest and iteration. For an example, in Table IV, iteration = 100 and nest = 10 shows
that “Best” equals to 63240, “Mean” equals to 65480 and “Worst” equals to 68840. To obtain this result, iteration = 100 and nest = 10 are used to run 10 times in the program, to obtain 10 values. From the 10 values, the minimum wastage
or highest wastage is selected for “Best” and “Worst”, the average of the 10 values is for “Mean”.
From Table IV, the best mean is 49240 which is from the combination of Ni = 10000 and n = 50 and n = 75, and its best
fitness is 46440 and its worst fitness is 52040. As for the mode mean is 55960, it appears in the combination of Ni =
1000 with n = 50 or n = 75, and also the combination of Ni =
500 with n = 75 or n = 100. The best fitness of mode mean is 52040 and the worst fitness of the mode mean is 57640. As for the worst mean is 65480 from the combination of Ni = 100
and n = 10, and it consists of best fitness with value of 63240 and worst fitness with the value of 68840.
Fig. 3. N versus Ni versus fitness.
In Fig. 3, it is observed that as the nest, n increases, and the
value of “Mean” decreases. This shows that the optimal
solution is improved, when nest increases. For example, when Ni= 100, as n increases from 10 to 100, the value of “Mean” decreases. Same goes to Ni = 500, Ni = 1000, Ni=
5000 and Ni= 10000, when n increases from 10 to 100, the value of “Mean” also decreases. Furthermore, iteration, Ni
also has the same properties as nest that when iteration is increased, the optimal solution is improved. Iteration, Ni is
observed from 100 to 10000; it seems that the value of
“Mean” decreases regardless of the value of nest. In this case,
the optimal solution is found in the combination of Ni =
10000 with n = 50 or n = 75, which has a high number of iteration and a high value of nest. Literally, the current optimal solution is capable to be improved, by increasing the iteration and nest. Unfortunately, the increase of nest and iteration leads to a longer duration in obtaining the result. Therefore, the nest and iteration are limited to a certain range in this data collection.
C. Without Cuckoo Search Algorithm (CSA)
The Table V shows the set of data collection which is obtained from Cutting Stock Problem without applying CSA. The purpose is to compare CSA in Cutting Stock Problem with the absent of CSA in Cutting Stock Problem. Since the absent of CSA in Cutting Stock Problem, the only parameter for Cutting Stock Problem to be altered is iteration. And the iteration is set in range of values from 100 to 10000 which is the same range as CSA. Every value of iteration is run 10 times to obtain the average value of “Best”, “Mean” and
“Worst”. From Table V, the best mean is 68840 which is from the iteration of 5000 and 10000, its best fitness is 68840 and its worst fitness is 68840. While, the mode mean is 68840 which appears in the iteration of 5000 and 10000. And the best fitness of mode mean is 68840 and the worst fitness of the mode mean is 68840. As for the worst mean is 75560 from the iteration of 100 and it consists of best fitness with value of 74440 and worst fitness is 80040.
TABLEV:WITHOUT CSA
Iteration 100 500 1000 5000 10000
Best 74440 68840 68840 68840 68840
Mean 75560 73880 72200 68840 68840
Worst 80040 74440 74440 68840 68840
Furthermore, Table VI is the comparison of CSA and without CSA with three aspects are focused that is “Best
mean”, “Mode mean” and “Worst mean”. The result of “Best mode”, “Mode mean” and “Worst mean” in Table VI is obtained from the Table IV and Table V respectively.
TABLEVI:COMPARISON WITH CSA AND WITHOUT CSA
It is expected that the overall result of CSA is better than without CSA in Cutting Stock Problem in order to prove the CSA in Cutting Stock Problem model is valid. Based on Table VI, the best mean, mode mean and worst mean of CSA shows a significant result compared to without CSA. Since Cuckoo Search Algorithm in Cutting Stock Problem shows a
drastic effect compare with Cutting Stock Problem without algorithm, this shows that the designed CSA in Cutting Stock Problem is valid.
VII. CONCLUSION
The approach of Cuckoo Search Algorithm (CSA) is proposed in Cutting Stock Problem to explore the performance of the proposed algorithm. Cuckoo Search Algorithm in Cutting Stock Problem has been validated and compare with without CSA, Genetic Algorithm (GE) and Evolutionary Programming (EP). Based on result and comparison, the performance of Cuckoo Search Algorithm is superior to without CSA, but also have a same performance as GE and EP. This is partly because of the extra parameters
in Cuckoo Search Algorithm which is pa and β that causes the performance better than without CSA. Furthermore, in accordance to the result, Pa and β increase the frequentation of appearance of the best fitness or minimum wastage, while the other parameters; nest and iteration are capable of improving the feasible solution. This shows that Cuckoo Search Algorithm is able to reveal the best fitness frequently, at the same time; the fitness is able to be improved too. This shows that the motivation of this paper is achieved by Education (MOHE) of Malaysia for its financial support from Research Acculturation Grant Scheme (RAGS) RAGS/2013/FKE/TK02/03/B00026 for sponsoring the resources for this research.
Ezreen Farina Shair was born in Selangor, Malaysia
in 1987. She received her B.Eng degree in control and
instrumentation engineering from Universiti
Teknologi Malaysia (UTM), in 2009. She received her M.Eng degree in mechatronics and automatic control engineering also from UTM, in 2012. Currently, she is a lecturer at Universiti Teknikal Malaysia Melaka (UTeM) and her interests are in control system and digital signal processing.
Shen Yang Khor is a final year student at Universiti
Teknikal Malaysia Melaka (UTeM). He is currently pursuing his degree in electrical engineering – power electronics and drives. His final year project focuses on optimization techniques under the supervision of Ms. Ezreen Farina Shair.
Abdul Rahim Abdullah was born in Kedah, Malaysia
in 1979
Degree from University of Technology Malaysia (UTM) in 2001, 2004 and 2011 in electrical engineering and digital signal processing. He is currently a senior lecturer at Universiti Teknikal Malaysia Melaka (UTeM) and his interests is in digital signal processing.
Hazriq Izzuan Jaafar received his B.Eng degree in
electrical engineering from Universiti Teknologi Malaysia (UTM), in 2008. He received the M.Eng degree in mechatronics and automatic control engineering also from UTM, in 2013. Currently, he is a lecturer at Universiti Teknikal Malaysia Melaka (UTeM) and his interests are in control system and optimization techniques.
Nur Zawani Saharuddin
in electrical engineering (industrial power) from Universiti Teknikal Malaysia Melaka (UTeM). She received her M.Eng degree in electrical energy and power system from Universiti Malaya (UM). Currently she is a lecturer at Universiti Teknikal Malaysia Melaka (UTeM) and her research interest is in power system transient.
Y. Chunping, S. Tianfeng, Z. Zhaoxia,and L. Fei, “Research and
application of one-dimensional optimal cutting stock system oriented
to manufacturability,” in Proc. World Congress on Computer Science
and Information Engineering, 2009, pp. 191-195.
G. Belov and G. Scheithauer, “A cutting plane algorithm for the one-dimensional cutting stock problem with multiple stock lengths,”
European Journal of Operation Research, vol. 141, pp. 274-294, 2002.
K. Liang, X. Yao, C. Newton, and D. Hoffman, “A new evolutionary
approach to cutting stock problems with and without contiguity,”
Computers & Operations Research, vol. 29, pp. 1641-1659, 2002.
R. W. Haessler and E. S. Paul,“Cutting stock problems and solution
procedures,”European Journal of Operational Research, vol. 54, pp.
141-150, 1991.
M. A. Razzaque et al., “A comparative study of particle swarm
optimization and cuckoo search techniques through problem-specific
distance function,”inProc. International Conference of Information
and Communication Teachnology (ICoICT), pp. 88-92, 2013.
X. Yang and S. Deb,“Cuckoo search via L’evy fligts,”in Proc. the
World Congress on Nature and Biologically Inspired Computing
(NABIC “09), 2009, pp. 210-214.
Q. Lu, Z. Wang, and M. Chen “An ant colony optimization algorithm for the one-dimensional cutting stock problem with multiple stock
lengths,” in Proc. Fourth International Conference on Natural
Computation, 2008, pp. 475-479.
K. N. A.Rani, “Nature-inspired cuckoo search algorithm for side lobe
suppression in a symmetric linear antenna array”, presented at 17th Asia-Pacific Conference on Communications (APCC), 2012. E. Kalvelagen. (2007). Column generation with GAMS. [Online]. Available: http://www.amsterdamoptimization.com/pdf/cogen
. He received his B. Eng, master and PhD
received her B. Eng degree
Amar Faiz Zainal Abidinreceived his bachelor of
engineering in electrical and electronics from
![TABLE II: DEMAND WIDTH AND NUMBER OF DEMAND WIDTH [8]](https://thumb-ap.123doks.com/thumbv2/123dok/503805.56738/4.595.56.281.650.750/table-ii-demand-width-number-demand-width.webp)