Diagnostic test of predicted height model in Indonesian elderly: a study in an
urban area
Fatmah
Public Health Nutrition Department, Public Health Faculty, University of Indonesia, Jakarta, Indonesia
Abstrak
Tujuan Dalam menilai status gizi usia lanjut (lansia) seringkali ditemukan kesulitan pengukuran tinggi badan (TB) akibat kelainan tulang belakang dan mobilitas. Salah satu alternatifnya menggunakan nilai prediksi dari panjang depa, tinggi lutut, dan tinggi duduk. Beberapa persamaan ketiga prediktor tersebut telah dikembangkan untuk memperkirakan TB lansia Indonesia. Persamaan yang tertuang dalam kartu Penilaian Status Gizi (PSG) lansia ini dan merupakan teknologi pertama di Indonesia, harus diujicobakan lebih dahulu sebelum diterapkan di masyarakat. Tujuan studi adalah untuk melakukan veriikasi model TB prediksi dalam kartu PSG dengan TB sebenarnya.
Metode Disain cross sectional melalui pengukuran antropometri pada 400 lansia sehat di Jakarta telah dilakukan. Studi ini merupakan studi validasi kedua, selain studi pertama yang telah dilakukan di Kota Depok mewakili wilayah semi urban. Hasil Lansia laki-laki memiliki rata-rata usia, TB, berat badan, panjang depa, tinggi lutut, dan tinggi duduk lebih tinggi dibandingkan lansia perempuan. Korelasi terbesar ditemukan pada prediktor tinggi lutut dengan nilai yang sama pada lansia perempuan (r = 0.80; P < 0.001) dan laki-laki (r = 0.78; P < 0.001), selanjutnya panjang depa, dan tinggi duduk. Tinggi lutut memiliki selisih paling rendah dengan tinggi badan sebenarnya pada laki-laki (3,13 cm) dan perempuan (2,79 cm). Tinggi lutut mempunyai nilai sensitivitas tertinggi (92,2%) dan nilai spesiisitas terbesar pada tinggi duduk (91,2%).
Kesimpulan Persamaan TB prediksi berdasarkan panjang depa, tinggi lutut, dan tinggi duduk dapat digunakan dalam menilai status gizi lansia Indonesia. (Med J Indones 2010; 19: 199-204)
Abstract
Aim In an anthropometric assessment, elderly are frequently unable to measure their height due to mobility and skeletal deformities. An alternative is to use a surrogate value of stature from arm span, knee height, and sitting height. The equations developed for predicting height in Indonesian elderly using these three predictors. The equations put in the nutritional assessment card (NSA) of older people. Before the card which is the irst new technology in Indonesia will be applied in the community, it should be tested. The study aimed was to conduct diagnostic test of predicted height model in the card compared to actual height.
Methods Model validation towards 400 healthy elderly conducted in Jakarta City with cross-sectional design. The study was the second validation test of the model besides Depok City representing semi urban area which was undertaken as the irst study.
Result Male elderly had higher mean age, height, weight, arm span, knee height, and sitting height as compared to female elderly. The highest correlation between knee height and standing height was similar in women (r = 0.80; P < 0.001) and men (r = 0.78; P < 0.001), and followed by arm span and sitting height. Knee height had the lowest difference with standing height in men (3.13 cm) and women (2.79 cm). Knee height had the biggest sensitivity (92.2%), and the highest speciicity on sitting height (91.2%).
Conclusion Stature prediction equation based on knee-height, arm span, and sitting height are applicable for nutritional status assessment in Indonesian elderly. (Med J Indones 2010; 19: 199-204)
Key words: diagnostic test, elderly, predicted height model
Correspondence email to: [email protected]
Malnutrition is still a frequent common nutrition problem in elderly in form of undernutrition and overnutrition. Combination between physiology and psychology changes have contribution into development malnutrition in elderly. Therefore, the early screening of malnutrition is really important through weight and height measurements as anthropometric assesment.1 Height is an important clinical indicator to derive body mass index (BMI) predicting the nutritional status.
However, height measurement in elderly may impose
some dificulties and the reliability is doubtful due
Until now, the assessment of nutritional status in elderly posyandu, community health center, and hospital are still use Chumlea and Eleanor D. Sthlenker equations1 Both models were acquired from white and black Caucasoid races elderly knee height measurement. The stature and skin color differences of them with Indonesian elderly can reduce the accuracy of predicted height when compared to actual height.
Chumlea developed an equation to estimate height in elderly through knee height. The formula which was developed for Caucasians Ethnic after validated in some studies found that the predicted value were overestimated. Myers et al. (1985) proven Chumlea equation leaded to a systematic error when it was applied in the Japanese-American elderly people.4 The Eleanor equation was collected from a Caucasians eldelry was not really appropriate to be used in Javanese elderly.5 The application of Chumlea and Eleanor models which were not appropriate for Indonesian elderly, the existing of predicted height on elderly studies, and the lack of standardized model for predicting Indonesian elder’s stature encouraged a study for developing predicted height model for Javanese Ethnic elderly in January-February 2008.6 The results of the previous study produced a nomogram for height prediction, NSA card in the form of BMI tables from predicted stature based
on gender. The NSA card needs to be veriied through a
comparison of the predicted height and the actual height in healthy elderly who can still stand up straight.
METHODS
Research Design
The study design was a cross sectional study measured the following independent variables: height, weight, knee height, arm span, and sitting height towards the
Subjects were of the various ethnics elderly (Javanese, Sundanese, Bataknese, etc) aged 55 years older who living alone and or with their family at the community. All the subjects were not related to disorders of bone, muscle or joints, able to spread both hands perfectly, and were in good health. None of the participating
subjects had spinal curvature. They were able to stand erect without any support for height measurement. Four hundreds elderly (176 males and 224 females) recruited for the purpose of verifying Indonesian based equations.
Sampling Method at the Study Site
Two Stages Stratiied Random Sampling Method was
used to choose the study sites using 2 selection stages at subdistrict and kelurahan (urban village) level. The subject was selected in a random manner using Simple Random Sampling method in each selected kelurahan. There were 8 selected kelurahan: Grogol, Kedaung Kaliangke, Serdang, Sumur Batu, Jatipadang, Ragunan, Semper Barat, and Pondok Bambu. The subject size for each selected kelurahan taken from the proportion of the number of the elderly in the area (proportional allocation sampling). measured. Weight was measured using SECA scale and the height was measured using microtoise. Knee height measurement was conducted using a knee height caliper in supine position. The arm span was measured using a 2-meter wooden ruler with subjct standing straight and spreading the arm as far as he/she can without clenching the hands. The sitting height was measured using two wooden stools with different size for male elderly (44 cm) and female elderly (40 cm).
Data Analysis
The mean difference of the actual height and predicted height from arm span, knee height, and sitting height in cm based on gender were analyzed in this study. The smaller the difference between the two, the more valid the value because it approximates the actual height. The mean anthropometric differences based on height, weight, knee height, arm span, and sitting height with gender were analyzed using independent
t-test. Pearson Correlation Test (correlation coeficient)
test based on BMI from the actual height and predicted height was conducted by calculating the sensitivity,
speciicity, and predictive values for undernutrition and
overnutrition diagnostic test in elderly. The higher the sensitivity value of a height predictor in diagnosing undernutrition and overnutrition cases among elderly with normal nutritional status, the more valid it was compared to other height predictors.
RESULTS
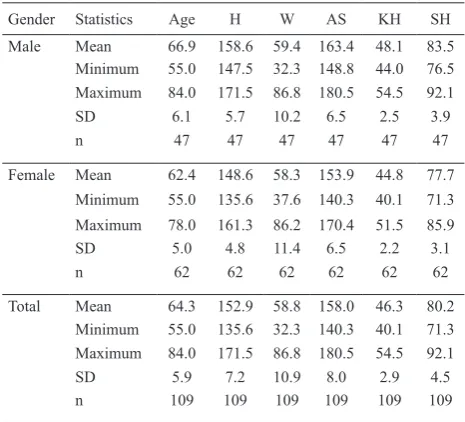
The anthropometric characteristics of the study subject were presented in Table 1. The Mean age of the male elderly was 66.5 years old and the female elderly was 64.8 years old. The minimum age of the male and female elderly was the same, i.e. 55 years old. The oldest age for male elderly who was measured anthropometrically was a little bit older (93 years old) compared to the female one (83 years old). The mean for anthropometric height, weight, arm span, and sitting height of the male elderly were higher compared to those of the female elderly (Table 1).
Correlation coeficient of the knee height and actual height
was the highest compared to the predicted height from arm span, sitting height, Chumlea, and Eleanor equations for both genders. The knee height had the biggest
correlation coeficient with the actual body height in male and female elderly (r = 0.879). Knee height correlation in male elderly was similar to the Eleanor equation, which was the strongest correlation (r = 0.802) among other
predicted height models. The same thing was found for female elderly where knee height and Eleanor equations had the highest correlation with the actual height which also showna similar value (r = 0.779). Chumlea also had the strongest correlation with the actual height in the male elderly. However, Chumlea equation was developed from anthropometric measurement of Caucasian elderly who had different body posture compared to the Indonesian elderly. Meanwhile, the Eleanor equation had the lowest correlation (r = 0.447) based on gender. There was a
signiicant correlation between all predicted height
models with the actual height.
The mean difference between predicted height from the three predictors as well as the two equations and the actual height are shown in Table 3. Knee height had the lowest mean difference value (3 cm) towards the actual height in the two gender groups as well as in the female elderly group. However, the same did not apply in male elderly where the predicted height from Chumlea equation showed the lowest difference towards actual height (3.13 cm). Gender Statistics Age H W AS KH SH
Male Mean 66.9 158.6 59.4 163.4 48.1 83.5 Minimum 55.0 147.5 32.3 148.8 44.0 76.5 Maximum 84.0 171.5 86.8 180.5 54.5 92.1
SD 6.1 5.7 10.2 6.5 2.5 3.9
n 47 47 47 47 47 47
Female Mean 62.4 148.6 58.3 153.9 44.8 77.7
Minimum 55.0 135.6 37.6 140.3 40.1 71.3
Maximum 78.0 161.3 86.2 170.4 51.5 85.9
SD 5.0 4.8 11.4 6.5 2.2 3.1
n 62 62 62 62 62 62
Total Mean 64.3 152.9 58.8 158.0 46.3 80.2 Minimum 55.0 135.6 32.3 140.3 40.1 71.3 Maximum 84.0 171.5 86.8 180.5 54.5 92.1
SD 5.9 7.2 10.9 8.0 2.9 4.5
n 109 109 109 109 109 109
Table 1. Mean of age, height (H), weight (W), arm span (AS), knee height (KH), and sitting height (SH)
Variables Correlation coeficient
Male p-value Female p-value Total p-value
Arm span and Body Height 0.791 0.001 0.844 0.001 0.883 0.001
Knee Height and Body Height 0.837 0.001 0.793 0.001 0.878 0.001
Sitting Height and Body Height 0.741 0.001 0.707 0.001 0.847 0.001
Arm span and Knee Height 0.783 0.001 0.813 0.001 0.865 0.001 Arm span and Sitting Height 0.509 0.001 0.564 0.001 0.709 0.001 Knee Height and Sitting Height 0.496 0.001 0.496 0.001 0.679 0.001
Table 2. Correlation coeficient of three predictors to the actual height based on gender
Gender Statistic Eleanor Chumlea AS KN SH
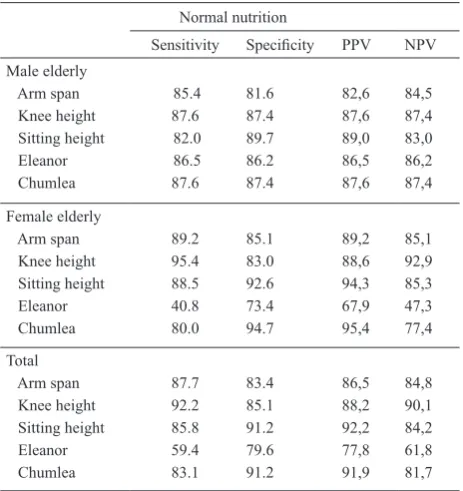
The results of study shows knee height had the highest sensitivity value. Sitting height and Chumlea equations
had the highest speciicity in both genders (Table 4).
Arm span and sitting height had the second and third highest sensitivity level (87.7% and 85.8% respectively) in male and female elderly. In the mean time, the
speciicity values of knee height and arm span occupied
the two highest positions based on gender (85.1% and 83.4% respectively). Sitting height predictor had the highest Positive Predictive Value (PPV) (92.2%) and the highest Negative Predictive Value (NPV) found in knee height predictor (90.1%) based on gender. The male elderly had the highest PPV and NPV in knee height. Chumlea model had the highest PPV in female elderly and followed by the sitting height. Meanwhile, knee height had the highest NPV in female elderly (Table 4).
DISCUSSION
The mean anthropometric measurements for height, weight, arm span, knee height, and sitting height of males were higher that those for females. This was in general agreement with the results of two studies.
The irst study was conducted on Chinese Elderly in
South America and Chile.7 Male elderly were taller
and heavier compared to female elderly because the two groups experienced a quite fast reduction of weight due to the loss of fatty mass and high fat free. The second study from Suriah et al. (1998) stated that female elderly weight reduction was bigger compared to male elderly from the age of 60-69 years old to 80-89 years old.8 A study by Santos et al. (2004) in Chile elderly showed a reduction of weight. The reduction of weight happens with the increasing age due to reduced functional ability with a daily food intake of only 50%, disturbance in chewing process, low appetite, and low saliva production for chewing.7
The reduction of male stature was lower than the female. According to Celeste et al. (2002), elderly loose 2.7 cm height and female loose 4.22 cm from 60 years old to more than 76 years old.9 Female experiences accelerated
bone loss during the irst ive years after reaching
thire menopause. The female’s risk for osteoporosis exposure was bigger than the male. Male looses his cortical bone slower and naturally during the tissue loss process.10 Height reduction in elderly relates to changes in body posture, osteoporosis, spinal damage, kyphosis abnormality and scoliosis.11
In general, the male elderly had higher mean knee height, arm span and sitting height compared to female
in all age groups. This inding was consistent with the
study of Fatmah (2009) and FNRI (2002) that showd that male elderly had higher mean knee height, arm span and sitting height compared to female.5, 9 A study on Chinese elderly showed that the female elderly arm span was shorter than those of the male (respectively, 162.1 cm and 177.0 cm) and the male sitting height was higher (89.8 cm) than that of the female (83.8 cm).12
Another study supported the indings of this study wass
the study of Santos et al. (2004). Knee height of the male elderly was higher than those of the female, but the value was relatively constant in all age groups. The differences happened due to the different body posture and physical activity between male and female.7
Knee height had the strongest correlation with the actual height in the two genders compared to the arm span
and sitting height. This inding was contrast with the two
studies conducted in South India female elderly (Mohanty et al. 2001) and Fatmah (2010).13,14 The irst study found that the strongest correlation was found between the arm span and the actual height (r = 0.82) compared to the
sitting height and leg length. The inding of the second
study among elderly in Depok City proved that the arm span had a strongest correlation with the actual height. Normal nutrition
However, this study was consistent with the study of Bermudez et al (1999) in Hispanic elderly that showed a strong correlation between the knee height and the actual height.15
The lowest difference between predicted height and actual height was found in Chumlea and Eleanor models for all male elderly measured. These two models also used knee height parameter gained from Caucasian elderly anthropometric measurement. The sensitivity of predicted height from knee height to assess undernutrition/overnutrition status among elderly with normal nutrition status was the highest compared to the arm span, sitting height, Chumlea and Eleanor equations. In other words, knee height can catch undernutrition and overnutrition cases in male and female elderly among normal elderly better compared to the other two
predictors and two equations. The speciicity level of
the sitting height to recognize normal nutrition group among undernutrition and overnutrition cases in male and female elderly was the highest compared to the arm span, knee height, Eleanor and Chumlea equations. Based on gender, the sitting height predictor had the
highest speciicity level in assessing normal nutrition
status among male elderly with undernutrition and/ or overnutrition status. A similar picture was found in normal NSA from female elderly group with under/ over nutrition status after the sensitivity level from Chumlea equation.
Positive Predictive Value (PPV) was a measurement to
ind out a probability whether a patient really suffers
from a disease or not.16 Sitting height had the highest PPV in all subjects and also based on gender, meaning that this predictor was the most appropriate predictor to be used in getting the probability of elderly who has undernutrition or overnutrition. Negative Predictive Value (NPV) describes probability that a patient really does not have a disease.16 Knee height had the most accurate probability in screening elderly who really has normal nutrition status, both in all subjects and based on gender.
In conclusion, the veriication test of predicted height
model from arm span, knee height and sitting height proven that knee height had the strongest correlation with the actual height compared to arm span and sitting height. The lowest mean difference (in cm) was found between the actual height and knee height predicted height in male and female elderly. High sensitivity value of knee height compared to the other four predicted height models in male and female elderly. The sensitivity of predicted height from knee height in
assessing under/over nutrition among elderly people who have normal nutrition status was the highest compared to the arm span, sitting height, Chumlea, and
Eleanor equations. Sitting height was the most speciic
predictor in screening elderly with normal nutrition among elderly with undernutrition and overnutrition status. Therefore, the utilization of one of the three predictors is recommended for elderly who cannot be stand straight for height measurement due to abnormalities in the spine or paralysis, or other abnormalities.
Acknowledgments
We would like to thank the Directorate of Research and Community Dedication of the University of Indonesia for its contribution in funding this study through the Riset Unggulan Utama UI (RUUI) or UI Major Top Research for Health Year 2009. We also thank to all people who were selected as subject, i.e. elderly from the selected kelurahan as study site, community health center, hospital, elderly care organization, and all the enumerators for their contribution in this study.
REfERENCES
Ministry of Health, Republic of Indonesia. Manual of 1.
nutrition management in elderly for community health center staffs. Jakarta: Directorate of Public Nutrition, Directorate General of Public Health, MOH RI; 2005. 2. Chumlea, Shumei S. G., Kevin W. et al. Stature prediction
equations for elderly non-Hispanic white, non-Hispanic black, and Mexican-American persons developed from NHANES III Data. Journal American Diet Association.1998; 98: 137 – 42.
3. Salim O., Rina K. Final report on knee height as a predictor of height in elderly people. Jakarta: Community Medical Department, Faculty of Medicine, Trisakti University; 2005.
4. Fatmah. Equation model of height in institutionalized elderly at Jakarta dan Tangerang Cities. Family and Nutrition Media. 2005; 30: 48 – 57.
5. Fatmah. Predictive equations for estimation of stature from knee height, arm span, and sitting height in Indonesian Javanese elderly people. International Journal of Medicine and Medical Sciences. 2009; 10: 456-61.
6. WHO Expert Committee. Physical Status: The use and interpretation of anthropometry. Geneve: WHO; 1999. 7. Gibson R. The principles of nutritional assessment 2nd ed.
New York: Oxford University Press; 2005.
8. Pheasant S. Body space anthropometry, ergonomics and the design of work 2nd ed. New York: Taylor & Francis, 2000. 9. Suriah AR,T J Chong, B.Y. Yeoh. Nutritional situation of
10. De Lucia, Lemma, Tesfaye et al. The use of arm span measurement to assess the nutritional status of adults in four Ethiopean ethnic groups. European Journal of Clinical Nutrition. 1998; 56: 91-5.
11. John P. Principles and practice of geriatric medicine 4th ed. Vol 2. England: Wiley, 2006.
12. Rossman I. Clinical Geriatrics. Philadelphia: Lippincott; 1986.
13. Santos J.L., Albala C., Lera L. et al. Anthropometric measurements in the elderly population of santiago, Chile. Nutrition. 2004; 20: 452-7.
14. Xiao F.W., Yunbo D., Henry M et al. Body segment lengths and arm span in healthy men and women and patients with vertebral fractures. Osteoporosis International. 2004; 15: 43-8.
15. Mohanty S.P, Suresh B, Sreekumaran N. The use of arm span as a predictor of height: a study of South Indian women. Journal of Orthopaedic Surgery. 2001; 9: 19-23. 16. Altman DG and J.M. Bland. Statistics Notes: Diagnostic