DOI: 10.12928/TELKOMNIKA.v15i1.4618 48
Dynamic Economic Dispatch Problems: PSO Approach
Mohd Ruddin Ab Ghani*1, Saif Tahseen Hussein2, Nur Huda Mohd Amin3, Zanariah Jano4, Tole Sutikno5
1,3
Faculty of Electrical Engineering, Universiti Teknikal Malaysia Melaka (UTeM) 76100, Durian Tunggal, Melaka, Malaysia
2
Ministry of Electricity, Baghdad, Iraq
4Centre for Languages and Human Development, Universiti Teknikal Malaysia Melaka (UTeM)
5
Department of Electrical Engineering, Faculty of Industrial Technology, Universitas Ahmad Dahlan (UAD), Jln Prof. Dr. Soepomo, Janturan, Yogyakarta 55164, Indonesia
*Corresponding author, e-mail: [email protected]
Abstract
Due to limited availability of coal and gases, optimization plays an important factor in thermal generation problems. The economic dispatch problems are dynamic in nature as demand varies with time. These problems are complex since they are large dimensional, involving hundreds of variables, and have a number of constraints such as spinning reserve and group constraints. Particle Swarm Optimization (PSO) method is used to solve these challenging optimization problems. Three test cases are studied where PSO technique is successfully applied.
Keywords: dynamic economic dispatch, PSO, problem formulation, modelling
Copyright © 2017 Universitas Ahmad Dahlan. All rights reserved.
1. Introduction
More than three-fourth of power generated in this world is through non-reusable resources like coal and gas. As these resources are limited, there is need to spend them judiciously. Thus, optimization plays a key role in the thermal generation problem. In this problem, fuel cost is minimized, and supply-demand matching is the equality constraint. This is referred to as the economic dispatch problem. In the 1920s, such problems were treated as static [1] where demand remained fixed for a given time. In the present scenario, the problem is more complex as demand varies with time resulting in suitable adjustment by each power plant to supply accordingly. Such time-varying demand-supply problems are termed as dynamic economic dispatch (DED) problems. Using optimization, a significant amount of power and cost can be saved. There is a saying, power saved is power produced.
The optimization problem not only has supply demand equality constraint but has to meet a number of inequality constraints as well. The ramp rate constraint ensures safe operations of thermal generators. Some other important constraints for the DED problems are:
1. Spinning reserve requirements 2. Generation capacity
3. Group constraints 4. Emission constraints 5. Security constraints
Attempts have been made to solve the dynamic economic dispatch DED problem as an optimization problem for each time step. However, this approach results in sub-optimal solution [2]. For example, in a 10 generator problem with 6 periods [3], the optimal solution gives the minimum cost as 85043 units whereas period by period optimized solution results into minimized cost as 85047 units. Table 1 and Table 2, summarize optimal dispatch solutions with the two approaches.
The DED problem was first solved using the optimal control formulation [4]. In this approach, state equations are provided, and co-state equations need to be derived. Further, if more constraints are added or deleted, optimal control technique requires a reworking of the formulation. Which makes it the major drawback of this method? At present, DED problems are solved using both gradient based (like, sequential quadratic programming) and stochastic methods (like Genetic Algorithm and Particle Swarm Optimization) [5-9].
Using PSO, the multi-objective economic dispatch problem [10] was solved by combining two contradictory objectives (emission and economic cost) with the use of penalty factor towards forming a single objective problem. The emission cost and the normal fuel costs are blended with the introduction of the price penalty factor. In order to find a solution to the bid-based dynamic economic dispatch in the context of a competitive electricity market, Zhao [11] utilized PSO with constriction factor and inertia weight. The maximization of social profit, which is the difference between a customer’s benefit function to a generator’s cost function, is the objective function of their study. Among the topics discussed in this paper are generation bid quantities; power balance; ramp rate limits; customer bid quantities; line limit, and emission as equality and inequality constraints in the optimization process.
On the other hand, a hybrid method involving PSO with sequential quadratic programming (SQP) is used to solve a DED problem. Their study considered several factors, namely ramp rate limit; real power balance; the voltage at load bus; generation limit; transmission line constraints; and spinning reserve as constraints to the problem. In order to fine-tune the solution region, this method integrates PSO algorithm as the global optimizer with SQP as a local optimizer.
In this paper, PSO (Particle Swarm Optimization) method is used to solve large dimensional economic dispatch problems. Because of its simplicity in solving the practical ED problem, population-based PSO has been recognized as the fast growing solution algorithm. The main advantage of PSO method is that it is more likely to find a globally optimal solution rather than local optima.
2. Problem Formulation
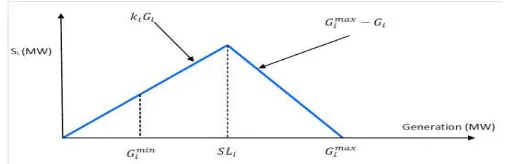
Ideally, thermal generating powerhouses should generate units which balance the consumer’s load demand. The number of units generated by different power plants is the design variables that need to be determined, and typical objective function of the optimization problem is to minimize the overall cost of producing the number of demanded units. In DED, the number of units produced by thermal power plants varies with time so as to bridge the gap between demand and supply. The rate at which a thermal power plant can change its unit generating capacity is called as the ramp rate limit. This parameter is also known as loading and deloading rate limits of the generator. The ramp rate is defined based on practical considerations such as load and mechanical stresses on the generator. Thus, it takes a finite time to change the capacity of generating units for a thermal plant, as shown in Figure 1.
Table 1. Optimal Dispatch Solution
Generator Period-1 Period-2 Period-3 Period-4 Period-5 Period-6
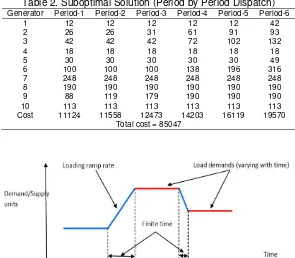
Table 2. Suboptimal Solution (Period by Period Dispatch)
Generator Period-1 Period-2 Period-3 Period-4 Period-5 Period-6
1 12 12 12 12 12 42
2 26 26 31 61 91 93
3 42 42 42 72 102 132
4 18 18 18 18 18 18
5 30 30 30 30 30 49
6 100 100 100 138 196 316
7 248 248 248 248 248 248
8 190 190 190 190 190 190
9 88 119 179 190 190 190
10 113 113 113 113 113 113
Cost 11124 11558 12473 14203 16119 19570
Total cost = 85047
Figure 1. Typical Demand/Supply Unit Variations with Time
2.1. Basic Model
Ideally, thermal generating, the objective function for DED problem is to:
∑ ∑ (1)
Where is the cost of generating power from ith generating plant units at tth time interval [(t-1)T,tT]. The design variables for the optimization problem are the vector which tells about the number of units to be generated by the ith thermal plant over each tth time interval.
The equality constraint depicting balance of supply and demand is given by:
∑ ∑
This equation can be written as:
∑ ∑ (2)
The ramp rate limits are the inequality constraints and are written as:
can be written as two inequality constraints:
[
]
(3)
The inequality constraints are written in the standard form:
2.2 Additional Constraints
In addition to ramp rate limits, the DED problems considered in this paper has a spinning level and group constraints. The spinning level is the extra power that needs to be generated (more than the required demand) by each generator so that load variation and failure of some generators can be easily tolerated. The spinning reserve of generators is proportional to the generation level below a defined output known as the Spinning Reserve Level (SL) and equal to the spare capacity above SL (Figure 2). Mathematically,
{ }
Another type of constraint, called as the group constraint, wherein different generators combine output is limited by certain bounds. This may be due to the following reasons [1, 2, 12]:
1. Transmission line limitations 2. Regulatory restrictions 3. Area security considerations
Figure 2. Spinning Reserve Contribution
3. Solution Technique
The PSO is a population-based stochastic optimization procedure which drew its inspiration from the social conduct of fish schooling or bird flocking [13]. This method and the evolutionary computation processes including Genetic Algorithms (GAs) are alike in many ways. The system sets out with a population of arbitrary solutions and forages for optima through the updating of generations. However, unlike GAs, PSO is devoid of evolution operators such as crossovers and mutations. In a PSO setting, the possible solutions (known as particles) soar through the problem area by staying on the heels of the existing optimum particles [14].
PSO forages for optimal answers to the problem through interaction with individuals in the swarm. A particle comprises two components; position and velocity. Position denotes the objective variable while velocity is the extent of the step a particle endeavours to take in the subsequent turn. A particle corresponds to a potential or candidate answer to the problem. The particles are tasked with the search for solutions in the multidimensional problem area in compliance with two major functions; their velocity and the adapted rules of position updating. Every particle progresses towards the optimal point through the increment of velocity to its position. Updating rules of position is the primary role of PSO with respect to the d-th dimension. Once population size is decided, the first step in PSO is to generate random population within the specified values of the design variables. The algorithm given here is taken from Arora [15]. Let x be a vector of design variables that need to be determined. Then, the position of the kth individual in the population is given by:
(4)
Where xmin and xmax are the variable bounds and u is a uniform distributed random number between 0 and 1. In the next step, fitness of kth individual is computed for the ith iteration as:
The minimum of the function obtained so far by each particle is given by pbest as:
( )
(6)
The global best for the group is given by gbest as:
( ) (7)
Let the position of pbesti,k and gbestiis given by pxik and gxi. In the next step of PSO, velocity of the particle is computed as:
( ) ( ) (8)
where vi,k is the velocity from the previous iteration (in the first iteration it set to zero). The tuning factors of the algorithm are given by w-1, φ-1 and φ-2. In the final step, position of the individual in the population is updated as:
(9)
In case the new position xi+1,k is not within the desired bounds, a new value of xi+1,k is generated using:
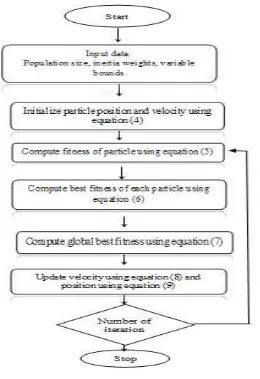
This last equation completes an iteration of the PSO. The steps are repeated a finite number of times as desired by the user. A flow chart depicting different steps of PSO is shown in Figure 3.
A penalty function approach is followed in handling constraints. Using penalty function approach, a constraint optimization problem is converted into an unconstraint problem [15-16]. The modified objective function with penalty terms is written as:
∑ ∑ (10)
where is a penalty parameter and the function:
[ ] (11)
In the next step, is computed for each population point in the search space. Subsequently, the rest of the procedure of PSO remains same as described earlier.
4. Case Studies
In order to evaluate the performance of the PSO algorithm, three DED problems are taken from the literature [3]. These problems are classified into simple and complex DED problems. In a simple problem (Case study-1), 10 generators are used to meet the demand which varies with time. The time duration is divided into six periods of 30 minutes each. The capacity of each generator is limited to a minimum and maximum values (Table 3). For example, generator-1 can operate between 12 MW and 73 MW. The ramp rate or the loading rate constraint is also defined for each generator. For example, generator-2 has a loading rate constraint of 1MW/minute. The power change in the next period can be ±30 MW (1×30=30MW). This means, if generator-2 is producing power say at 60 MW at a given time period, then in the next period (of 30 min), generator-2 power can be between 30 MW and 90 MW (60±30).
and overall cost is minimized. The rate at which generator power can be increased or decreased is limited by ramp rate constraint.
Figure 3. Flow Chart of PSO
Table 3. Input Parameters for Case-1
Generator No. Generation limit (MW) Loading rate
(MW/min)
Cost (units)
Initial generation (MW)
maximum minimum
1 73 12 1 18 12
2 93 26 1 15 26
3 143 42 1 16 42
4 70 18 1 20 18
5 93 30 1 19 30
6 350 100 4 17 100
7 248 100 4 11 248
8 190 40 2 10 190
9 190 70 2 14 70
10 113 40 2 12 60
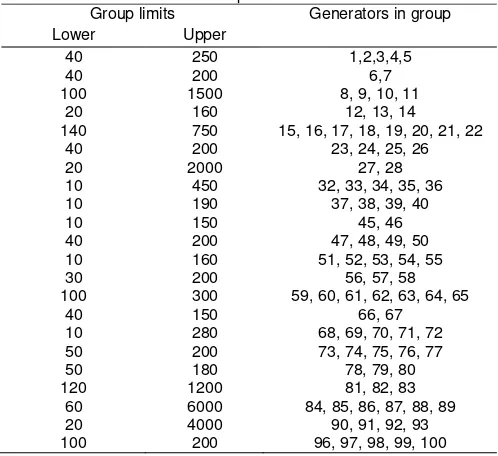
mentioned in Table A4. This particular problem has group constraints; where certain groups need to generate power between certain ranges. These details are given in Table A5.
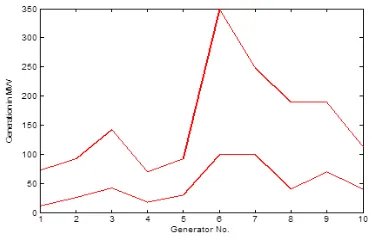
Figure 4. Power Generation Limits of Different Generators
Figure 5. Demand Variation with Time
5. Results and Discussion
The PSO algorithm is coded in the MATLAB [17] environment. For case study-1 (10 generators, 6 periods problem), there are sixty design variables that need to be determined by the optimizer. The total cost is minimized to 85011 units, and the convergence history is shown in Figure 6. Since a penalty function approach is followed in PSO, the function value is very large at the beginning as constraints are not met. The function value gradually reduces as more and more constraints are satisfied. The optimal values of the design variables are mentioned in Table 1.
Figure 6. Convergence of Total Cost to optimal and Feasible Solution with PSO
Method
Figure 7. Convergence of Function (Case Study 2)
The case study-1 was further studied where a period by period optimization was done. The optimal cost obtained is 85047 units, and optimal design variables are mentioned in Table 2. Further, in case-study-1, constraints were relaxed, resulting in an optimal cost to be 84552 units and optimal design variables are mentioned in Table 4.
Due to the large scale of the graph (on the y-axis) in Figure 7, the objective function appears to be zero at convergence but has a value of 99135.12 units. As for period by period for this 20 generator and 24 period cases, the solution which results in Sub-optimal solution, the total cost is 98843.06 units. The following Table 5 summarizes the findings for this case of 20 generators and 24 periods.
Table 4. Infeasible Dispatch (Neglecting Ramp Rate Constraints)
Generator Period-1 Period-2 Period-3 Period-4 Period-5 Period-6
1 12 12 12 12 12 16
Table 5. Results of PSO Method: 20-Generator System and 24 Periods
No Solution Case Generation cost (p.u.)
1 Optimal 98836.58
2 Sub-optimal (Period-by–
period) 98843.06
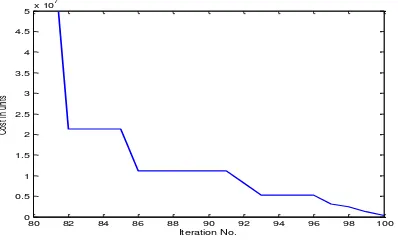
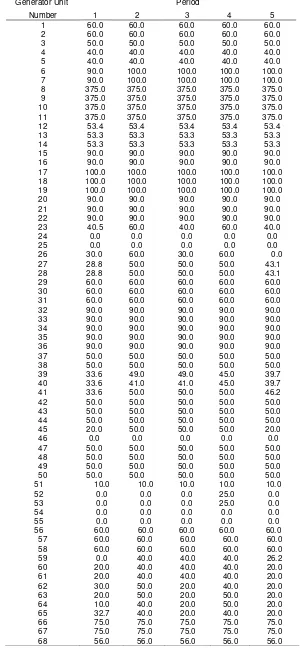
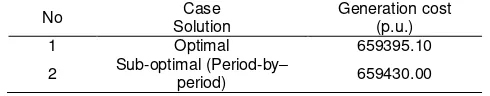
In case study-3, there are 100 generators and 5 periods. This results in an optimization problem where 500 (100 x 5) variables are to be evaluated. In addition to loading constraint, this problem has spinning level constraints. The 500 variables problem is solved using the PSO method. The total cost is minimized to 659395.1 units as shown in Table 6, and the convergence history is shown in Figure 8. As for the period-by-period case, the PSO solution gives Sub-optimal cost of 659430 units as shown in Table 7. Since a penalty function approach is followed in PSO, the function value is very large at the beginning as constraints are not met. The function value gradually reduces as more and more constraints are satisfied. Due to the large scale of the graph (on the y-axis) in Figure 8.
69 56.0 56.0 56.0 56.0 56.0
Period Number ON-Line Generation Cost PSO (u.c.) OPTIMAL
1 125393.20
Table 7. PSO method: 100 – generators 5 Periods - case
No Case dimensional economic dispatch optimization problems had 60, 480 and 500 design variables respectively. The ease with which PSO code can be modified for different problems (addition or deletion of constraints) shows the versatility of PSO method in addition to its accuracy.
Acknowledgements
gratefully acknowledge the funding support provided by the Ministry of Higher Education Malaysia under the research grant No: FRGS/2/2013/ TK02/FKE/01/F00167.
References
[1] Happ HH. Optimal Power Dispatch-A Comprehensive Survey. IEEE Transaction on Power Apparatus
System. 1977: 844-854.
[2] Hindi KS, Ab Ghani MR. Multi-Period Secure Economic Dispatch for Large Scale Power Systems. Generation, Transmission and Distribution, IEE Proceedings. C. 1989; 136(3): 130-136.
[3] Ab Ghani MR. Optimized Unit Commitment and Dynamic Economic Dispatch for Large Scale Power Systems. Ph.D. Thesis. United Kingdom: Department of Computation, UMIST; 1989.
[4] Bechert TE, Kwatny HG. On the Optimal Dynamic Dispatch of Real Power. IEEE Trans. Power
Apparatus Syst. 1972; 91: 889-898.
[5] Gaing ZL. Constrained Dynamic Economic Dispatch Solution Using Particle Swarm Optimization.
Proc. IEEE Power Engineering Society General Meeting. 2004: 153-158.
[6] Victoire TAA, Jeyakumar AE. Deterministically Guided PSO for Dynamic Dispatch Considering Valve-Point Effect. Electrical Power System Res. 2005; 73(3): 313-322.
[7] Chakrabarti R, Chattopadhyay PK, Basu M, Panigrahi CK. Particle Swarm Optimization Technique
for Dynamic Economic Dispatch. IE(I) Journal-EL. 2006; 87: 48-54.
[8] Chowdhury A, Zafar H, Panigrahi BK, Krishnanand KR, Mohapatra A, Cui Z. Dynamic Economic
Dispatch Using L-best PSO with Dynamically Varying Sub-swarms. Memetic Computing. 2014; 6:
85-95.
[9] Chaturvedi KT, Pandit M, Srivastava L. Particle Swarm Optimization with Time Varying Acceleration
Coefficients for Non-convex Economic Power Dispatch. Electrical Power and Energy Systems. 2009;
31: 249-257.
[10] Lim SY, Montakhab, Mohd Nouri H. Economic Dispatch of Power System Using Particle Swarm Optimization with Constriction Factor. International Journal of Innovations in Energy Systems and Power. 2009; 4(2): 29-34.
[11] Zhao B, Yi-jia C. Multiple objective particle swarm optimization technique for economic load dispatch.
Journal of Zhejiang University SCIENCE A. 2005; 6(5): 420-427.
[12] Kennedy J, Eberhart RC. Particle Swarm Optimization. Proceedings of IEEE International
Conference on Neural Networks, (ICNN‟95). Perth, Australia, 1995; 4: 1942-1948.
[13] Kumar AIS, Dhanushkodi K, Kumar JJ, Paul CKC. Particle swarm optimization solution to emission
and economic dispatch problem. In TENCON. Conference on Convergent Technologies for the
Asia-Pacific Region. 2003; 1: 435-439.
[14] Faheemullah Shaikh, Pervez Hameed Shaikh, Mushtaq Mirani, Mohammad Aslam Uqaili, Multi Criteria Optimization Algorithm for Economic Dispatch Complications for Sustainable Interconnected
Power System. International Journal of Computer Applications. 2012; 50(4).
[15] Arora RK. Optimization: Algorithms and Applications. CRC Press. 2015.
[16] Victorie TAA, Jeyakumar AE. Reserve Constrained Dynamic Dispatch of Units with Valve Point
Loading Effect. IEEE Transaction on Power System. 2005; 20(3): 1273-1282.
Appendix (Ab Ghani, M.R., 1989 [3])
Table A1. Input parameters for the 20 generators DED problem
Generator No. Generation limit (MW) Loading rate
(MW/hr)
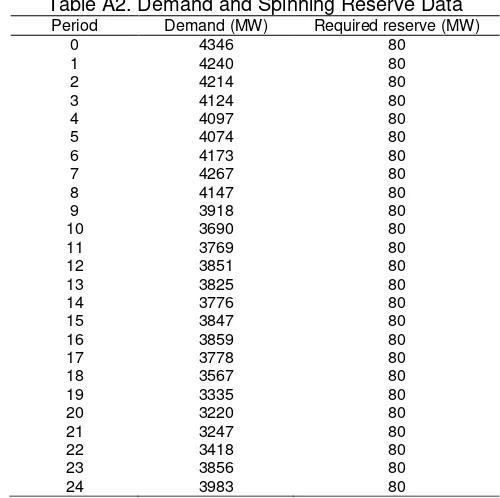
Table A2. Demand and Spinning Reserve Data
Period Demand (MW) Required reserve (MW)
0 4346 80
Table A3. Input parameters for the 100 generators DED problem
Generator No. Generation limit (MW) Loading rate
86 50 10 60 180 19 46
Table A4. Demand and Spinning Reserve Data
Period Demand (MW) Required reserve