Faculty of Electrical Engineering
GREEN ENERGY MANAGEMENT SYSTEM (GreEMys)
Nabilah binti Mat Kassim
Bachelor of Electrical Engineering (Power Electronic and Drive)
GREEN ENERGY MANAGEMENT SYSTEM (GreEMys)
NABILAH BINTI MAT KASSIM
A thesis submitted
in fulfillment of the requirements for the degree of Bachelor of Electrical Engineering (Power Electronic and Drive)
Faculty of Electrical Engineering
UNIVERSITI TEKNIKAL MALAYSIA MELAKA
i
DECLARATION
I declare that this thesis entitled “Green Energy Management System” is the result of my own
research except as cited in the references. The thesis has not been accepted for any degree and is not concurrently submitted in candidature of any other degree.
Signature :………...
Student Name :………...
APPROVAL
I hereby declare that I have read this thesis and in my opinion this thesis is sufficient in terms of scope and quality for the award of Bachelor of Electrical Engineering (Power Electronic and Drive).
Signature :………...
Supervisor Name :………...
iii
DEDICATION
ABSTRACT
v
ABSTRAK
ACKNOWLEDGMENTS
First and foremost, thanks to Allah for giving me this healthy body that enables me to devoted to the community as well as gaining new knowledge, experience and able to finish this report in the frame of time. Nothing can be done except with the permission of Allah.
I would also like to express my deepest appreciation to all who involved in this Final Year Project especially to my supervisor Dr. Abdul Rahim bin Abdullah and my co-supervisor Encik Hazriq Izzuan bin Jaafar. I am highly indebted to Universiti Teknikal Malaysia Melaka for giving me the opportunities to pursue my Bachelor in Electrical Engineering (Power Electronic and drive)
vii 2.4.2 Battery Measuring Method 7
2.4.3 Efficiency of Battery 10
2.5 Arduino 11
2.6 Review of Preview Related Works 12
TABLE OF CONTENT
3.5 Hardware Implementation 30
3.6 Milestone 30
4.5 The Performances of GreEMys 38
5.0 CONCLUSION AND RECOMMENDATION 45
5.1 Conclusion 45
5.2 Achievements 45
5.3 Recommendation 46
REFERENCE 47
ix
LIST OF TABLE
TABLE TITLE PAGE
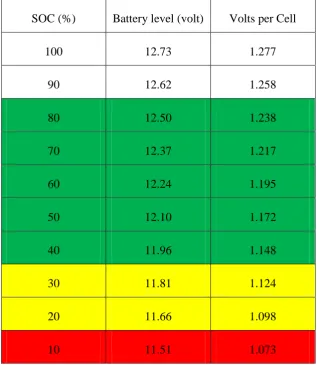
2.1 The approximate of SOC and voltage per cell by using specific gravity method.
10
4.1 The status mode of power supply depends on SOC condition while battery is discharge.
38
4.2 The status mode of power supply depends on SOC condition while battery is charge.
LIST OF FIGURE
FIGURE TITLE PAGE
2.1 The electricity network illustration tie into house 5
2.2 The basic home solar system 6
2.3 The illustration for the SOC of battery 7 2.4 Acid specific Gravity and charge level 8 2.5 Open circuit voltage versus remaining capacity and specific gravity
method
9
2.6 Four Start Backup 4400 12
2.7 The Toshiba eneGoon Backup Power Supply 13 2.8 (a) Victron Energy Solar Switch (b) Schematic system for setup
(c) Schematic wiring for Victron Energy Solar Switch
14
2.9 The topology of the switching control the solar PV system with tie utility system
15
3.1 The methodology of the project 17
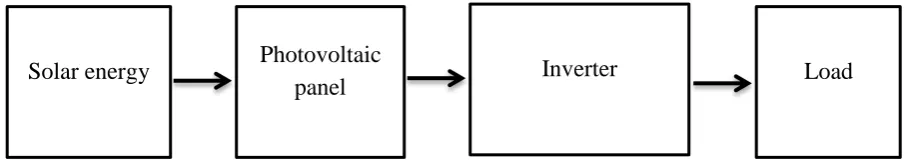
3.2 Block diagram of the project 18
3.3 Proteus software 19
3.4 The flow chart of the design circuit 20
3.5 Proteus simulation testing 21
3.6 Import .hex file 22
3.7 The Arduino software 23
3.8 The flow chart of the management power system 24
3.9 OrCAD software 25
3.10 Flow Chat of PCB design 26
3.11 Schematic capture through the electronic design 27
xi
LIST OF FIGURE
FIGURE TITLE PAGE
3.13 Voltage divider 28
3.14 The current sensor BB- ACS 756 29
3.15 The illustration of interface the GreEMys with power supplies 30 4.1 Display properties on screen 31 4.2 Display properties of mode power supply 32 4.3 Display properties of voltage from battery 32 4.4 Display properties of SOC from battery 33 4.5 The PCB and Arduino microcontroller 34 4.6 The electric and electronic component inside the box 34 4.7 The contactors are inside the box. 35 4.8 The PCB board with the arduino inside the box. 35 4.9 The situation while the reading taken. 36 4.10 The actual reading between calculation for current and voltage. 37 4.11 The percentage error of SOC when Discharge. 41 4.12 The percentage error of SOC when Charge. 40 4.13 Data collected on the Arduino in serial print. 42
4.14 The digital battery analyzer. 42
4.15 The implementation of the project. 43
LIST OF APPENDIX
APPENDIX TITLE PAGE
A Gantt chat of the project. 50
B Datasheet of battery 12V 7.2Ah 51
C Datasheet of battery 12V 100Ah 53
D Datasheet for Current Sensor 55
E Percentage of Turnitin 56
F Participation at I-ENVEX (2014) 57
1
CHAPTER 1
INTRODUCTION
1.1 Project Background
There are many reasons why people are now using Renewable Energy (RE) due to inexhaustible and pollution free renewable energy sources. For instance, solar energy attributes high durability and need no fuel. It is able to operate for lengthened period without maintenance. Therefore, solar energy is the best RE until now. The development and the use of RE have drawn extensive attention of the society. Thus, RE will be an additional source for recover the electricity usage in the home to reduce the electricity bill. Solar energy has far been considered the most easily and viable option. These make it economical for all types of applications of remote area.
1.2 Problem Statements
Moreover, Online UPS also contains of converter, battery, inverter and fast static switch. Power to load is catered through conveter-inveter connection. Hence, converter should have capability to charging battery and supply load. This type of UPS is connected in series to load. Thus, this system is not the way for reduce power usage inside building but it will increase the bill that to be paid. Therefore, this project is developed as a management the power supply for user to reduce the cost of energy consumption. Through this system, it will automatic manage the power supply as a green energy is primary resources and TNB power supply as standby source while the battery is running out for reduce power consumption and also to optimize the used of battery.
1.3 Objectives
The objectives of this project are:
i. To develop an automatic management power supply from TNB or Renewable Energy (RE).
ii. To control the system based on state-of- charge (SOC) of battery (limit to 30%).
1.4 Scopes
The scopes of the project are:
i. This project only for single phase power supply.
ii. Supply voltage is 240 Volt with current rating 30 Ampere.
iii. This project measure the voltage and state of charge level on a battery that charge from the photovoltaic system.
3
1.5 Report Outline
This report contains of five (5) chapters start with the introduction chapter that consists of brief explanation of the research which is Green Energy Management System (GreEMys) and why it is proposed. The objectives, scope and the significant of the research also presented in this chapter. Other chapters in this report are arranged as follow:
CHAPTER 2 discuss about the literature review for this research. This chapter is including an explanation about the utility system, RE, SOC of battery and previous project. The various types of selector of power supply topologies and measurement of the SOC for battery also will be described in this chapter.
CHAPTER 3 discuss about the methodology for this project. All the methods used in accomplishing this research are explained and all the flowchart and milestone are presented in the earlier section of this chapter. The concept of GreEMys also will be discussed in details with the help of particular flow chart, figure, and block diagram. The diagram of circuit and implementation of hardware also will be presented.
CHAPTER 4 gathered all the results get from the testing of the circuit and coding are taken for analysis. The result gathered is discussed in details in this chapter.
CHAPTER 2
LITERATURE REVIEW
2.1 Introduction
This chapter will be discussed regarding on literature review conducted in order to gain enough information that can be used to complete the research. All the data are included in this chapter are taken from journals, thesis, books and any academic articles that are related to the research topic and will be clearly cited. The National Energy knowledge, solar system installation and calculation SOC of battery are discussed in subsequence so that it can be clearly understood. The related previous work such as Uninterruptible Power Supply (UPS) system also presented.
2.2 National Energy
5
Figure 2.1: The electricity network illustration tie into house.
2.3 Renewable Energy (RE)
RE is a source comes from naturally such as biomass, biogas, solar, wind and mini-hydro. Malaysia is well rich natural resources due to an extremely moderate climate around the years. Most of these energy resources are yet to be exploited. Thus, RE technology could be the alternative source for the energy production include water (hydroelectric and marine energy), solar (thermo and photovoltaic), wind (single turbine or wind field), Geothermic sources and biomass. Geographically, Malaysia is located at the equator and solar energy resources are abundant and readily available for this project [1].
2.3.1 Photovoltaic (PV) Power System
Figure 2.2: The basic home solar system.
2.4 Energy Storage
Energy can be store into battery by holding difference electro-chemical active materials. Therefore, battery can be generated and stored free electrons for a long periods of time. Existing of the chemical inside the battery allows battery to store energy chemically as bi-product of a chemical reaction. Since electrical charge has a polarity, a battery also contains positive terminal (+ve) and negative terminal (-ve). If it polarity is opposite of its own polarity, the charge at battery will try to travel towards the polarity [4].
2.4.1 Battery for Solar Energy
Lead-Acid Battery is chosen to store energy from PV panel for this project. It calls Lead-Acid Battery because the electrode and grids are made from lead and the electrolyte is sulfuric acid. The plate polarity is determined by an active material from some formulation of lead oxides. It is because an active material is placed in physical contact with the grid. Basically, the most common purpose of battery is to start an engine. It is use to energize the starter motor that turns on internal combustion engine. Second, the battery used as stand-by-mode waiting to provide backup power for substation. Third is a deep-cycle application such as the battery can deliver the majority of its capacity repeatedly, possibly on a daily basis. Typically use for Electric Vehicle (EV) application is like a combination of engine start and deep-cycle. Therefore, deep-cycle is suitable for this solar system while charge and discharge sequence are do rapidly [8].
Solar energy Photovoltaic
7
2.4.2 Battery Measuring Method
The lead-acid battery is widely used in stand-alone solar power systems. For reliable operation for this GreEMys system, it is importance to know the amount of battery remaining in the battery at any point of time. The life of the battery will be reduced due to the deep cycle. Damaging effect is also happened to battery while the battery frequent overcharging. Thus, it is necessary to indicate the State of Charge (SOC) of battery to utilize the battery.
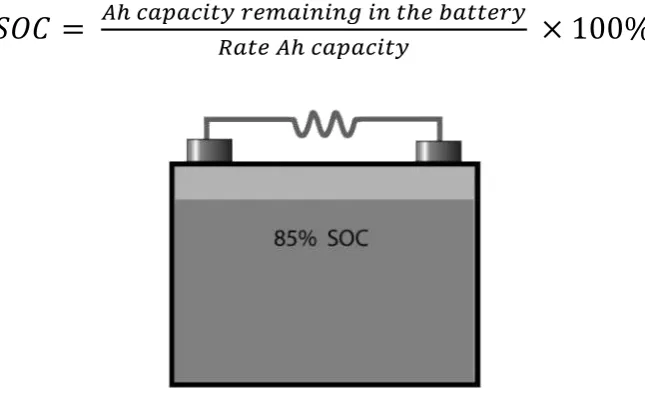
SOC of battery indicates the amount of available energy expressed as the percentage of the rated energy. The SOC of the battery is between 0% and 100%. The SOC for fully charged battery is 100% and for an empty battery is 0%. The variation in the battery voltage is very small [3]. Hence SOC can be expressed by the available capacity (AHr) as the percentage of the rated capacity (AHr).
(2-1)
Figure 2.3: The illustration for the SOC of battery.
A. Specific Gravity Method.
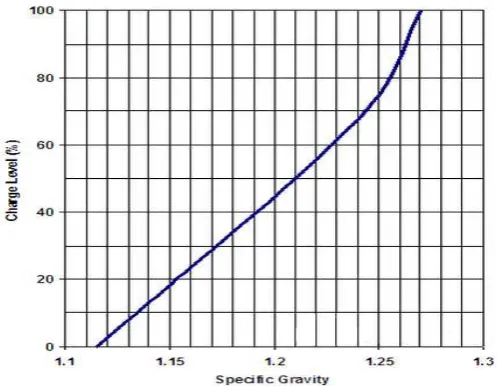
For this method, give the concentration of acid in electrolyte. The concentration of active material and the active material is consumed when the battery discharged. Available capacity of the battery by using specific gravity method can be obtained in direct indication. The measurement of this method is involved by removing the electrode from the battery. The acid specific gravity and charge level is indicated in the Figure 2.4. According to the graph, it show that overcharged for specific gravity is above 1.3 per cell and very low capacity from 1.13 until 1.15 per cell while discharged for specific gravity is below than 1.12 per cell.
Figure 2.4: Acid Specific Gravity and charge level.
B. Open Circuit Voltage
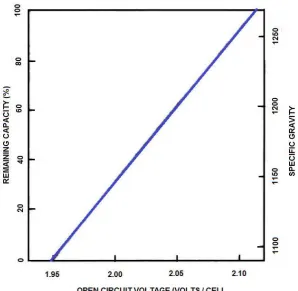
This method is concentration of acid near electrodes. The SOC of this method is linear function of the open circuit voltage. The length stabilization method time is same with specific gravity method. Refer to Figure 2.5, 2.10 volts/cell is considered to be fully charge and completely discharge when voltage is 1.95 volts/cell. Thus, variation of open circuit voltage is linear to the SOC of battery [3]. SOC can be calculated by using the relation below (2-2) where, Voc is the open circuit voltage of the cell.
9
Figure 2.5: Open circuit voltage versus remaining capacity and specific gravity method.
C. Current Integration Method
It is a process of summing the amount of capacity taken from current flowing or out of a battery. Integration method for this current over time is in order to determine the battery capacity [3]. The integration of current is referred as Coulomb counting can be mathematically represented as:
∫
(2-3)
2.4.3 Efficiency of Battery
Table 2.1 shows the limitation of SOC for charge and discharge battery. It is importance to care life span and efficiency of battery. For longest life, limitation for battery discharge should stay in the 40% of SOC and above. Sometime near to 30% or 20% of SOC are not harmful, but continuously discharge until these levels will be shortening battery life considerably. If the batteries discharge until 10%, it will harm the battery. The voltage measurements are only approximate but the best to determine the SOC is by using specific gravity method [5].
Table 2.1: The approximate of SOC and voltage per cell by using specific gravity method.