POWER PARAMETERS MONITORING SYSTEM
Siti Syahirah Binti Abdul Mutalib
Bachelor of Electrical Engineering
(Industrial Power) with Honours
“I hereby declare that I have read through this report entitle “
Power Parameters Monitoring
System” and foun
d that it has comply the partial fulfilment for awarding the degree of
Bachelor of Electrical Engineering (Industrial Power)”
Signature
:
……….
Supervisor‟s Name
:
Dr. Abdul Rahim Bin Abdullah
POWER PARAMETERS MONITORING SYSTEM
SITI SYAHIRAH BINTI ABDUL MUTALIB
A report submitted in partial fulfilment of the requirements for the degree of
Bachelor of Electrical Engineering (Industrial Power)
Faculty of Electrical Engineering
UNIVERSITI TEKNIKAL MALAYSIA MELAKA
“I declare that
this report entitle
“Power Parameters
Monitoring System”
is the result of my
own research except as cited in the references. The report has not been accepted for any
degree and is not
concurrently submitted in candidature of any other degree”.
Signature
:
……….
Name
:
Siti Syahirah Binti Abdul Mutalib
ACKNOWLEDGEMENT
In the name of Allah, Most Gracious, Most Merciful. Peace and blessings
be upon Prophet Muhammad, son of Abdullah Muhammad, the holy family and
his companions selected.
First of all, I am grateful, with His blessings and grace, giving me a
strength and spirits to fulfil and completing this project. This project could not be
accomplished without a help from my family, colleagues, lecturers and most of
all, my supervisor. I would like to take this opportunity to express my gratitude to
some of them.
Millions thanks and appreciation goes to my supervisor, Dr. Abdul Rahim
Bin Abdullah, for his continuous encouragement and guidance. His generosity of
providing unlimited knowledge is very much helpful towards completing this
project. Without his support, this project might be incompletely successful.
Also, credit of appreciation goes towards all my lecturers of Faculty
Electrical Engineering for their knowledge shared, to all technicians and staffs
contributing in this project.
Finally, to my dear mother and father, sisters and brothers for their endless
support, prayers and loves. The inspiration and motivation given are invaluable
and unforgettable. To all my friends and those indirectly contributed in this
ABSTRACT
The growth of renewable energy as an alternative source of power supply
nowadays has been widely discovered and used. In fact, most consumers tend to
install one of the renewable energy that is known as solar photovoltaic. This solar
PV is installed in their houses and also industrial sectors since government had
introduced and providing the subsidy funding via Feed-in-Tariff (FiT). The solar
photovoltaic has a feature that the energy stored by solar supply into the battery is
decreasing at anytime. Therefore, a monitoring system need to be developed in
order to measure power consumption based on the type of source currently in use,
either main grid utility or solar supply. In this project, a system for monitoring the
performance of green energy is developed with an appropriate measurement of
power line. The information and data collected are obtained by monitoring
parameters including voltage, current, frequency, active power, reactive power,
apparent power and the power factor. The entire system is designed with the
implementation of data acquisition (DAQ card), personal computer (PC) as well
as the utilization of Visual Basic 2010. Visual Basic 2010 is used to display the
data via graphical user interface (GUI) development. The user-friendly software
is developed in terms of managing and controlling the system via interface
designed. A laboratory testing is conducted to determine system performance
after the combination of software and hardware prior practically applied. At the
end of this project, the monitoring system are used and applied especially in
residences and industrial sector in order to enable the measurement on
ABSTRAK
Pembangunan tenaga boleh diperbaharui sebagai sumber alternatif bekalan kuasa
pada masa kini telah ditemui dan digunakan secara meluas. Malah, kebanyakan
pengguna telah mulai cenderung untuk memasang salah satu tenaga boleh
diperbaharui dikenali sebagai solar photovoltaic (PV). Solar PV ini dipasang di
kediaman dan juga sektor-sektor industri setelah kerajaan memperkenal dan
menyediakan
pembiayaan
subsidi
melalui „Feed
-in-
tariff‟ (FiT).
Solar
PV
mempunyai cirri iaitu tenaga yang disimpan daripada tenaga solar ke dalam bateri
akan berkurangan pada bila-bila masa. Oleh demikian itu, satu sistem pemantauan
perlu dibangunkan untuk mengukur penggunaan kuasa berdasarkan jenis bekalan
kuasa yang sedang digunakan pada ketika itu, sama ada bekalan kuasa utama
(TNB) ataupun bekalan kuasa solar. Dalam projek ini, satu sistem untuk
memantau prestasi tenaga hijau telah dibangunkan dengan pengukuran yang
sesuai untuk parameter talian kuasa. Maklumat dan data yang dikumpul
diperolehi
dengan
memantau
parameter-parameter
termasuk
voltan,
arus,
frekuensi, kuasa aktif, kuasa reaktif, kuasa ketara dan juga faktor kuasa. Sistem
keseluruhan
telah
direka
dengan
pelaksanaan
perolehan
data
(kad
DAQ),
komputer peribadi (PC) serta penggunaan Visual Basic 2010. Visual Basic 2010
digunakan
untuk
memaparkan
data-data
melalui
pembangunan
antara
muka
pengguna grafik (GUI). Perisian mesra pengguna dari segi menyusun dan
mengawal sistem dibuat melalui antara muka. Pengujian makmal dijalankan bagi
menentukan prestasi sistem selepas gabungan perisian dan juga perkakasan
sebelum digunakan secara praktikal. Di akhir projek ini, sistem pemantauan ini
akan digunakan dan diaplikasikan terutamanya di kediaman dan juga sektor
TABLE OF CONTENTS
CHAPTER TITLE
PAGE
ACKNOWLEDGEMENT..……….………...
i
ABSTRACT
...………...
ii
ABSTRAK...……….………...
iii
TABLE OF CONTENTS
…………...………...……...
iv
LIST OF TABLES
………...….……..
vii
LIST OF FIGURES
…………...……….…….
viii
LIST OF
APPENDICES....…...……….…….
xi
CHAPTER
1
INTRODUCTION
1
1.1
Research Background……….………...
.
…
...
…
1
1.2
Problem
Statements...………
..
……
.
…
...
3
1.3
Objectives of the Project...………
...
…..
...
…
.
4
1.4
Scopes of the Project………
...
…
..
4
2.1
Overview....………
..
………
....
7
2.2
Research on Monitoring Systems………
..
…
.
….
8
2.3
Visual Basic 2010...……….
12
2.4
Data Acquisition………..
14
2.4.1
Interfacing using NI USB 4009………
...
14
2.5
Summary of Literature Review..
………
...
…
16
3
RESEARCH METHODOLOGY
17
3.1
Overview...
17
3.2
Project Development Process Step...
…
....
17
3.2.1 Software Development...
21
3.2.2 Hardware Development...
23
3.2.2.1 Voltage Divider Application...
24
3.2.3 Software and Hardware Combination...
26
3.3
Power Line Measurements...
...………
.
…..
27
3.3.1 Voltage Measurement...
27
3.3.2 Current Measurement...
28
3.3.3 Active Power Measurement...
28
3.3.4 Reactive Power Measurement...
29
3.3.5 Apparent Power...
29
3.3.6 Power Factor...
29
3.3.8 Fourier Transform...
30
3.3.9 Power Consumption...
30
4
RESULT, DISCUSSION AND ANALYSIS
31
4.1
Overview...
31
4.2
Systems
Result………
..
………
.
………
31
4.2.1 Solar Supply Waveform Graphs...
33
4.2.2 TNB Power Line Waveform Graphs...
34
4.2.3 Solar and TNB Power Consumption...
36
4.2.4 Solar and TNB Measurement Parameters...
37
4.2.5 System Tools... 37
4.2.6 Recorded and Stored Data... 38
4.3
System Functionality Test..
………
..
…..
39
4.4
Performance Analysis of the System... 41
5
CONCLUSION AND RECOMMENDATION
53
5.1
Overview...
53
5.2
Conclusion...………
....
……
.
……….…..
53
5.3
Recommendations...
54
REFERENCES
56
LIST OF TABLES
TABLE
TITLE
PAGE
Table 3.1
Summarization of project development step
20
Table 4.1
Power Consumption of Solar and TNB Power Supply
39
Table 4.2
Comparison of TNB voltage between Power Parameters
Monitoring System and Fluke meter
43
Table 4.3
Comparison of solar voltage between Power Parameters
Monitoring System and Fluke meter
44
Table 4.4
Comparison of TNB current between Power Parameters
Monitoring System and Fluke meter
45
Table 4.5
Comparison of solar current between Power Parameters
Monitoring System and Fluke meter
46
Table 4.6
Comparison of TNB active power between Power Parameters
Monitoring System and Fluke meter
49
Table 4.7
Comparison of solar active power between Power Parameters
LIST OF FIGURES
FIGURE
TITLE
PAGE
Figure 1.1
Solar photovoltaic installed on the rooftop
3
Figure 1.2
System Block Diagram
5
Figure 2.1
Wireless monitoring on solar panel performance concept
8
Figure 2.2
Experimental Set-Up for Standalone PV
9
Figure 2.3
Photovoltaic module performance monitoring system
block diagram
10
Figure 2.4
Experimental test rig
11
Figure 2.5
Signal/Data transferring between DAQ device and computer
14
Figure 2.6
Data acquisition NI USB 6009
15
Figure 2.7
NI USB 6009 pinout
15
Figure 3.1
Flowchart of overall project methodology
19
Figure 3.2
Flowchart of Software Development
21
Figure 3.3
Main Form of Monitoring System Software Development
22
Figure 3.4
Flowchart of Hardware Development
23
Figure 3.5
Block Diagram of Voltage Divider Application
25
Figure 3.6
Interface of Software and Hardware Combination
26
Figure 4.3
RMS Voltage and Current
33
Figure 4.4
Solar Power Spectrum
33
Figure 4.5
Solar Average Voltage and Current
33
Figure 4.6
Solar Active, Reactive, Apparent and Power Factor
33
Figure 4.7
TNB RMS Voltage and Current
34
Figure 4.8
TNB Power Spectrum
35
Figure 4.9
TNB Average Voltage and Current
35
Figure 4.10
TNB Active, Reactive, Apparent and Power Factor
35
Figure 4.11
Solar and TNB Power Consumption Waveform (kWh)
36
Figure 4.12
Solar and TNB Measurement Parameters
37
Figure 4.13
System tools
37
Figure 4.14
Record and Storage Data in Notepad
38
Figure 4.15
Solar and TNB Power Consumption Line Graph
41
Figure 4.16
Measurement Tools for Analyzing System Performance
42
Figure 4.17
RMS Voltage and Current Verification for TNB
47
Figure 4.18
RMS Voltage and Current Verification for Solar
47
Figure 4.19
TNB Active Power Verification
51
CHAPTER 1
INTRODUCTION
1.1
Research Background
Electricity supply nowadays is not strictly focused on the main grid utility.
In fact, the electrical sector handling the power supply has discovered various
types of energy sources that could contribute as alternative electricity supply
known as Green Energy (G.E). It is known so as its characteristics of the energy
are free of environmental pollution and also a non-harmful energy that would not
give any bad impact of its surroundings. Green energy holds the facts that it is
different compared with current generated energy used nowadays that mostly
fossil fuel generated electricity including coal, oil and so on.
With the facts that these source of energy may soon be run out, it cause
that these energy becoming more expensive. Researchers around the world started
their finding of alternative energy sources including Malaysian government. A
few types of energy wer
e selected as this country‟s alternative energy
including
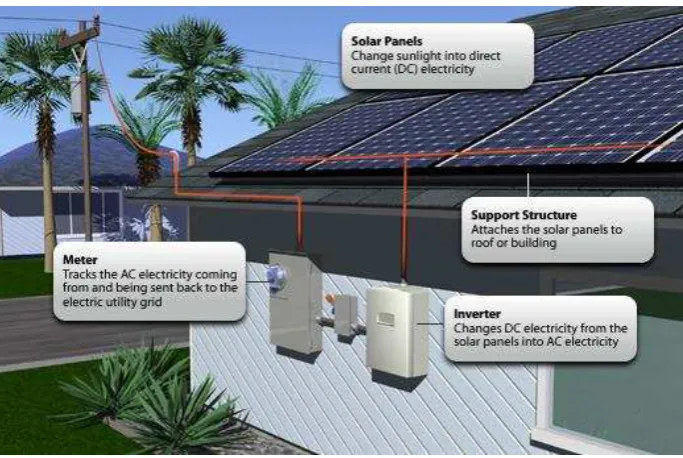
solar photovoltaic (PV). Solar photovoltaic energy is one of the most abundant
resources, widely distributed, renewable and does not pollute the environment [1].
Malaysian
government
had
encouraged
the
renewable
energy
usage
including solar photovoltaic installation. This is done by giving out an incentive
known as Feed-in-Tariff (FiT) depending on amount of power consume per
month. The development of renewable energy in this country is been made by the
government with involvement from Sustainable Energy Development Authority
Malaysia, SEDA as an Advisor in all matters relating to sustainable energy [2].
them of having an optimum capacity of energy being stored. Since solar energy
depends on the expected time dependence of solar radiation availability and other
factor, it causes the solar PV having an optimum capacity of the energy storage
[3]. Once the electrical energy produced by solar PV become lower due to the
reaching of their maximum point, electrical energy from power line will take over
the electricity supply. The public are already aware of the advantages of applying
GE in their daily lives and they had started to have an expert to consult and
installing solar PV at their residences and in industry as well.
A monitoring system of this solar PV is needed and compulsory to provide
information of solar PV and also main grid utility‟s performance. It would give
adequate information to consumers to let them acknowledge an amount they
could save by using solar PV. Hence, this project had been developed to measure
and monitor the power line parameters including voltage and current that also
lead to a measurement of power (Watt), apparent power (VA), reactive power
(Var), power factor (pf), frequency (Hz) as well as the power consumption (kWh)
in both solar PV and utility grid power line.
The significant of all parameters stated to be monitored is to facilitate
consumers with easy and self-monitored power consumption. According to SEDA
[2], the average time of solar photovoltaic generation is 3.5 hours per day
depending on the weather condition. Hence, with this monitoring system,
consumers will be able to identify their total power consumption daily instead of
monthly referring to the electricity bills. This will also help them in predicting
Figure 1.1 : Solar photovoltaic installed on the rooftop
1.2
Problem Statements
The use of solar energy in terms of renewable energy has been
emphasized in most of the country. The output of photovoltaic (PV) solar systems
varies
instantaneously
with
changes
in
radiation
[4].
Stand
alone
solar
photovoltaic as known as off-grid solar system store the energy by using batteries.
The energy stored or currently supplied to the consumers would decrease as the
unavailable of the sun and the energy stored might run out at any time. Previous
up to present days, people used to monitor and record the signal captured from
solar power line manually by using digital multimeter and record the reading.
This would cause an error and inaccurate reading taken and the data analyze using
waveforms is inappropriate.
Furthermore, the equipments used in obtaining the data are not
well-monitored and have inappropriate data storage. A lot of studies found that
monitoring system in solar energy is essential to improve the performance of
energy supplied. However, these researcher‟s findings mostly focuses on large
scale solar power plant [5]. Solar photovoltaic installations in recent days are
power consume in real time per month will not be constant as a change in the
weather including environmental affect [1]. Thus, the idea of this monitoring
system is developed so that consumers could self-monitor power line parameters
in order to determine their power consumption in both power supplies
accordingly.
1.3
Objectives of the project
There are several objectives that need to be achieved in order to achieve
the aim of this project:
i.
To develop a monitoring system that can measure power line
parameters from solar photovoltaic (PV) supply as well as main grid
utility (TNB) power line.
ii.
To design user-friendly graphical user interface (GUI) with Visual
Basic 2010 application.
iii.
To verify the performance of the monitoring measurement in terms
of accuracy.
1.4
Scopes of the project
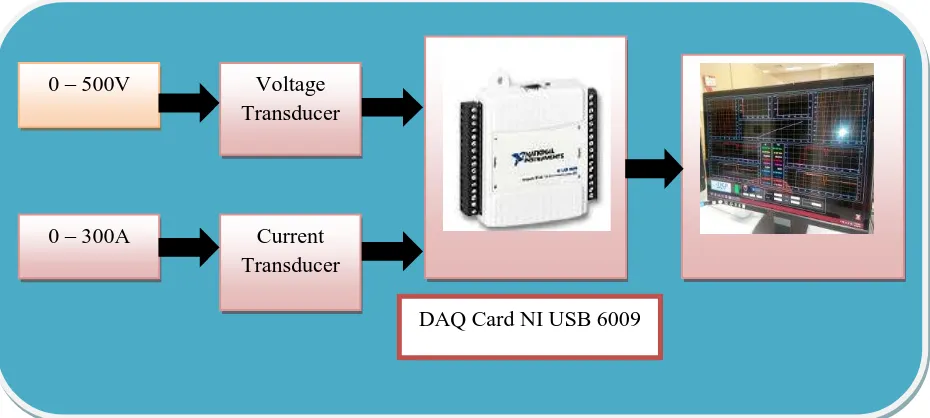
This project is developed by utilizing NI USB 6009 DAQ Card and also
Visual Basic 2010 program. The scope of this project consists of:
1.
This system is built by using Microsoft Visual Basic 2010 software and
data acquisition card, NI USB 6009 (DAQ Card).
2.
This system can measure and monitor power line parameters including
voltage (rms and average), current (rms and average), frequency, active
power, reactive power, apparent power, power consumption and also
3.
Voltage and current signals are measured between 0 to 500 V (rms) and 0
to 300 A (rms) for single phase power line.
The data measured are then will be recorded and stored in the computer.
Figure 1.2 : System Block Diagram
1.5
Thesis Outline
Chapter 2
:
Literature Review
In this chapter, the content is aiming in reviewing the idea and also the
understanding about solar monitoring system. Previous researches relating
to monitoring system also studied and summarized. Also, the equipments
involved are discussed.
Chapter 3
:
Methodology
In chapter 3 which is methodology, several approaches and procedures are
discussed. It is including the development process step, flowchart of
overall project as well as software and hardware development. Many
aspects are taken into account in order to achieve the objectives and
completing this project successfully.
0 – 500V0 – 300A
Voltage Transducer
Current Transducer
The analyzed results and performance data verification of this project are
discussed in this chapter. The program is built and written by using Visual
Basic 2010 and simulated. It is then interfaced by DAQ Card, NI USB
6009 to be linked with the hardware part. Prior conducting test with
hardware part, the system is simulated in the computer. After that, the
testing on system functional and system performance analysis are carried
out.
Chapter 5
:
Conclusion and Recommendation
In this chapter, the whole project are summarized and concluded together
including
several
considerations
and
recommendations
for
future
development. Basically, the objectives of this project are achieved. This
project will help user by providing them with information of monitored
CHAPTER 2
LITERATURE REVIEW
2.1
Overview
This chapter will cover on the previous research finding of power
parameters monitoring systems used to monitor signal parameters from solar
energy mainly in photovoltaic (PV) solar. There are several methods that
researcher‟s had developed
to be applied in monitoring the signals. As in this
project, the Visual Basic 2010 version is applied to display the monitored data.
The use of data acquisition is also necessary in order to process a measurement of
electrical parameters that are voltage, current, frequency, active power, reactive
power, apparent power as well as the power factor. The type of data acquisition
(DAQ card) used to feed the data into the PC also will be discussed further in this
chapter.
2.2
Researches on Monitoring Systems
The performance parameters of distributed solar panels has been measured
and monitored by applying Wireless Sensors Network as in article [5]. The
system is designed by the authors using the wireless sensor network together with
automated data logging computed in the laboratory. The system built by
understanding the characteristics of particular panel under various light conditions
to determined the performance of panel or an array of the panels. This is
accomplished by tracing the I-V characteristics under certain conditions. It is also
network by taking ZigBee communication as a medium of sending and receiving
data monitored.
Figure 2.1 : Wireless monitoring on solar panel performance concept.[5]
The
monitoring
system
has
also
being
developed
for
standalone
photovoltaic solar with monitoring parameters including average battery‟s
temperature, voltage and current [6]. These parameters are fed to the PC with
DAQ as an interface. The system is developed in order to quantify the potential
for performance improvement purpose in standalone photovoltaic (PV) solar
systems by creating the prototype of the systems. To create a standalone
photovoltaic (PV) system to be tested and simulated, the integration of personal
computer, data acquisition, a battery array and also solar array simulator (SAS)
are involved. In addition, LabVIEW software is utilized as a programming of the
inter-instrument communication which creating the graphical user interface (GUI)
for data acquisition (DAQ) as well as the solar array simulator (SAS). The
experimental set-up for this research as shown in Figure 2.2 below with
Figure 2.2 : Experimental Set-Up for Standalone PV.[6]
On the other hand, a wireless Zigbee microcontroller has been applied to
determine the performance monitoring systems for solar photovoltaic (PV).
Previous research has found that under non-ideal conditions, there are degradation
of performance in Maximum Power Point Trackers (MPPT) and also the output
power decreasing significantly. This will led to monitoring and detection system
of non-ideal conditions in PV modules. The system developed by applying
Zigbee-enable microcontroller with back end embedded programming and front
end graphical user interface (GUI) providing remote monitoring of an array PV
modules real-time parameters that are voltage, current as well as the power. Other
than developing systems for monitoring purpose, this system also allow fault
detection as well [7]. This development can be represented as in block diagram
Figure 2.3 : Photovoltaic module performance monitoring system block diagram. [7]
A monitoring PV power stations by novel approach as developed in article
written by E.M Natsheh, E.J Blackhurs and A.Albarbar. The monitoring system is
been conducted by calculating the difference in residual between estimated model
and
actual
measured
parameters
so
that
the
system
degradation
early
determination is enables. Derivation of the models has been accomplished with
Matlab/Simulink software implementation. A dialog box also designed to enable
the
user
input
of
PV
system
parameters
respectively.
The
performance
development of this monitoring system achieved via examination and validation
under various operating condition and faults including dust, shadow and so on.
Furthermore, the simulation and analysis of the results has been completed under
![Figure 2.1 : Wireless monitoring on solar panel performance concept.[5]](https://thumb-ap.123doks.com/thumbv2/123dok/527187.60758/22.595.132.485.157.388/figure-wireless-monitoring-solar-panel-performance-concept.webp)
![Figure 2.2 : Experimental Set-Up for Standalone PV.[6]](https://thumb-ap.123doks.com/thumbv2/123dok/527187.60758/23.595.187.455.72.326/figure-experimental-set-standalone-pv.webp)
![Figure 2.3 : Photovoltaic module performance monitoring system block diagram. [7]](https://thumb-ap.123doks.com/thumbv2/123dok/527187.60758/24.595.140.472.78.278/figure-photovoltaic-module-performance-monitoring-block-diagram.webp)
