UNIVERSITI TEKNIKAL MALAYSIA MELAKA
THE IMPLEMENTATION OF EXPONENTIAL SMOOTHING
TECHNIQUE IN FORECASTING DEMANDS FOR SMI
This report submitted in accordance with requirement of the Universiti Teknikal Malaysia Melaka (UTeM) for the Bachelor Degree of Manufacturing Engineering
(Manufacturing Management) with Honours.
By
MOHD RIDHWAN BIN MOHD JAIH
UTeM Library (Pind.1/2005)
SULIT
TERHAD
TIDAK TERHAD
(Mengandungi maklumat yang berdarjah keselamatan atau kepentingan Malaysia yang termaktub di dalam AKTA RAHSIA RASMI 1972)
(Mengandungi maklumat TERHAD yang telah ditentukan oleh organisasi/badan di mana penyelidikan dijalankan)
(TANDATANGAN PENULIS) Alamat Tetap:
Lot 2040 Kg. Telok Tok Adis, Kuala Ibai, 20400 K. Terengganu
Tarikh: _______________________
Disahkan oleh:
(TANDATANGAN PENYELIA) Cop Rasmi:
Tarikh: _______________________
* Tesis dimaksudkan sebagai tesis bagi Ijazah Doktor Falsafah dan Sarjana secara penyelidikan, atau disertasi bagi pengajian secara kerja kursus dan penyelidikan, atau Laporan Projek Sarjana Muda (PSM).
BORANG PENGESAHAN STATUS TESIS*
UNIVERSITI TEKNIKAL MALAYSIA MELAKA
JUDUL: The Implementation of Exponential Smoothing Technique in Forecasting Demands for SMI
SESI PENGAJIAN: 2009-2010
Saya _____________________________________________________________________ mengaku membenarkan tesis (PSM/Sarjana/Doktor Falsafah) ini disimpan di
Perpustakaan Universiti Teknikal Malaysia Melaka (UTeM) dengan syarat-syarat kegunaan seperti berikut:
1. Tesis adalah hak milik Universiti Teknikal Malaysia Melaka.
2. Perpustakaan Universiti Teknikal Malaysia Melaka dibenarkan membuat salinan untuk tujuan pengajian sahaja.
3. Perpustakaan dibenarkan membuat salinan tesis ini sebagai bahan pertukaran antara institusi pengajian tinggi.
4. **Sila tandakan (√)
Mohd Ridhwan Bin Mohd Jaih
APPROVAL
This report is submitted to the Faculty of Manufacturing Engineering of UTeM as a partial fulfillment of the requirements for the degree of Bachelor of Manufacturing Engineering (Manufacturing Management) with Honours. The members of the supervisory committee are as follow:
……… Main Supervisor
DECLARATION
I hereby, declared this report entitled ―PSM Title‖ is the results of my own research except as cited in references.
Signature : ………....
Author‘s Name : Mohd Ridhwan Bin Mohd Jaih
iii
DEDICATION
Specially dedicated to my beloved Father, Mohd Jaih Bin Ab. Rahman and my mother,
Asmi Binti Ramli who are very concern, patient and supporting. To my brother, sister
and all my friend, I also would like to say thanks. The work and success will never be
ABSTRACT
Forecasting is the act of predicting future events or occurrences. In other word, forecasting is not only used in the industry but it can also be used to forecast events for daily life. In industry, forecasting is one of techniques that are used to predict demands from customers. This report represents an implementation of forecasting demands in Small Medium Industry (SMI). The forecasting technique selected for this research to predict the demands from customers is the exponential smoothing. These techniques have a weighted parameter to estimate the demands. The weighted parameter is called alpha (α). Besides that, the developed forecasting system is evaluated by finding the error produced from the outputs from the forecasting system. The errors are found by comparing the outputs from the forecasting system and the actual data collected. In this research, the Mean Absolute Percentage Error (MAPE) is used to calculate errors. The selection is due to the fact that this method is the most popular performance measure used in forecasting.
v
ABSTRAK
Peramalan adalah salah satu teknik yang boleh digunakan untuk meramal perkara masa depan. Dengan kata lain, peramalan tidak hanya digunakan dalam industri tetapi boleh digunakan untuk membuat anggaran dalam kehidupan sehari-hari. Laporan ini merupakan sebuah pelaksanaan tuntutan peramalan Industri Kecil dan Sederhana (IKS). Teknik ramalan yang dipilih untuk meramalkan tuntutan pelanggan dalam kajian ini adalah ‘exponential smoothing‘. Teknik-teknik ini memiliki ‘weighted average‘ untuk menganggarkan tuntutan dengan menganggarkan nilai alpha (α). Dalam kajian ini, Mean Absolute Percentage Error (MAPE) telah dipilih kerana kaedah ini adalah yang paling popular dikalangan pengkaji.
Kajian ini telah berjaya membangunkan satu perisian ramalan untuk IKS. Perisian ini terbahagi kepada dua bahagian; database dan perisian ramalan. Perisian ramalan dibangunkan berasaskan teknik Exponential Smoothing. Untuk menilai kemampuan perisian ini, kemampuan membuat ramalan (dalam bentuk MAPE) untuk perisian ini telah di bandingkan dengan hasil diperolehi dari teknik Naïve. Hasil perbandingan mendapati perisian berasaskan Exponential Smoothing berjaya menunjukan prestasi yang baik dan konsisten berbanding dengan teknik Naïve.
ACKNOWLEDGEMENT
Alhamdulillah, I‘m grateful that by the power of Allah, Most Gracious, Most Merciful, I managed to complete this research. I also want to thank my parents, who taught me the value of hard work by their own example. Both of them are my source of inspiration that lead me to working hard in gaining knowledge. I also would like to share this moment of happiness with all my friends that had helped me in completing this project in one way or another.
I also would like to thanks my supervisor, Dr. Noor Ajian Binti Mohd Lair, from Manufacturing Engineering Faculty, UTeM for all his guidance and help throughout the entire time of this project being carried out. Without this guidance this project might not go as well as it is. The encouragement and motivation that was given to me to carry out my project work are greatly appreciated.
I also would like to express my gratitude to the Micro Zaas Sdn. Bhd. for allowing me to conduct case study at their company. Without their help, the previous data collected can‘t be gathered and this research can‘t be completed.
vii
1.1 Introduction to Forecasting ... 1
1.2 Problem Statement ... 3
2.1 Background of Forecasting ... 8
2.2 Step in the Forecasting ... 10
2.3 Advantage of Forecasting ... 10
2.4 Characteristic of Forecasting ... 11
2.5 Assumptions of forecasting ... 12
2.6 Technique Used in Forecasting ... 12
Combination ... 20
Mean Absolute Percentage Error ... 24
Mean Absolute Deviation ... 24
Mean Squared Error ... 25
CHAPTER 3 ... 27
RESEARCH METHODOLOGY AND CONCEPT OF EXPONENTIAL SMOOTHING ... 27
3.0 Introduction ... 27
3.1 Research Methodology ... 28
3.2 The Concept of Exponential Smoothing ... 28
3.3 Using Exponential Smoothing Technique in Forecasting... 30
3.4 Trend-Adjusted Exponential Smoothing ... 31
3.5 Effect of Exponential Smoothing ... 33
3.6 Planning of Study ... 33
3.7 Mean Absolute Percentage Error ... 34
3.8 Conclusion ... 36
CHAPTER 4 ... 37
CASE STUDY ... 37
4.0 Introduction ... 37
4.1 Background of Company ... 37
Company Policy ... 39
Company Mission ... 39
Company Vision ... 39
Objective and Goal ... 40
4.2 Product ... 40
4.3 Data on Previous Demands ... 42
4.4 Conclusion ... 43
CHAPTER 5 ... 44
FORECASTING SOFTWARE ARCHITECTURE ... 44
5.0 Introduction ... 44
5.1 Forecasting System Architecture ... 45
5.1.1 Database Software ... 46
5.2 Conclusion ... 51
CHAPTER 6 ... 52
RESULT AND ANALYSIS ... 52
6.0 Introduction ... 52
6.1 Result of Forecasting using Naïve Method... 52
6.2 Result of Forecasting using Exponential Smoothing ... 60
6.3 Comparison between Naïve Method and Exponential Smoothing ... 68
6.4 Conclusion ... 71
CHAPTER 7 ... 72
CONCLUSION ... 72
7.0 Introduction ... 72
7.1 Summary of Research ... 72
ix
A.2 The results for 2007. ... 77
A.3 Comparison across alpha for 2007 ... 96
A.4 The results for 2008 ... 96
A.5 Comparison across alpha for 2008 ... 115
A.6 The results for 2009 ... 115
A.7 Comparison across alpha for 2009 ... 134
APPENDIX B ... 135
PROGRAMMING CODES FOR THE FORECASTING SYSTEM ... 135
B.1 Introduction ... 135
B.2 The DBMS code. ... 135
LIST OF FIGURES
Chapter 1
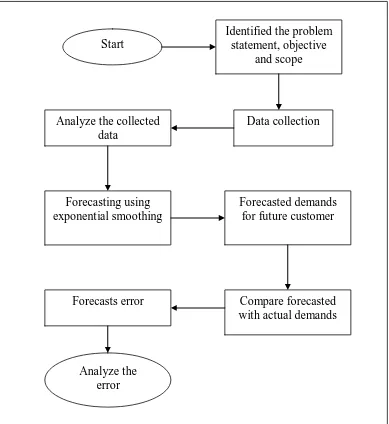
Figure 1. 1: Flow chart represents the research methodology ... 5
Chapter 3 Figure 3. 1: Flow chart represents the research methodology ... 29
Figure 3.2:Using the Excel template for trend-adjusted smoothing (Stevenson, 2007) . 32 Chapter 4 Figure 4.1: Micro Zaas Sdn. Bhd... 38
Chapter 5 Figure 5. 1: The software architecture ... 45
Figure 5. 2: The interface to enter the database or forecasting system ... 45
Figure 5. 3 :Interface of database ... 46
Figure 5. 4: Flow of activities in forecasting software ... 47
Figure 5. 5: Interface of forecasting system ... 48
Figure 5. 6: Pseudo code for input data acquisition process ... 49
Figure 5. 7: Pseudo code for Exponential Smoothing ... 49
Figure 5. 8: Pseudo code for MAPE ... 50
xi
LIST OF TABLES
Chapter 2
Table 2. 1: Summary of literature in forecasting ... 13
Chapter 4 Table 4. 1: Previous demands data ... 42
Chapter 6 Table 6. 1: Actual and Forecasted Demands for 2007 ... 53
Table 6. 2: Actual and Forecasted Demands for 2007 (continued) ... 54
Table 6. 3: Actual and Forecasted Demands for 2007 (continued) ... 55
Table 6. 4: Actual and Forecasted Demands for 2008 ... 55
Table 6. 5: Actual and Forecasted Demands for 2008 (continued) ... 56
Table 6. 6: Actual and Forecasted Demands for 2008 (continued) ... 57
Table 6. 7: Actual and Forecasted Demands for 2009 ... 57
Table 6. 8: Actual and Forecasted Demands for 2009 (continued) ... 58
Table 6. 9: Actual and Forecasted Demands for 2009 (continued) ... 59
Table 6. 10: Actual and Forecasted Demands for 2007 using Exponential Smoothing .. 60
Table 6. 11: Actual and Forecasted Demands for 2007 using Exponential Smoothing (continued)... 61
Table 6. 12: Actual and Forecasted Demands for 2007 using Exponential Smoothing (continued)... 62
Table 6. 13: Actual and Forecasted Demands for 2008 using Exponential Smoothing .. 63
Table 6. 14: Actual and Forecasted Demands for 2008 using Exponential Smoothing (continued)... 64
Table 6. 15: Actual and Forecasted Demands for 2009 using Exponential Smoothing .. 65
Table 6. 16: Actual and Forecasted Demands for 2009 using Exponential Smoothing (continued)... 66
Table 6. 17: Actual and Forecasted Demands for 2009 using Exponential Smoothing (continued)... 67
Table 6. 18: α performance across the year. ... 67
Table 6. 19: Forecasted demand for Both Naïve and Exponential Smoothing Method. . 68
Table 6. 20: Forecasted demand for Both Naïve and Exponential Smoothing Method. (continued)... 69
Table 6. 21: Forecasted demand for Both Naïve and Exponential Smoothing Method. (continued)... 70
xiii
LIST OF ABBREVIATION
UTeM - Universiti Teknikal Malaysia Melaka
PSM - Projek Sarjana Muda
ES - Exponential Smoothing
MAPE - Mean Absolute Percentage Error
MAD - Mean Absolute Deviation
MSE - Mean Squared Error
MAE - Mean Absolute Error
ANN - Artificial Neural Network
MdAPE - Median Absolute Percentage Error
RMSE - Root Mean Squared Error
MSFE - Mean Squared Forecast Error
HMAE - Heteroscedasticity-adjusted Mean Absolute Error
CHAPTER 1
INTRODUCTION
1.0
Introduction
Ability to predict future events such as number of customer or demands can bring significant advantage to an industry management team. By knowing the expected demands, the management can plan accurately the number of products to be produced. The closes the number of product produced compared to demands, the higher is the number of customer‘s demand being fulfilled without producing extra products.
The act of predicting future events is also called forecasting. Due to the significant of forecasting in management decision making, this research focuses on the development of forecasting software for small medium industry (SMI). Specifically this chapter introduce background to forecasting in Section 1.1, declares problem statement in Section 1.2, provides research objective in Section 1.3, describe scope of study in Section 1.4, explain research methodology in Section 1.5 before finally presents the organization of this report in Section 1.6.
1.1
Introduction to Forecasting
2
prior to making the decision should permit an improved choice over that which would otherwise be made (Montgomery et al., 1990). For this reason, management systems for planning and controlling the operations of an organization typically contain a forecasting function. The following are examples of situations where forecasts are useful:
a. Inventory management – in controlling inventories of purchased spare parts at an aircraft maintenance facility, it is necessary to have an estimate of the usage rate for each part in order to determine procurement quantities.
b. Production planning – to plan the manufacturing of a product line, it may be necessary to have forecast of unit sales for each item by delivery period for a number of months in the future.
c. Financial planning – a financial manager has concern about the pattern of cash flow that the company will experience over time.
d. Staff scheduling – the manager of a mail processing facility of the United States Postal Service needs a forecast of the hourly volume and mix of mail to be processed in order to schedule staff and equipment efficiently.
e. Facilities planning – decisions about new facilities generally require a long-range forecast of the activities using the facilities.
f. Process control – forecasting also can be an important part of a process control. By monitoring key process variables and using them to predict the future behavior of the process, it may be possible to determine the optimal time and extent of control action.
1.2
Problem Statement
In general, the SMI under study produces products to customers as requested. Meaning production of demands will only be started once order is received. This scenario demonstrates in substance of demand forecasting in the company. Without forecasting, expected future demands are unknown. This scenario causes the company to buy raw material without proper planning. Sometimes, the stock can last up to 6 months or a year. Higher stock of raw material may tight- up cash flow necessary. This cash flow can be invested to other activity, which can bring benefits to the company.
Moreover, the company is also facing problem with limited space for storing and operation of new products. Despite recent expansion, space is still limited. It is observed that reduction in storage of raw materials may offer benefit to the company.
1.3
Research Objective
The aim of this research is to develop a forecasting system for a Malaysian SMI that prediction of future demands can be made based on data from previous demands.
• Identify a method suitable for forecasting demands.
• Identify the performance measure to be used for evaluating the performance of forecasting activity
• Analyze demands from the customer order for each product. So that, forecasting can be conducted accurately
• Develop forecasting software to predict the future demands.
1.4
Scope of Study
4
In this case, the researches cover both of the external and internal customer‘s demands. The method of forecasting used to predict the demands from customer in this research is exponential smoothing. For evaluating the performance of forecasting system, the mean absolute percentage error was used to evaluate. The error shows how accurate the result compares to actual previous demands. Specifically, the input data in this research covers for at least previously 5 year. The data are than forecast using the exponential smoothing. The forecasting software is developed using enter Microsoft Office Excel or Visual Basics.
1.5
Research Methodology
Start
Analyze the collected data
Forecasting using exponential smoothing
Forecasted demands for future customer
Compare forecasted with actual demands Forecasts error
Analyze the error
Identified the problem statement, objective
and scope
Data collection
Figure 1. 1: Flow chart represents the research methodology
Before the collected data can be used for forecasting, the data needs to be analyzed. After data analysis, forecasting using the exponential smoothing method can be conducted. The exponential smoothing predicts future demands using the alpha as a smoothing constant. From this, forecasts of demands for future customer, who would like to order the product from the company, can be estimated.
6
show how accurate or not the forecasting system. Review from journal indicated that, there are three methods to calculate error; mean absolute percentage error (MAPE), mean absolute error (MAE) and mean absolute deviation (MAD). For this research, MAPE is used to analyze the developed forecasting system.
1.6
Organization of Report
This report is prepared in four chapters. Chapter 1 contains the introduction to forecasting. Here, the forecasting definition is explained as an important element in management systems for planning and controlling the operations of an organization. The problem statement, objective of the project, scope of study, research methodology and finally the organization of report also describes in this chapter.
Chapter 2 consists of literature reviews of subjects that are going to be investigated throughout this project. Theories, related studies, testing involved and previous researches in forecasting demands in SMI and matters involved are also reviewed. The concept of forecasting technique and performance measure are also discussed. Previous research from journals and papers are also being reviewed. This is to ensure that the project is properly designed and avoid mistakes once the experiment takes place.
Chapter 3 covers research methodology and introduces the concept of exponential smoothing. Specifically, description into detail experimental design is presented. In addition, this chapter also explains the concept of exponential smoothing, using exponential smoothing technique in forecasting, trend-adjusted exponential smoothing and effect of exponential smoothing. Then, discussion followed by planning of study.
Chapter 5 presents the forecasting system developed using visual basic for this research. Specifically, explanation on the software architecture is presented in detail.
Chapter 6 presents the result from the experiment. Specifically, the results from forecasting using the Naïve method and the Exponential Smoothing are presented in details. After that, the Naïve method and Exponential Smoothing performance is then compared.
8
CHAPTER 2
LITERATURE REVIEW
2.0
Introduction
Forecasting is an activity where future condition is estimated based on existing or current condition. This activity is performed in daily human life. For example, forecasting daily whether can be seen regularly during 8 pm news.
Similar scenario can be seen in daily manufacturing activities. Forecasting of demands is necessary to estimate quantity to be produced today and tomorrow. Following the significant of forecasting, this chapter review literature on forecasting. Specifically, this chapter presents background on forecasting in Section 2.1, step in forecasting in Section 2.2, advantage of forecasting in Section 2.3, characteristic of forecasting in Section 2.4 and assumption in forecasting in Section 2.5 before presenting detail review of literature. The review of literature covers techniques used in forecasting (in Section 2.6) and performance measure (in Section 2.7)
2.1
Background of Forecasting
usage can differ between areas of application: for example in hydrology, the terms "forecast" and "forecasting" are sometimes reserved for estimates of values at certain specific future times, while the term "prediction" is used for more general estimates, such as the number of times floods will occur over a long period ((Fader et al., 2003). Therefore, anticipating risk and uncertainty are central to and reason for forecasting and prediction. In manufacturing antiquities, forecasting is used in Customer Demand Planning. In demand planning anticipating customers‘ demands is necessary. The discipline of demand planning, also sometimes referred to as supply chain forecasting, embraces both statistical forecasting and a consensus process (Fader et al., 2003).