TEXT
Quasi Experimental Study at the Eighth Graders of SMP N 6 Semarang in the Academic Year 2015/2016
a final project
submitted in partial fulfillment of the requirements for the degree of Sarjana Pendidikan
in English
by
Angkita Boni Hervinia
2201411074
ENGLISH DEPARTMENT
FACULTY OF LANGUAGES AND ARTS
SEMARANG STATE UNIVERSITY
iv
MOTTO AND DEDICATION
Opportunities do not happen, you create them (Chris Grosser).
Try not to become a person of succes, but rather try to become a person of value
(Albert Einstein).
This final project is dedicated to:
her kind father Heri Sunardi,
her great mother Tuti Suryaningsih,
her respectable sister and brothers,
her beloved man Bastiar Ismail Adhkar
v
ACKNOWLEDGMENT
First and foremost, the writer would like to express her highest gratitude to Allah SWT the Almighty for the blessing, mercy, health and inspiration leading her to finish this final project.
She would also like to express her deepest and appreciation and thanks to Dra. C. Murni Wahyanti M.A., as the first advisor and Seful Bahri, S.Pd., M.Pd., as the second advisor who have given guidance and encouragment from the beginning until the completion of this final project.
She would like to express her sincerest gratitude to Prof. Dr. Agus Nuryatin, M.Hum and Dr. Rudi Hartono, S.S., M.Pd., respectively as the chairman and secretary of the Board of Examination, as well as the team examiners, especially first examiner Dr. Abd. Faridi, M.Pd who has given corrections, comments, and suggestions. She also expresses her deep gratitude to H. Suparno, S.Pd., M.Pd., the headmaster of SMPN 6 Semarang who has given her opportunity to conduct the research there, Titik Setyowati, S.Pd., the English teacher who help her conducting the research, and also the students who have cooperated during the data gathering.
vi
ABSTRACT
Hervinia, Angkita Boni. 2011. The Effectiveness of Graphic Organizers for Teaching Vocabulary of Recount Text (Quasi Experimental Study at the Eighth Graders of SMPN 6 Semarang in the Academic Year 2015/2016). Final Project. English Departement. Semarang State University. Advisor: Dra. C. Murni Wahyanti M.A. Second Advisor: Seful Bahri, S.Pd., M.Pd.
Key words: Graphic organizers, Vocabulary, Quasi Experimental Research
This study was conducted under the considerations of the observation in SMPN 6 Semarang that many students found difficulties in understanding vocabulary. The objectives of this study were to find out the significance of the use of the graphic organizers on vocabulary achievement and to find out whether the use of graphic organizers for teaching vocabulary of recount text is effective to the eighth graders of SMPN 6 Semarang.
To gain the objectives, the writer did a quasi experimental research by using non-randomized control group pretest-posttest design. The subjects of this study were the students in class 8A and 8H of SMPN 6 Semarang. 8A was the control group and 8H was the experimental group. In this study, the writer gave the students pre-test, treatment, and post-test. The pre-test was given to both groups using the same instrument. They were asked to answer some questions of vocabulary test. The treatment was given in three meetings. The treatment in the experimental group was using graphic organizers, while the treatment in the control group was lecturing. The post-test was conducted after the treatment given to both groups using the same instrument as the pre-test but the position of question numbers were reshuffled.
The result of the analysis using t-test showed that the experimental group got better score than the control group. In the pre-test, the average score of the experimental group was 68.87 and the control group was 68.39. In the post-test, the average score of experimental group was 83.55 and the control group was 74.52. tTe result of the t-test was 2.14 and t-table was 2.00. It means that the t-value was higher than t-table (2.14>2.00).
vii
TABLE OF CONTENTS
Page
ACKNOWLEDGEMENT ... v
ABSTRACT ... vi
TABLE OF CONTENTS ... vii
LIST OF FIGURES ... xi
LIST OF TABLES ... xii
LIST OF APPENDICES ... xiii
CHAPTER I INTRODUCTION ... 1
1.1 Background of the Study ... 1
1.2 Reason for Choosen the Topic ... 4
1.3 Research Question ... 4
1.4 Purposes of the Study ... 5
1.5 Significances of the Study ... 5
1.6 Hypotheses of the Study ... 6
1.7 Definition of Key Terms ... 6
1.8 Outline of the Report ... 7
II REVIEW OF RELATED LITERATURE ... 8
2.1 Review of the Previuos Studies ... 8
viii
2.2.1 Vocabulary ... 10
2.2.1.1 Definition of Vocabulary ... 10
2.2.1.2 Teaching Vocabulary ... 11
2.2.1.3 Mastery of Vocabulary ... 12
2.2.1.4 Testing Vocabulary ... 13
2.2.2 Graphic Organizers ... 15
2.2.2.1 Definition of Graphic Organizers ... 15
2.2.2.2 Types of Graphic Organizers to Teach Vocabulary ... 16
2.2.2.3 Styles and Uses of Graphic Organizers in Teaching ... 21
2.2.2.3.1 Reading Graphic Organizers ... 22
2.2.2.3.2 Vocabulary Graphic Organizers ... 22
2.2.2.3.3 Content Graphic Organizers ... 22
2.2.2.3.4 Writing Graphic Organizers ... 23
2.2.2.4 Guiding Principles of Effectiveness of Graphic Organizers ... 23
2.2.2.5 How to Use Graphic Organizers ... 25
2.2.3 Types of Text ... 26
2.2.3.1 Recount Text ... 26
2.3 Framework of the Present Study ... 27
III METHOD OF INVESTIGATION ... 29
3.1 Research Design ... 29
3.2 Subject of the Study ... 30
ix
3.3.1 Independent Variable ... 31
3.3.2 Dependent Variable ... 31
3.4 Instruments of the Study ... 31
3.4.1 Vocabulary Test ... 31
3.4.2 Questionnaire ... 32
3.5 Procedures of Collecting Data ... 32
3.5.1 Try-out ... 33
3.5.1.1 Validity ... 34
3.5.1.2 Reliability ... 35
3.5.1.3 Difficulty Level ... 36
3.5.1.4 Discriminating Power ... 37
3.5.2 Pre-test ... 38
3.5.3 Treatment ... 38
3.5.4 Post-test ... 39
3.6 Technique of Analysis ... 40
3.6.1 Scoring Technique ... 40
3.6.2 Normality ... 40
3.6.3 Homogeneity ... 41
3.6.4 T-test Statistical Analysis ... 42
IV DATA ANALYSIS AND DISCUSSION OF FINDINGS ... 44
4.1 Try-out Analysis ... 44
x
4.1.2 Reliability ... 46
4.1.3 Difficulty Level ... 46
4.1.4 Discriminating Power ... 47
4.2 Pre-test Analysis ... 48
4.2.1 Homogeneity of the Pre-test of the Experimental and Control Group ... 49
4.2.2 Normality of the Pre-test of the Experimental Group ... 50
4.2.3 Normality of the Pre-test of the Control Group ... 50
4.3 Treatment Activity ... 50
4.4 Post-test Analysis ... 54
4.4.1 Homogeneity of the Post-test of the Experimental and Control Group ... 54
4.4.2 Normality of the Post-test of the Experimental Group ... 55
4.4.3 Normality of the Post-test of the Control Group ... 55
4.5 T-test Analysis ... 56
4.6 Questionnaire Analysis ... 57
4.7 Discussion of the Research Findings ... 57
V CONCLUSION AND SUGGESTION ... 59
5.1 Conclusions ... 59
5.2 Suggestions ... 59
xi
LIST OF FIGURES
Figure Page
Figure 2.1 Synonym Wheel ... 17
Figure 2.2 Concept Circle ... 18
Figure 2.3 Venn Diagram ... 19
Figure 2.4 Word Star ... 20
Figure 2.5 Word Jigsaw ... 21
xii
LIST OF TABLES
Table Page
Table 3.1 The Activities of the Study ... 33
Table 3.2 The Index of Difficulty ... 36
Table 3.3 The Index of Discriminating Power ... 38
Table 4.1 The Validity of the Try-out Test ... 45
Table 4.2 Item Difficulty of the Test ... 47
Table 4.3 Discriminating Power of the Test ... 48
Table 4.4 The Schedule of the Research ... 51
xiii
LIST OF APPENDICES
Appendix Page
Appendix 1 Try-out Test ... 63
Appendix 2 The Result of Try-out test ... 66
Appendix 3 The Computation of Validity, Reliability, Difficulty Level and Discriminating Power ... 67
Appendix 4 Validity of the Test ... 70
Appendix 5 Reliability of the Test ... 71
Appendix 6 Discriminating Power ... 72
Appendix 7 Difficulty Level ... 73
Appendix 8 Experimental Group Lesson Plan ... 74
Appendix 9 Control Group Lesson Plan ... 84
Appendix 10 Pre-test ... 93
Appendix 11 Post-test ... 95
Appendix 12 Questionnaire ... 97
Appendix 13 The Distribution Score of Experimental and Control Group ... 98
Appendix 14 Homogeneity of the Pre-test of the Experimental and Control Group ... 99
Appendix 15 Normality of the Pre-test of the Experimental Group ... 100
Appendix 16 Normality of the Pre-test of the Control Group ... 101
xiv
Appendix 18 Normality of the Post-test of the Experimental Group ... 103
Appendix 19 Normality of the Post-test of the Control Group ... 104
Appendix 20 T-test Statistical Analysis ... 105
1
In this chapter, the writer would like to discuss the introduction of the study. It includes background of the study, reasons for choosing the topic, research question, purposes of the study, significances of the study, hypotheses of the study, definition of key terms, and outline of the report.
1.1Background of the Study
English is one of languages in the world that has an important role in communication. It has become international language and is almost used in all part of life, especially in education which is used as one of compulsory subjects taught in some education institutes. The goal of learning English in education
institutes is to develop students‟ communication competence and improve their
skills both in spoken and written forms.
Thornburry (2012: 13) said, “without grammar very little can be conveyed,
without vocabulary nothing can be conveyed”. Vocabulary is the center in
English learning process because vocabulary is part of other aspects and skills. Although students mastered in grammar aspect, we cannot say that they mastered in English if they have problems in vocabulary.
“A large vocabulary improves achievement and students with larger
vocabulary often score higher on achievement tests than students with smaller
vocabularies” (Webber, 2012). Webber further adds that a large vocabulary
improves thinking and communication by allowing students to communicate in precise, powerful, persuasive and interesting ways. Most students cannot master vocabulary because it is not an easy thing to learn.
Mastery of vocabulary is difficult to achieve because the students have a limited ability in memorizing words. It is impossible for students in memorizing English words which have a thousand words. It is not an easy task for teachers to teach vocabulary because the limited ability of students. So that it is needed to apply an appropriate strategy to teach vocabulary.
the national exam. However, during the vocabulary learning, there were some students which had difficulties in memorizing and understanding new words because they were only asked to write the words in their note. Since each student had different characteristic, some of them only wrote the words without organized their note. They also often made mistakes or errors spelling and writing words. Thus, the writer uses a strategy which is appropriate with the characteristics of the students. The strategy uses graphic organizers which the students can understand the word easily.
“Words are important to be learned because without words we would be
unable to convey our thoughts through language or understand the thoughts of
others” (Framkin, Rodman, and Hyams, 2011: 36). Words can be learned in many
ways, one of them is by using graphic organizers. Graphic organizers provide opportunity to students to explore more about words. Through graphic organizers they can learn words more specific.
Graphic organizers provide opportunity to learn words wider. This strategy
is so effective in improving students‟ vocabulary and students active to explore a
word. Students can use this strategy not only in the class, but also they can use it in home. Graphic organizers make students easier in learning and memorizing a word. This strategy has various concepts that can help students and teachers in learning a word. Besides, they can develop and categorize a word into some aspects, it depends on the topic and the purpose of the lesson.
contents, it depends on the purpose of the lesson. The contents can be synonym, antonym, meaning, part of speech, picture, sentence, etc. Graphic organizers can be used in variety of learning situations for individual, small group, and whole class. There are some graphic organizers that can be used for students in learning vocabulary. Every graphic organizer has different function and purpose, it depends on the grade and the characteristics of the students.
1.2Reasons for Choosing the Topic
Some students have problems in memorizing and understanding the meaning of word. During the learning process, students have difficulties in defining a word when they are reading or writing a text. In comprehending a text, it is needed to have a lot of vocabularies. Not only memorizing and understanding as the problem, but also make errors spelling and writing words.
Considering the importance of learning vocabulary, the writer uses graphic organizers to teach vocabulary. Graphic organizers help students to improve vocabulary by connecting a word to definition, synonym, antonym, picture, example, etc. Besides, graphic organizers also help students to organize their vocabulary note through interesting way. In this research, the writer wants to
know how the graphic organizer can improve students‟ vocabulary.
1.3Research Question
How significant is the use of graphic organizer for teaching vocabulary of recount text?
1.4Purposes of the Study
Based on the research question above, the purposes of this study are:
(1) To find out the significance of the use of graphic organizer on vocabulary achievement.
(2) To find out whether the use of graphic organizers for teaching vocabulary of recount text is effective to the eighth graders of SMPN 6 Semarang.
1.5Significances of the Study
By conducting the research about the effectiveness of graphic organizers for teaching vocabulary of recount text, the writer hopes that the result of this research will be useful to give some contributions to English language teaching and learning. i.e.:
(1) Theoretically
Theoretically, the result of this study is expected to be able to give some advantages for students, teachers, the writer, and other researchers and hopefully can be used as source of reference.
(2) Practically
did before and encourage them to learn English by improving their vocabulary.
(3) Pedagogically
Pedagogically, the result of this study is useful to inform the readers about the
use of graphic organizers to improve students‟ vocabulary.
1.6Hypotheses of the Study
Hypothesis 1 (Ha): Graphic organizers are effective for teaching vocabulary to the grade eight students of SMPN 6 Semarang.
Hypothesis 2 (Ho): Graphic Organizers are not effective for teaching vocabulary to the grade eight students of SMP N 6 Semarang.
1.7Definition of Key Terms
In order to make this study clearer, the writer will explain the definition of key terms that might help the readers understand this study.
(i) Graphic Organizer
(ii) Vocabulary
Vocabulary is all the words that a person knows or uses; all the words in a particular language; the words that people used when they are talking about a particular subject (Hornby, 2005).
(iii) Teaching Vocabulary
Vocabulary teaching helps learners when they feel it is most needed especially for the message-focused activities involving listening, speaking, reading and writing (Nation, 2005).
1.8Outline of the Report
This final project consists of five chapters:
Chapter I consists of general background of the study, reasons for choosing the topic, research question, purpose of the study, significances of the study, hypotheses of the study, definition of key terms, and outline of the report.
Chapter II discusses about review of related literature that consists of review of previous study, theoretical background and also framework of the present study.
Chapter III deals with the method of investigation which discusses subjects of the study, instrument of the study, procedures of collecting data, quasi-experimental design of the research, and also technique of analysis.
8
This chapter consists of three parts. The first part is review of previous studies. The second part is theoretical background and the last is framework of the present study.
2.1.Review of the Previous Studies
There are some researchers that conduct research about strategy, technique and method to teach vocabulary.
The first study was The Influence of Mind-Mapping Strategy on Students’ Vocabulary Mastery (Quasi Experimental Study of the Fifth Graders of SD Islam Bilingual An-Nissa Semarang in the Academic Year of 2012/2013). The aim of the
study is to find out the significance of Mind Mapping strategy to improve
students‟ vocabulary mastery. This study was conducted by using quasi
difference in vocabulary achievement to the experimental group than the control group that was not taught by using Mind Mapping strategy (Dewi, 2013).
The second study was conducted by using a game, entitled The Use of Scrabble Game to Teach Vocabulary. There were two objectives of this research.
Firstly, the writer wanted to find out the result of teaching English Vocabulary by using scrabble game. Secondly, he wanted to find out the effectiveness of using scrabble game to teach vocabulary for the eighth graders of SMPN 1 Ngadirejo in academic year of 2013/2014. He used quasi experimental to achieve his objectives. The result of his research showed that the average score of experimental group was 81.25 and control group was 71.25. It means that the use
of scrabble game in teaching and enhancing students‟ vocabulary is more effective
than the conventional method (Putra, 2014).
The next study was a classroom action research that used pictorial story to
improve students‟ understanding on vocabulary. There were three cycles in this research. Every cycle consists of four components, they are planning, acting, observing, and reflecting. In the first cycle, students enjoyed the class but not all the students understood of the text and direction. In the second cycle, the average result was better than the first cycle but there were still students who got lower score. And the last cycle, it was better than previous one and students joined the class enthusiastically. It concluded that the implementation of using Pictorial
Story to improve students‟ understanding on teaching vocabulary could be applied
The next researcher was Webber (2012) who wrote in journal which was entitled Teaching Vocabulary with Hypermedia. The objective of this study was to determine what effects, if any, technology integration has on the vocabulary development of middle students. The researcher identified the weak area of the sixth grade students by planning three integrated instructional activities to teach simile and metaphor and Greek and Latin word roots. The result was the responses for the technology integration activities were favorable and all of the students like using technology to learn and felt that they learn better through the use of technology.
2.2.Theoretical Background
This subchapter discusses some theories related to the topic of this study. It includes some theories about vocabulary, Graphic Organizers, and text types. Every sub subchapter consist some points to be discussed.
2.2.1.Vocabulary
In this part, the writer discusses four points. The first point is the definition of vocabulary. The second point is teaching vocabulary. The third point is the mastery of vocabulary and the fourth point is testing vocabulary.
2.2.1.1. Definition of Vocabulary
influence the improvement of language skill and other components. As the learners, mastery of vocabulary is needed to communicate with others.
Arif (2012) stated „vocabulary knowledge is knowledge, the knowledge of a word not only implies a definition, but also implies how that word fits into the
world‟. Hiebert and Kamil (2005) added that vocabulary is not a developmental
skill or one that can ever be seen as fully mastered. The expansion and elaboration of vocabularies is something that extends across a lifetime. Throughout the life span, people develop vocabulary effectively and almost effortlessly as long as they see words in meaningful contexts.
From the definitions above, the writer concludes that vocabulary is knowledge of word and lists of words that we can find in our daily life and is used by people to communicate either in verbal or written communication.
2.2.1.2. Teaching Vocabulary
Teaching vocabulary is necessary for teacher in all content areas. The main problem of vocabulary teaching is that only a few words and a small part of what is required to know a word can be dealt with at any one time (Nation, 2005). He also added that the positive effects of vocabulary teaching were that it could provide help when learners felt it was most needed.
Teaching vocabulary should be given in appropriate and interesting ways.
Strategy to teach vocabulary can influence the improvement of students‟
them and highlight important and interesting words. However, many teachers have their own strategy in teaching vocabulary. Although they have their own strategy, they still need many references to help them in teaching vocabulary. Sometimes, one strategy should be completed with another strategy and modify them appropriately.
There are certainly many ways to teach and learn vocabulary, but it is important to know that there is the best way. Teachers should keep four factors in mind when they consider strategies to teach vocabulary: (1) the students they are teaching, (2) the nature of the words they decide to teach, (3) their instructional purposes in teaching each of those words, and (4) the strategies they employ to teach the words (Flanagan & Greenwood, 2007 in Middle School Journal). Strategies that focus on word recognition and word use in meaningful contexts are most likely to positively affect vocabulary growth.
2.2.1.3. Mastery of Vocabulary
Vocabulary should be mastered by students to help them in oral or written communication. According to Nist and Mohr (2002) many studies have indicated that students with strong vocabularies are more successful in school. Further, a good vocabulary, more than any other factor, was common to people enjoying successful careers in life.
2.2.1.4. Testing Vocabulary
To improve students‟ vocabulary, we also need some tests to know how many
words we have known. According to Pavlu (2009: 30) there are eighteen types of testing vocabulary. In this study, the writer will use two types of testing vocabulary, they are:
1) Multiple Choice
According to Thornbury (2012: 132) multiple choices are a popular way of testing in that they are easy to score and they are easy to design. This technique is easy to mark but difficult to design. It also can be used to test single words, words in sentences or in text (Pavlu, 2009: 3).
Single words can be tested through definitions, for example: Tangled means...
a. A type of dance b. A tropical forest c. A confused mass
Words can be tested in sentences, for example: There is a good at the Odeon tonight.
A) Screen B) Film C) Showing D) Acting (Heaton, in Pavlu, 2009: 31).
In addition, Thornbury (2012) presents another way of using multiple choice, that is a contextualised multiple choice.
Here the example:
CANCER 22 June – 22 July
Someone else is (a playing; b calling; c singing) the tune and for the moment you are quite happy to go (a along; b around; c away) with what seems like a reasonable idea. Hobbies (a make; b use; c take) up far too much time and children could need support with a new activity. Feelings are (a going; b running; c climbing) high so ensure you‟re getting the affection you need.
2) Cloze test
deleted. Besides, the appropriate word scoring, the test-takers supply any word that is grammatically correct and make good sense in context (Brown, 2004: 202).
Here the example of cloze test: Tumbu Fly
In Africa South of Sahara, another (1) the traveller may encounter
is (2) tumbu or mango fly, which (3) its
eggs in clothing laid (4) on the ground to dry.
In this study, the writer will divide the test into two parts. The first part, the writer will use multiple choice test that consists of some questions about synonym and antonym. The second part is cloze test, the students will be asked to complete paragraph with appropriate words.
2.2.2.Graphic Organizers
In this part, the writer discusses five points. The first point is definition of graphic organizers. The second point is types of graphic organizers. The third point is styles and uses of graphic organizers in teaching. The fourth point is guiding principles for effective graphic organizers and the last point is how to use graphic organizers.
2.2.2.1. Definition of Graphic Organizers
organizer is a visual and graphic representation of relationships among ideas and concepts. Graphic organizers provide students with concrete and visual connection between words and their meaning.
Another definition comes from Culbert, Flood, Windler, and Work (1998) also stated that:
Graphic organizers have been used to assist learners‟ comprehension by explicitly highlighting main ideas and showing the relationship between the main ideas and supporting details... Graphic organizers enable the learner to use his/her prior knowledge to interact with the text at a more complex level. Once prior knowledge is activated, the learner can take this new information and add it to his/her schema, thus, improving comprehension.
Based on the definitions above, the writer concludes that graphic organizer is a graphic which help students in gaining information by connecting the words with their meaning and other concepts.
2.2.2.2. Types of Graphic Organizers to Teach Vocabulary
There are several types of graphic organizers for teaching vocabulary that have different ways to connect and gather information.
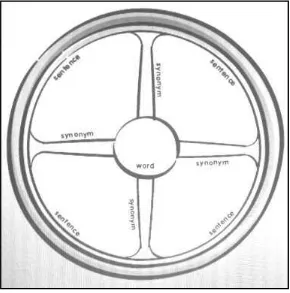
1) Synonym Wheel
center of the wheel. Then students find some synonyms of the word and put on the other part of wheel. After finding the synonyms of the word, teacher asks students to differentiate the meaning of the synonym by writing context sentence.
Figure 2.1 Synonym Wheel
2) Concept Circle
also appropriate to help students before they write a text or as a brainstorming. However, the focus of this graphic organizer is to have more vocabularies. According to Stamper (2006) concept circle can be used as brainstorming. Teacher asks students to think a topic or a concept to fit in the middle of circle, but not to write in yet. Then teacher asks students to fill the other parts of the circle with words that belong to the concept and fill with nonexample words. Students change the paper with their partner and ask them to determine the concept.
Figure 2.2 Concept Circle
3) Venn Diagram
students‟ interest. First, it can be used in beginning of the school year to know each other by comparing their interest, family, activities, etc, and then students presented of their graphic organizer in the class. Second, it is also used to know their characteristics and the last it is used to help students in reviewing information after the lesson. This graphic organizer can be modified to achieve the purpose of the lesson.
Figure 2.3 Venn Diagram
4) Word Star
synonym, antonym, part of speech and context sentence. But, we can modify this graphic organizer by looking at the purpose of the lesson.
Figure 2.4 Word Star
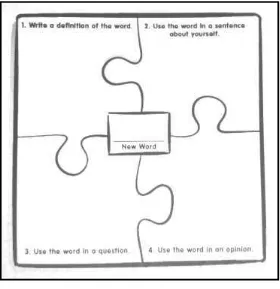
5) Word Jigsaw
Figure 2.5 Word Jigsaw
In this study, the writer uses three graphic organizers, they are synonym wheel, concept circle, and venn diagram. The graphic organizers are modified by paying attention to the objective of this study. In synonym wheel, the subjects are only asked to find the synonym. In concept circle, the writer gives a topic and the subjects find the words that have connection with the topic. In venn diagram, the subject are asked to compare two things.
2.2.2.3. Styles and Uses of Graphic Organizers in Teaching
categorize reading material, help students learn vocabulary, etc. Graphic Organizer can be used in the classroom by purpose.
2.2.2.3.1. Reading Graphic Organizers
Reading graphic organizers help students to understand a non-fiction piece, story, novel, and poem. Students also can understand the parts of plot and types of literary elements used. When students understand the plot, it can help to identify the exposition, conflicts, rising action, climax, falling action and resolution. Reading graphic organizers also help students to learn the characters, setting, and identify the sequence of events (Hayden, 2012).
2.2.2.3.2. Vocabulary Graphic Organizers
Vocabulary graphic organizers can help students to study vocabulary word. The various vocabulary graphic organizers will help students to expand their vocabulary (Hayden, 2012). Vocabulary graphic organizers have some concepts that support students to learn and improve their vocabulary. Those concepts can be used based on the purpose of the lesson. It also helps students to have understanding about vocabulary word.
2.2.2.3.3. Content Graphic Organizers
Content graphic organizers help students to learn concept from textbooks or other
section which are easier to learn. These graphic organizers show the connection between information and help to summarize information (Hayden, 2012).
2.2.2.3.4. Writing Graphic Organizers
Hayden (2012) stated “when students need to write they need to brainstorm ideas
and organize the information”. Writing graphic organizers help students to not
stare the paper for hours. These graphic organizers also help students to write essays, stories, memoirs, plays, and poem.
2.2.2.4. Guiding Principles of Effectiveness of Graphic Organizers
According to Shoari (2012) graphic organizers guide learners‟ thought through describing and drawing visual maps or diagrams. It can be said that graphic organizers are effective strategies for enhancing and facilitating learning.
Other reasons come from research (in Shoari, 2014) that suggested:
“Graphic organizers match the mind; they show clearly how the concepts are connected to prior knowledge to help comprehension; graphic organizers support the memory; they help to keep information and make it ready to use when it comes to higher thought processes; graphic organizers result in involving learners
with combination of the spoken and printed texts and diagrams.”
According to Baxendell (2003) there are three general principles for the use graphic organizers. Graphic organizer must be used coherently, consistently, and creatively.
1) Coherent
Graphic organizers can be easy when making abstract concepts and relationship clear. Sometimes students give more attention to minor detail that is not important. It will make students lack of focus on main ideas. Baxendell
(2003) stated “when making main idea and detail chart, we identify the main idea as the central concept and place the details of center, so students have
visual reminder of the hierarchical relationship between the concepts”. By
labelling the relationship and concepts, it will help students to understand particular content. It can conclude that labelling should be clear for the relationship and concepts in graphic organizer, and we have to minimize distraction.
2) Consistent
students complete individual lesson graphic organizers that focus on one important idea from a unit, it can be science or social studies. Then, students have access to organize the note to help them practice and review for unit test. By being consistent with the implementation of graphic organizers, we found that our students will independently use organizing techniques (Baxendell, 2003). It can conclude that it should establish a routine for implementing a standard set of graphic organizers in the classroom.
3) Creative
Creativity is needed in graphic organizers to retain the information. Baxendell
(2003) stated “students are more likely to retain the information contained in a
graphic organizer if it is presented in an inviting manner”. It also can add
illustrations to encourage students to enhance the graphic organizers. Both word and picture cues help the students to recall ideas, but it should be stressed that the illustrations must add to their understanding of the content, not distract them from it. Graphic organizers will be more effective if the teachers implement creative ways. They can make cooperative groups and learning pairs which are to ensure the students participate in active learning situation. It can conclude that it is needed to add illustration and implement with cooperative groups and pairs in graphic organizers.
2.2.2.5. How to Use Graphic Organizer
individual student. By using the graphic organizer as motivational to teach and practice vocabulary skill, the students can learn unfamiliar word with interesting way.
Stamper also said that we could implement the organizers in any of the following ways: (a) draw the organizer on the board or on chart paper, (b) use the organizer as a template for an overhead of transparency, (c) reproduce multiple copies of the organizer to pass out to students during class work, and (d) Have copies of the organizer available for students to use while working independently.
2.2.3. Types of text
In this study, the writer will focus on recount text because it is one of genre texts that is taught in junior high school. It is also text that used a lot of vocabularies when we want to tell about our experience or past event. Therefore, this text is appropriate for students to help them telling about their experienced easily.
2.2.3.1.Recount Text
Recount text is a text to tell about something that happened in the past. Gerot and
Wignell (1994: 194) explained that “recount is to retell events for the purpose of
informing or entertaining”. Since this text tells about something that has already
happened, it is used simple past tense.
the setting and introduces participants. This paragraph introduces who, what, where, when, why, and possibly how. Events tell what happened, in what sequence. This is where the recount is told in chronological order. Reorientation is where the writer or speaker can give personal opinions about topic or event.
The factual information in a recount text must be accurate. Recount also includes personal thoughts of the writer or the speaker. When writing a recount text, it is important to write everything down in order that it happened. Recount commonly appears in the form of newspaper reports, conversations, speeches, television interviews, and retell.
2.3.Framework of the Present Study
This subchapter discusses the framework of this study.
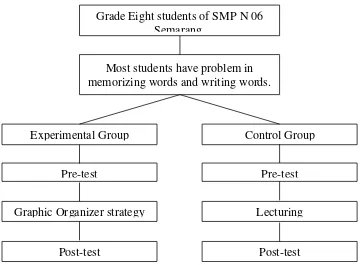
Figure 2.6 Theoretical Framework Grade Eight students of SMP N 06
Semarang.
Most students have problem in memorizing words and writing words.
Post-test
Control Group Experimental Group
Graphic Organizer strategy Lecturing
Pre-test Pre-test
29
This chapter consists of several aspects, such as research design, subject of the study, research variables, instruments of the study, procedures of collecting data, and technique of analysis.
3.1Research Design
In this research, the writer conducted a quantitative research. The method in this investigation that the writer used was a quasi experimental, that is non-randomized control group pretest-posttest design. Pre-test was given to both the control and experimental group at the eighth graders of Junior High School 6 Semarang to measure the condition before treatment. Next, the treatment was given to the experimental group by using graphic organizers while the treatment of the control group was given by lecturing. After conducting the treatment, the test is given to both groups as the post-test. The scheme of this model is:
Experimental Group Control Group In which,
T1 : pre-test for experimental group T2 : post-test for experimental group
T1 X T2
T1 T2
T1 : pre-test for control group T2 : post-test for control group
X : treatment by using graphic organizer (Isaac and Michael, 1971: 43)
3.2Subject of the Study
There were eight classes in the eighth grade of SMP N 6 Semarang. They were 8A, 8B, 8C, 8D, 8E, 8F, 8G, and 8H. Before the writer chose two classes as the experimental and control group, she collected the data of average score of English examination. Based on the data, the eight classes were equal. It can be seen on the
homogeneity of the students‟ score. Therefore, the writer chose simple random sampling to split the subject of this study. The teacher considered that the writer could choose 8A as the control group and 8H as the experimental. She considered those classes because the both classes have nearly similar score.
3.3Research Variables
Based on Creswell (2009: 59) “A variable refers to a characteristic or attribute of an individual or an organization that can be measured or observed and that varies
among the people or organization being studied”. There are two variables in this
3.3.1. Independent Variable
Nunan (1992: 25) described that “independent variable is a label given to the
variable that the experimenter expects to influence the other”. In this study, the
independent variable is graphic organizers as a strategy for teaching vocabulary.
3.3.2. Dependent Variable
Creswell (2009: 60) stated that “dependent variables are those that depend on the
independent variable; they are the outcomes or results of the influence of the
independent variable”. The dependent variable of this study is students‟
achievement in vocabulary test.
3.4Instrument of the Study
An instrument is a tool to gather data of the study. The instrument used in this study is a test. Therefore, the role of the test is important in collecting data. This is
related to the Brown‟s opinion that test is a method of measuring a person‟s
ability, knowledge or performance in a given domain (Brown, 2004: 3). In this study, the test given was observation, questionnaire, and vocabulary test. There are so many ways to test vocabulary, such as multiple choice, cloze test, matching items, set items, and others.
3.4.1 Vocabulary Test
This test will be used in both pre-test and post-test. In scoring the objective test, the correct answer is counted one point using formula:
in which, S : score;
R : total number of right answer; N : total number of item.
3.4.2 Questionnaire
Questionnaire is participants‟ answer in end of course to find out their opinion about the strategy, the strength and the weaknesses of graphic organizers, and what students had learnt from the text they discuss. This instrument was analyzed to support the effectiveness of graphic organizers after the treatment was conducted. There are 10 questions in the questionnaire, each question consists of three choices, they are disagree, agree, and strongly agree.
3.5Procedures of Collecting Data
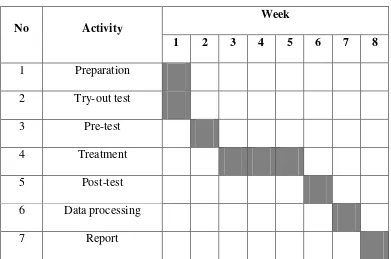
Table 3.1
The Activities of the Study
No Activity
Week
1 2 3 4 5 6 7 8
1 Preparation
2 Try-out test
3 Pre-test
4 Treatment
5 Post-test
6 Data processing
7 Report
3.5.1. Try-Out
A good or bad quality of the data is obtained based on the instrument used to collect the data. Good instrument must fulfill important qualification, those are valid and reliable. To know whether the test is valid and reliable, it had been tried out first to the students in other class beside experimental and control class.
3.5.1.1.Validity
Brown (1988: 101) said that “test validity is defined as the degree to which a test
measures what it claims to be measuring”. Every test has to be valid, it aims to provide a true measure of a particular skill which is intended to measure.
To calculate the validity of each item, the writer used the Product Moment Formula:
=
√in which,
rxy : validity of the item;
N : total number of students or subject participating;
Σх : item score;
Σх2
: the sum of the square of the item score;
Σу : total score of the item;
Σу2
: the sum of the square of the toatal score;
Σху : the sum of the item score multiplying the score (Arikunto, 2002).
3.5.1.2.Reliability
Brown (1988: 98) states that “the reliability a test is defined as the extent to
which the results can be considered consistent or stable”. If you give the same
test to the same student or matched students on two different occasions, the test should yield similar results (Brown, 2004:20).
To measure the reliability of the test, the writer used the following Kuder-Richardson formula number 20 (symbolized KR20):
=
in which,
r11 : the reliability of the test; : the number of item tes;
p : the proportion of students passing a given item;
q : the proportion of students that did not pass a given item;
∑pq : the sum of p time q;
: the total variants.
(Carmines and Zeller, 1979: 48)
In order to know the level of reliability, the result must be consulted to
significance level is 5%. If the result of r11 is higher than the „r‟ product moment, it can be said that the instrument is considered as reliable.
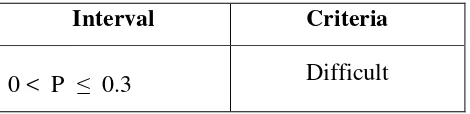
3.5.1.3.Difficulty Level
The index of item difficulty shows how easy or difficult the item is. If the index of item difficulty is high, it is considered the item is easy. If it is low, it will be considered to be difficult.
To calculate the difficulty level of an item, the writer applies the following formula:
in which,
P : the difficulty level;
B : the number of the students who answered the item correctly;
JS : the number of the students in class (Arikunto, 2002: 208).
The criteria used here are:
Table 3.2 The index of difficulty
Interval Criteria
0.3 < P ≤ 0.7 Medium 0.7 < P ≤ 1 Easy (Arikunto, 2002: 210)
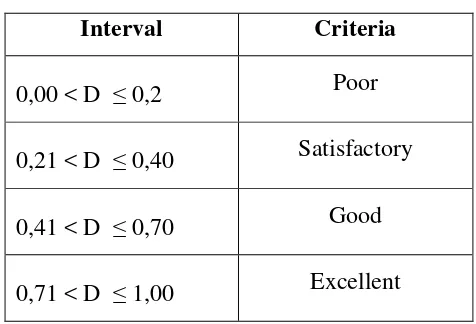
3.5.1.4.Discriminating Power
The discriminating power is used to analyze whether or not a test item has the ability to differentiate students with good mastery from students who have difficulty in understanding the material. It will measure how well the test items
arranged to identify the differences in the students‟ competence.
The following formula is used to calculate discriminating power of the test items:
in which,
D : discriminating power;
BA : the number of the students in the upper group who answered the item correctly;
BB : the number of the students in the lower group who answered the item correctly;
JA : number of all students in the upper group;
The criteria are:
Table 3.3
The index of discriminating power
Interval Criteria
0,00 < D ≤ 0,2 Poor 0,21 < D ≤ 0,40 Satisfactory 0,41 < D ≤ 0,70 Good 0,71 < D ≤ 1,00 Excellent (Arikunto, 2002: 218)
3.5.2. Pre-Test
Pre-test is an observation done before the experiment or treatment. A pre-test in
this study has purpose to know the initial students‟ vocabulary mastery. For the
pre-test, the writer will give the students a vocabulary test in the form of multiple choice and cloze test. The first part is multiple choice and the second part is cloze test which students are asked to answer all questions correctly.
3.5.3. Treatment
The treatment will be given after the pre-test is conducted. For the experimental group, the graphic organizers will be used as the strategy to learn vocabulary. Traditional method will be used for the control group in teaching vocabulary.
organizer (synonym wheel) when learning the vocabularies. In the synonym wheel, the students find the synonym of unfamiliar words and make a sentence for each word. In second meeting, venn diagram will be taught to compare two recount texts or to compare the experience of two students. In the last meeting, the writer uses concept circle. In circle maps, students are asked to think about a topic and write some words related to the topic and unrelated words. Students have to categorize the words in the concept circle. For the control group, they will be taught by using traditional method.
The control group will also be given a topic that concerned with the text. They ask to find some unfamiliar words. In this strategy the teacher using traditional method, that is lecturing, and asking the students to find the meaning of unfamiliar words. After the students have the meaning, they also ask to find the synonym and antonym. In this traditional method, the teacher only asked the students to find the meaning, the synonym and the antonym of the words and write those words on their notebook.
3.5.4. Post-Test
3.6Technique of Analysis
After collecting the data, the writer processes them statistically and then analyzed
the score to measure the students‟ improvement and achievement. The steps
which are followed, such as, analyze the scoring technique, normality, homogeneity, and then using t-test.
3.6.1. Scoring Technique
In the scoring technique, each student who answered correctly will get score 1 and who answered incorrectly will get score 0. To obtain the total score, the formula below is used:
in which, S : score;
R : total number of right answer; N : total number of item.
3.6.2. Normality
∑
in which, : normality;
: frequency of the real data; : expected frequency.
(Isaac and Michael, 1971)
3.6.3. Homogeneity
The homogeneity is to find out the homogeneity of data. The formula is:
in which,
Ve : variant of the pre-test of experimental group; Vc : variant of the pre-test of control group.
If the F hitung < F table, it can be concluded that the data of the pre-test is homogeny (Arikunto, 2006:324).
3.6.4. T-test Statistical Analysis
√
in which,
S : standard deviation; S2 : variance;
: the number of the students / subject participating in the test in experimental group;
: the number of the students / subject participating in the test in control group.
To find out the t-value of the significant difference between the means of the post-test of two groups, the formula used is as follows:
̅ ̅ √
in which,
t : t-value;
X1 : the average score of experimental group; X2 : the average score of control group; S1 : standard deviation of experimental group; S2 : standard deviation of control group;
: the number of the students / subject participating in the test in control group.
44
In this chapter, the data of the research result will be presented and analyzed. The data are try-out, pre-test, and post-test result. After presenting all of the data, the writer, first, is analyzing the result of the try-out test. The second is analyzing the result of pre-test, treatment activities, post-test, difference of the two tests, t-test statistical, and discussion of research findings.
4.1. Try-out Analysis
The try-out test was conducted to find out the validity and the reliability of the instrument before it was used as the instruments of the test. This test was conducted on September 11, 2015. It was held in out of the classes under investigation. There were 31 students in that class. The try-out test is available in Appendix 1.
4.1.1. Validity
The following is the example of counting the validity of item number 2. The value of rxy is as follows:
rxy =
√
rxy =
√
rxy = 0.722
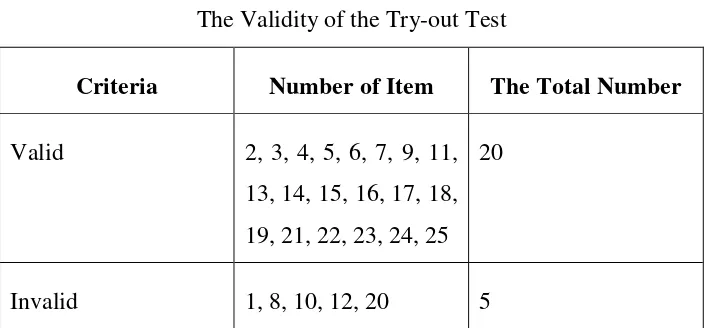
The item number 2 of the try-out test was valid since its rxy = 0.722 was higher than critical value (0.343). The analysis of the other items was presented in the following table:
Table 4.1
The Validity of the Try-out Test
Criteria Number of Item The Total Number
Valid 2, 3, 4, 5, 6, 7, 9, 11, 13, 14, 15, 16, 17, 18, 19, 21, 22, 23, 24, 25
20
Invalid 1, 8, 10, 12, 20 5
4.1.2. Reliability
A good instrument has to be valid and reliable. The test is reliable if the result of r11 is greater than rtable. In this computation, the writer used Kuder-Richardson formula number 20 (KR20) and the result showed that the r11 was 1.060 for α = 5%, N = 31, and the rtable was 0.343.
The following is the computation of reliability of try-out test:
r11 =
r11 =
(
)
r11 = 1.060
The computation of the try-out test was reliable since the r11 (1.060) was greater than rtable (0.343). The computation of reliable can be seen in Appendix 5.
4.1.3. Difficulty Level
The difficulty level is counted to know the level of the test items. If the index of item difficulty is high, it is considered the item is easy. If it is low, it will be considered to be difficult.
The following is the computation of difficulty level of item number 2 in the try-out instrument:
P =
P =
Based on the computation, the difficulty level of item number 2 was medium. It means that the item was not too easy or too difficult. The result of classification of item difficulty can be seen in the following table:
Table 4.2
Item Difficulty of the Test
Criteria Number of Item
Difficult 20
Medium 1, 2, 3, 10, 11, 12, 13, 15, 17, 22
Easy
4, 5, 6, 7, 8, 9, 14, 16, 18, 19, 21, 23, 24, 25
From the table above it was found that 1 item was said as difficult item, 10 items were said as medium items, and 14 items were said as easy items. The complete computation of the difficulty level can be seen in Appendix 7.
4.1.4. Discriminating Power
Discriminating power will measure how well the test items arranged to identify
the differences students‟ competence. The following is the computation of
discriminating power of item number 2: D =
D =
According to the computation, the item number 2 was good so that it can be used as the instrument. The classification result of discriminating power can be seen in the following table:
Table 4.3
Discriminating Power of the Test
Criteria Number of Item
Poor 1, 7, 8, 10, 12, 16, 20
Satisfactory 4, 5, 9, 14, 18, 19, 22, 23, 25
Good 2, 3, 6, 11, 13, 15, 17, 21, 24
From the table above, it was found that 7 items were classified to be poor, 9 items were classified to be satisfactory, and 9 items were classified to be good. The complete computation of discriminating power can be seen in Appendix 6.
4.2. Pre-test Analysis
The pre-test was conducted on September 15, 2015 for the control group and on September 16, 2015 for the experimental group. This pre-test was held in the first
meeting and was conducted to know the initial condition of students‟ achievement
4.2.1. Homogeneity of the Pre-test of Experimental and Control Group
The computation of homogeneity was needed to find out the similarity of both experimental and control group in their English vocabulary achievement. If the results of homogeneity of experimental and control group are not homogeny, the treatment cannot be conducted because homogeneity influences the test result and they do not have the same ability in vocabulary achievement.
The homogeneity of pre-test of experimental and control group was presented as follows:
F =
F =
F = 1.33
The value of F table with dk numerator V1 = n1 – 1 = 31 – 1 = 30, dk denominator V2 = n2 – 1 = 31 – 1 = 30 and α = 5%, squared to V1 = 31 and V2 = 31 is 1.83.
4.2.2. Normality of the Pre-test of the Experimental Group
The normality was counted to know whether the group is normally distributed. If the scores are not normal, the treatment cannot be conducted because they do not have same average in vocabulary achievement.
Based on the data of normality, the X2 value of pre-test of experimental group was 2.86. Besides that, the computation of X2 table was X2(α)(dk) = X2 (5%) (3) = 7.82. It showed that the X2 value < X2 table then pre-test score for experimental group was said to be normally distributed. The complete computation of normality can be seen in Appendix 15.
4.2.3. Normality of the Pre-test of the Control Group
Based on the data computation, the normality of pre-test of control group showed that the X2 value was 7.65. Then, the writer computed the X2 table. The computation of X2 table was X2(α)(dk) with α = 0.05 and dk = 3. Since the data of normality (X2) was lower than the X2 table (7.65 < 7.82), the data were considered to be normally distributed. The computation of normality can be seen in Appendix 16.
4.3. Treatment Activities
organizers. For the control group, the treatment was given by lecturing. The schedule of the research can be seen in the following tale:
Table 4.4
The Schedule of the Research
understanding recount text and third meeting was making a recount text. Here is the activity of the research.
Table 4.5
The Activity of the Research
Activity Experimental Group Control Group
Pre-test
Teacher gave the vocabulary test that consisted of 20 questions
Teacher showed a recount text.
The students read the recount text.
The students wrote some unfamiliar words in graphic organizer.
The students elaborated on their graphic organizer (Synonym Wheel) with the synonym of those words and also with some examples of simple sentence based on those words.
Teacher showed a recount text.
The students read the recount text.
The students wrote some unfamiliar words in their book.
Second treatment
(Understanding
recount text)
Teacher asked students to tell their experience with their partner.
Students listened to and understood the experience
Students listened to and understood the unrelated with the topic by using graphic organizer unrelated with the topic.
Students made a of 20 questions. The writer
used the same questions as the pre-test, but the position of question numbers were reshuffled.
The writer used the same questions as the pre-test, but the position of question numbers were reshuffled.
4.4. Post-test Analysis
The post-test was held after the treatment given. The post-test for control group was conducted on October 20, 2015 and the post-test for experimental group was on October 21, 2015. The post-test consisted of 20 questions. The writer used the same question as the pre-test, but the question numbers were reshuffled (see Appendix 11).
4.4.1 Homogeneity of the Post-test of Experimental and Control Group
Before the t-test was computed, the homogeneity of the post-test of both experimental and control group had to check. The homogeneity of the post-test was important since it influenced the t-test result.
The following are the computation of the homogeneity of post-test: F =
F =
The value of F table with dk numerator V1 = n1 – 1 = 31 – 1 = 30, dk denominator V2 = n2 – 1 = 31 – 1 = 30 and α = 5%, squared to V1 = 31 and V2 = 31 is 1,83.
The result showed that the experimental and the control group were homogenous since the f-value (1.19) was lower than f table (1.83). By knowing the result of homogeneity test (1.19<1.83), the writer concluded that the t-test could be counted. The computation of post-test of homogeneity can be seen in Appendix 17.
4.4.2 Normality of the Post-test of the Experimental Group
The normality of the data should be checked before the writer counted the t-test. If the scores are not normal, the t-test cannot be counted because they do not have same average in vocabulary achievement.
Based on the data of normality, the X2 value of post-test of experimental group was 5.09. Besides that, the computation of X2 table was X2(α)(dk) = X2 (5%) (3) = 5.99. It showed that the X2 value < X2 table then post-test score for experimental group was said to be normally distributed. The complete computation of normality can be seen in Appendix 18.
4.4.3 Normality of the Post-test of Control Group
of normality (X2) was lower than the X2 table (5.77<5.99), the data were considered to be normally distributed. The computation of normality can be seen in Appendix 19.
4.5. T-test Statistical Analysis
The result of the t-test became the proof whether the difference of pre-test and post-test mean of both groups was significant. However, the standard deviation should be counted first. The computation is as follow:
S = √
S = √ S = 16.58
Then, to find out t-value substituting the values into the equation:
t = √ ̅ ̅ √
t = √ √
t = 2.14
4.6. Questionnaire Analysis
The writer gave the participants a questionnaire after the treatment was conducted. The questionnaire was given to the experimental group who got the treatment (Graphic Organizers). The questionnaire was analyzed by determining the score for each choice, disagree was 1, agree was 2, and strongly agree was 3.
After the writer calculated the all scores, she found that the highest score of the effectiveness of graphic organizers was 72.04% in the question number 10 and the lowest percentage of the effectiveness of graphic organizers was 65.59% in the question number 6. Base on the calculation, it can be concluded that 72.04% of the participants agree that graphic organizers helped them in understanding recount text and only 65.59% of the participants agree that graphic organizers facilitated them to make a sentence.
4.7. Discussion of the Research Findings
This study is meant to answer the research problem. It was to find out the effectiveness of using graphic organizers for teaching vocabulary of recount text for the eighth graders of SMPN 6 Semarang in the academic year 2015/2016.
After conducting the treatment, the computation of the mean score of experimental group was higher than the control group. The mean score of experimental group was 83.55 and for the control group was 74.52. It indicated that after getting treatment, the experimental group was achieved better result than the control group.
Another result of the computation shows that the result of t-value is 2.14 and t-table is 2.00. It can be seen that t-value > t-table. The conclusion is there is
significant difference between the students‟ achievement in vocabulary.
Therefore, the hypothesis stating that „Graphic organizers are effective for
teaching vocabulary to the grade eight students of SMPN 6 Semarang.‟ is
accepted.
59
This chapter deals with the conclusions and suggestions of this research. The conclusions are presented to make the result of this research become clearer and the suggestions are given for every reader so that they will be able to take benefit of this research.
5.1. Conclusions
Based on the investigation of chapter IV, the conclusions can be stated that graphic organizers make a significant difference in vocabulary achievement for grade eight students by calculating the t-test (2.14) which is higher than the t-table (2.00).
Graphic organizers are effective as a strategy in teaching vocabulary for grade eight students of SMPN 6 Semarang in the academic year 2015/2016. Based on the research, graphic organizers are more effective than lecturing in improving
the students‟ active vocabulary. Graphic organizers can be used for individual or
group and can be used to help students organizing their note.
5.2. Suggestions
other studies. Pedagogically, the result of this study is useful to inform the the
readers about graphic organizers to improve students‟ vocabulary.
Practically, English teacher are expected to implement graphic organizers as a strategy for teaching vocabulary. These graphic organizers are easy to use because both English teacher and students can use graphic organizers by drawing or printing from some resources. These graphic organizers also help teachers to
know the students‟ mastery of vocabulary. It is hopefully for students to apply