SEMINAR AND EXAMINATION
M.Sc in Information Technology for Natural Resources Management (MIT for NRM)
Bogor Agricultural University
Student :Tran Xuan Sang
StudentID :G051048041
Research Title :Web-Based GIS Information System for Tourism (Case study: East Java Indonesia)
The Advisory board
Supervisor :Dr. Ir. Kudang Boro Seminar, M.Sc
Co-supervisor :Dr. Ir. Yuli Suharnto External Examiner :Dr. Gatot H. Pramono
Day/date :Monday, April 24, 2006
Time :14.00-15.00
STATEMENT
I, Tran Xuan Sang, here by stated that this thesis entitled:
WEB-BASE GEOGRAPHIC INFORMATION SYSTEM FOR TOURISM
CASE STUDY: EAST JAVA INDONESIA
Are results of my own work during the period of January until May 2006 and that it has not been published before. The content of the thesis has been examined by the advising committee and external examiner.
Bogor, May 2006
ACKNOWLEDGMENT
This study could not be have been realized without the assistance, suggestions and supports of many individuals and organizations, that I would like to express my deep gratitude to all of them.
I would like to thank to ASEAN FOUNDATION and SEAMEO BIOTROP for giving me scholarship to come to Indonesia and follow this programme and Prof. Dr. Nguyen Kim Duong for giving me information about scholarship.
I would like to thank to Dr. Kudang Boro Seminar, my primary supervisor and Dr. Yuli Suharnoto, my co-supervisor for giving me excellent guidance and useful ideas.
I would like to thank to Dr. Tania June and Dr. Gatot H. Pramono as the examiner of this thesis for their positive ideals and inputs.
I would like to thank to Atlas Center BAKOSURTANAL - Indonesia for giving me the data for my research.
I would like to thank to all lecturers in MIT for giving me knowledge. I would like to thank to all the staffs in MIT and BIOTROP for the various services rendered.
To all my friends and my classmates, I would like to thank for their kindly help.
CURRICULUM VITAE
Tran Xuan Sang was born in Vinh city, Nghe An Province, Vietnam at December 04, 1981. He received his bachelor’s degree from Vinh University in 2003 at Information Technology Department. From 2003 to present, he works as assistant lecturer at the Department of Information Technology, Vinh University.
ABSTRACT
TRAN XUAN SANG (2006). Web-Based Geographic Information System for Tourism (Case study of East Java Indonesia). Under the supervision of KUDANG BORO SEMINAR and YULI SUHARNOTO.
The objective of this research is to build Web-based GIS Information System that provides spatial and non-spatial tourism information via Internet environment.
To reach the goal of this research, there are several activities that should be done. The first activity is design tourism database. This database has two types of data: non-spatial and spatial. Physically, Non-spatial data will be stored in Mysql DBMS. Spatial data will be stored in ESRI Shape format. The second activity is design Web-based GIS user interface to allow tourist to communicate with system. This activity is conducted by using HTML code, Java Script, and MacroMedia Flash. The last activity is to construct programming code to deal with tourism database. PHP programming language was used to access non-spatial data. MapServer and PhpMapScript was used to access non-spatial data.
TABLE OF CONTENTS
Page
STATEMENT... ...i
ACKNOWLEDGMENT...ii
CURRICULUM VITAE. ...iii
ABSTRACT. ...iv
TABLE OF CONTENTS...v
LIST OF FIGURE ...ix
LIST OF TABLE ...xi
LIST OF APPENDIX ...xii
I. INTRODUCTION ... 1
1.1. BACKGROUND... 1
1.2. OBJECTIVE... 3
II. LITERATURE REVIEW ... 4
2.1. GEOGRAPHIC INFORMATION SYSTEM... 4
2.2. THE RELATED RESEARCH... 5
2.2.1. Multimedia Tourism Information in Bakosurtanal ... 5
2.2.2. Web Tourism Information from East Java Tourism Department... 5
2.2.3. Available Web-Based GIS... 6
2.2.3.3. Demis ... 7
2.2.3.4. Chameleon... 8
2.3. WEB-GIS TECHNOLOGY... 9
2.3.1. Web-GIS Architecture... 9
2.3.1.1. Typical Architecture ... 9
2.3.1.2. Thin Client Architecture ... 11
2.3.1.3. Thick Client Architecture... 12
2.3.2. Geo Data Transfer... 13
2.3.3. Web Map ... 15
2.3.4. Web-GIS Development Cycle... 16
2.3.5. Web GIS Advantage & Disadvantage ... 17
2.3.5.1. Advantage... 17
2.3.5.2. Disadvantage ... 17
2.4. AVAILABLE WEB-GIS SOFTWARE COMPONENT... 18
2.4.1. MapServer 4.8 ... 18
2.4.2. ArcView Internet Map Server... 19
2.4.3. Autodesk MapGuide 4.0... 19
2.4.4. Intergraph Geomedia Web Map 3.0... 19
2.5. DATABASE... 20
2.6. DATABASE MODEL... 20
2.6.1. Relational Model ... 20
2.6.2. Hierarchical Model ... 21
2.6.3. Network Model ... 21
III. RESEARCH METHODOLOGY... 23
3.1. TIME AND LOCATION OF STUDY... 23
3.2.WEB GIS DEVELOPMENT CYCLE... 24
STEP 1. REQUIREMENT ANALYSIS... 25
Step 1.1. User Identification ... 25
Step 1.2. User Needs ... 25
Step 1.3. Required Data ... 26
STEP 2. CONCEPTUAL DESIGN... 26
STEP 3. HARDWARE AND SOFTWARE SURVEY... 28
Step 3.1. Hardware ... 29
Step 3.2. Software... 30
STEP 4. DATABASE DESIGN AND CONSTRUCTION... 31
Step 4.1. Non-Spatial Database Design ... 31
Step 4.1.1. Conceptual Design ... 32
Step 4.1.2. Logical Design... 33
Step 4.1.3. Physical Design ... 33
Step 4.2. Spatial Database Design... 34
Step 4.2.1. Conceptual Design ... 34
Step 4.2.2. Logical Design... 35
Step 4.2.3. Physical Design ... 35
STEP 5. ACQUISITION OF GIS SOFTWARE AND HARDWARE... 35
STEP 6. WEB GIS SYSTEM INTEGRATION... 35
STEP 7. APPLICATION DEVELOPMENT... 36
IV. RESULT AND DISCUSSION ... 37
4.1. SYSTEM ARCHITECTURE... 37
4.2. QUERY WORK FLOW... 39
4.2.1. Processes Involved when Interacting with Map (Spatial Data)... 39
4.2.2. Processes Involved when Accessing Non-Spatial Data... 40
4.3. DATABASE DESIGN... 41
4.3.1. Non-Spatial Database Design... 41
4.3.1.1. Conceptual Design... 41
4.3.1.2. Logical Design... 42
4.3.1.3. Physical Design ... 43
4.3.2. Spatial Database Design ... 45
4.3.2.1. Conceptual Design... 45
4.3.2.2. Logical Design... 46
4.3.2.3. Physical Design ... 46
4.4. SETTING UP SOFTWARES AND HARDWARE COMPONENTS... 48
4.5. IMPLEMENTATION... 49
4.5.1. Web User Interface... 49
4.5.2. Function of System ... 49
4.5.2.1. General Information... 50
4.5.2.2. Quick Travel Planning ... 50
4.5.2.3. Tourism Information... 53
4.5.2.4. Tourism Digital Map... 54
4.5.2.5. Tourism Facility ... 57
4.6. SYSTEM TESTING... 59
4.7. DISCUSSION... 59
4.7.1. Problem with Completing Tourism Data... 59
4.7.2. Problem with Updating Spatial Data ... 59
4.7.3. Problem with Speed of Internet... 60
V. CONCLUSION AND RECOMMENDATION ... 61
5.1. CONCLUSION... 61
5.2. RECOMMENDATION... 62
LIST OF FIGURE
FIGURE 2.1. MAPZOOM INTERFACE ... 6
FIGURE 2.2. MAPIT INTERFACE ... 7
FIGURE 2.3.DEMIS INTERFACE ... 7
FIGURE 2.4. CHAMELEON INTERFACE... 8
FIGURE 2.5. TYPICAL ARCHITECTURE ... 10
FIGURE 2.6. THIN CLIENT ARCHITECTURE ... 12
FIGURE 2.7. THICK CLIENT ARCHITECTURE ... 13
FIGURE 2.8. WEB-GIS DEVELOPMENT CYCLE... 16
FIGURE 2.9. MAPSERVER ARCHITECTURE ... 18
FIGURE 3.1. RESEARCH LOCATION... 23
FIGURE 3.2. HISTORICAL AND NATURAL OBJECTS... 24
FIGURE 3.3. WEB GIS DEVELOPMENT CYCLE ... 24
FIGURE 3.4. WEB GIS ARCHITECTURE ... 27
FIGURE 3.5. NON-SPATIAL DATABASE DESIGN STEP ... 31
FIGURE 4.1. CONCEPTUAL SYSTEM ARCHITECTURE... 37
FIGURE 4.2. QUERY WORKFLOW... 39
FIGURE 4.3. NON-SPATIAL ENTITY RELATIONSHIP DIAGRAM... 41
FIGURE 4.4. SPATIAL ENTITY RELATIONSHIP DIAGRAM... 45
FIGURE 4.5. PHYSICAL MODEL IN ESRI SHAPE FORMAT ... 48
FIGURE 4.6. WEB USER INTERFACE... 49
FIGURE 4.7. GENERAL INFORMATION IN EAST JAVA... 50
FIGURE 4.9. RESULT OF TRAVEL PLANNING... 51
FIGURE 4.10. INFORMATION OF SEARCHING OBJECT... 52
FIGURE 4.11. LOCATION OF SEARCHING OBJECT... 52
FIGURE 4.12. MAP LAYOUT... 53
FIGURE 4.13. MARINE AND BEACH TOURISM OBJECT... 54
FIGURE 4.14. ONLINE MAP INTERFACE IN HTML MODE... 54
FIGURE 4.15. ONLINE MAP INTERFACE IN JAVA MODE... 55
FIGURE 4.16. SEARCH OBJECT FORM... 56
FIGURE 4.17. SEARCH OBJECT MAP... 56
FIGURE 4.18. HOTEL SEARCH FORM... 57
FIGURE 4.19. HOTEL SEARCH RESULT... 57
FIGURE 4.20. LOCATION OF HOTEL... 58
LIST OF TABLE
TABLE 3.1. USER NEEDS... 26
TABLE 3.2. REQUIRED DATA... 26
TABLE 3.3. SOFTWARE SURVEY... 29
TABLE 3.4. SOFTWARE REQUIREMENT... 30
TABLE 3.5. CAPABILITY OF MYSQL... 31
TABLE 4.1. NON-SPATIAL LOGICAL DESIGN... 42
TABLE 4.2. NON-SPATIAL PHYSICAL DESIGN... 45
TABLE 4.3. SPATIAL LOGICAL DESIGN... 46
LIST OF APPENDIX
APPENDIX 1: STRUCTURE OF TOURISM DATABASE IN MYSQL DBMS... 65
APPENDIX 2: CONTENT OF TABLE AGRO... 65
APPENDIX 3: CONTENT OF TABLE AIRLINE... 66
APPENDIX 4: CONTENT OF TABLE BANK... 66
APPENDIX 5: CONTENT OF TABLE BEACH... 67
APPENDIX 6: CONTENT OF TABLE CULTURAL... 67
APPENDIX 7: CONTENT OF TABLE HANDICRAFT... 67
APPENDIX 8: CONTENT OF TABLE HISTORY... 68
APPENDIX 9: CONTENT OF TABLE HOTEL... 68
APPENDIX 10: CONTENT OF TABLE PARK... 68
Web-Based GIS Information System for Tourism
1(Case study: East Java Indonesia)
Tran Xuan Sang2, Kudang Boro Seminar3, Yuli Suharnoto4
ABSTRACT
The objective of this research is to build Web-based GIS Information System that provides spatial and non-spatial tourism information via Internet environment. To reach the goal of this research, there are several activities that should be done. The first activity is design tourism database. This database has two types of data: non-spatial and spatial. Physically, Non-spatial data will be stored in Mysql DBMS. Spatial data will be stored in ESRI Shape format. The second activity is design Web-based GIS user interface to allow tourist to communicate with system. This activity is conducted by using HTML code, Java Script, and MacroMedia Flash. The last activity is to construct programming code to deal with tourism database. Php programming language was used to access non-spatial data. Mapserver and phpmapscript was used to access spatial data. The result of this research is a Web-based GIS tourism information system, which provides tourism information with interactive online tourism map.
Key Word: Web-Based GIS, Tourism Information System, Online Map.
I. Introduction 1.1. Background
Tourism industry is one of important factors of the economy. In some countries, the economy significantly depends on tourism industry. The share of tourism in international gross national income is 6% and in world investments 7%. (Batir Mirbabayev, 2004).
East Java Indonesia has many existing and potential tourism objects, which include historical remains, natural features, and man-made attraction places.
The development of tourism industry depends on visitors. The more visitors come, the more benefit is obtained. In order to increase amount of tourist, the promotion is the most important.
1
The paper is part of thesis, submitted at seminar and examination of MIT for NRM program
2
MIT for NRM student, Bogor Agricultural University
3
There are many promotion ways, and Web-based GIS is one of them. Web-based GIS is a cheap and effective technology to promote tourism information for widespread of people with time constraint.
The study presented in this paper starts from the user needs, to present the tourism object in geographic context on interactive tourist maps supports planning for tourism, focusing on decisions making and management using GIS technique and presenting the results on the internet.
1.2. Objectives
The main objective of this research is to build Web-based GIS Information System that provides spatial and non-spatial tourism information via Internet environment.
II. Literature review
2.1. Geographical Information System. 2.2. Web-GIS Technology
2.3. Available Web-GIS Software Component 2.4. Database
2.5. Database Model
III/ Research Methodology 3.1. Time And Location of Study
This research is conducted from January to June 2006 at Bogor Agricultural University. The location of study is East Java – Indonesia.
3.2. User Identification
There are two categories of user: tourist and manager.
3.3. User Needs
What needs of uses can be shown as questionnaire list below:
Tourism Manager
- Where is the city, state or country located?
- What is the climate? It has warm or cold weather?
- When is the best time of year to visit? - Where are the hotels and guesthouse in
- Where are areas that tourists are interested in?
- What are the physical-geographic Characteristics of those areas?
the city located? What is their classification?
- What kinds of public transportation are available?
- Where are the cultural/natural showing located?
- What attractive places are near hotel? - Where are the banks?
- Where are the shopping centers?
socio-economic characteristics of the local population of each tourist space?
- What infrastructure services are in current and potential tourism areas?
- What's about service quality? - What are the tourism demands for tourism service?
3.4. Required Data
There are two types of data used in this research: Non-spatial tourism data, spatial tourism data (road, tourism object, administrative boundary, tourism facility, etc).
3.5. Required Tools
Hardware: PC Mobile AMD processor 2800+, 512 MB DDR RAM, 40 GB Harddisk.
Software: AutoCAD Map 2000i, ArcView GIS 3.3, Map Server 4.4, PhpMapScript 4.4, Apache version 2.0.5, PHP version 4.3.7, Mysql 4.1.9, PhpMyAdmin 2.6.1, Microsoft FrontPage 2000, MacroMedia Flash MX, Javascript.
3.6. Methods
3.6.1. Web-GIS Development Cycle
This system was analyzed and designed based on Web-GIS Development Cycle.
Client
PHP Pages, Java Script, Java Applet, and MacroMedia flash
Shape File
3.6.2. Conceptual System Architecture
Figure 2. Conceptual System Architecture . 3.6.3. Query Work Flow
Figure 3. Query Work Flow
IV. Results And Discussion
4.1. Web-based GIS tourism Information System
Web-Based GIS for tourism was constructed by using several softwares such as php, mapserver, mysql, etc.
Figure 4. Web User Interface
4.2. Digital tourism map
In this digital map, user can turn on/off map layer, can zoom in/out/full or pan the map. User also can query by click into the object on the map to get information about this object. User also can search location of object by select the name of object.
4.3. Tourism Facility
This function of system provides information of services and accommodation such as tourism office, hotel, travel agency, flight schedule, train schedule, and bank & moneychanger. For example, if tourists are looking for the hotel, just simply click on link
Hotels. The hotel search form will appear.
Figure 6. Hotel search form
Selecting regency and class of hotel, tourist will find out the hotel that they are looking for.
Figure 7. Hotel search result
Tourist want to know the location of these hotels, just simply click on Show map.
4.4. Quick travel planning
This function of system help tourism to decide quickly where they should visit with time constraint. Under here is an example of processing of this function. Tourist clicks on the link quick travel planning. The input form will appear.
Figure 9. Quick travel planning form
Tourist selects regency, tourism object and visiting time, after that click on search button to view the tourism object that satisfies requirements. The results will show up.
Figure 10. Result of travel planning
In this result panel, tourists are possible to see more information about this tourism object and also possibly for seeing digital map.
V. Conclusion and recommendation 5.1. Conclusion
Web-based GIS information system for tourism was designed and implemented with the real tourism data in East Java Indonesia. This system has been tested in Intranet and Internet environment to estimate the performance of system. These performances are acceptable when it runs in high speed Internet connection.
There are some important points related to this research:
- This system has been designed and implemented by integrating two technologies: Internet and GIS.
- The tourism map is general dynamically with interactive interface, and online map offer a variety of trend-setting functionalities such as integration of raster images and text, high performance zooming, panning and querying.
- When people serve and publish data on the Internet, other people can access and browse these data simultaneously. Because of this, GIS on the Web is an in precious method for reaching a vast audience. It offers to the tourist more exact and more meaningful information to meet their quality claims.
- This system has been tested in Internet environment with address:
http://sang.harry.or.id/. 5.2. Recommendation
There are several activities that should be done for further work, namely:
- To improve the accuracy of tourism data both in non-spatial and spatial.
- To enhance the capability of system. The system should have a function that allows administrator to update spatial data without touching in programming code.
- To optimize the accessing spatial data in order to get faster speed. The spatial data can be stored in other format that allows to access data faster.
Forschung, Trends und Fakten; 2002 Available from http://www.web-tourismus.de. MARSHALL, J., 2000, Developing Internet-Based GIS Applications, Proceedings of the Twentieth Annual ESRI User Conference, July 26-30,2000 Available from http://gis.esri.com/library/userconf/proc00/professional/papers /PAP405/p405.htm
O’Brien, J.A. 1999. Management Information Systems: Managing Information Technology in Internet Worked Enterprise. The McGraw-Hill Companies, Inc. New York.
I. INTRODUCTION
1.1. Background
Tourism industry is one of important factors of the economy. In some countries, the economy significantly depends on tourism industry. In the modern world tourism is one of the largest and dynamically developing sectors of external economic activities. Its high growth and development rates, considerable volumes of foreign currency inflows actively affect various sectors of economy, which positively contributes to the development of own tourism industry. The share of tourism in international gross national income is 6%, in world investments 7%, in world customary expenditures 11% (World Tourist Organization, 2002).
Indonesia is the largest archipelago in the world, stretching 5.110 km along the equator from east to west and 1.888 km from north to south. The chain of islands divides the Indian and Pacific Oceans and is enriched with natural resources and diverse cultures, offering a vast range of tourism activities. It has long been a popular tourist destination. The number of foreign visitors in 1997 was 5.2 million, contributing around 6.6 billion US$ to foreign income - about 3 % of GDP (World Bank, 2002). In 2005, the number of arrivals from abroad is expected to be around 11 million, generating foreign currency receipts of over $15 billion.
Majapahit Kingdom with Gadjah Mada, the great heroic. The remains of the Kingdom can still be found now and become an interesting object for people or society who like archaeological. Beside the historical remains such as temples, monuments, and kings of ancient era, there can also be found natural places that have interesting panorama, including the beauty of the beaches, mountain, caves, arts and cultures, which are varied and able to attract tourists.
The development of tourism industry depends on visitors. The more visitors come, the more benefit is obtained. In order to increase amount of tourist, the promotion is the most important. The promotion will transfer tourism information to the tourist and make them awareness. There are many promotion ways, and Web-based GIS is one of them. Web-based GIS is a cheap and effective technology to promote tourism information for widespread of people with time constraint.
Web-based GIS is integration between two technologies: Internet and GIS. One of the most important aspects of the Internet is the near limitless exchange and free flow of data and information that can be distributed. The Internet presents a perfect platform that brings products and services to the customer.
values and services. Information technology is having a big effect on major sectors of tourism. Tourists have problems to find what they are looking for, especially in reference to the geographic position of the object and its surroundings. In most cases, it is not satisfying to find a nice hotel without a reference to restaurants, sights or event locations located nearby.
There are two categories for the use of Web-based GIS in tourism: public information and management. By using web-based GIS, the tourist can know geographic information about a place before they go there. They want to know where things are located, what amenities are available, what the climate is like, and be able to do site specific searches to find information. The other user is in management side. Management may be done by individual operators, a tourism group, or by local government. Management users want to query the system for where customers are coming from, their socio-economic backgrounds, and good potential locations for new tourism sites.
The study presented in this paper starts from the user needs, to present the tourism object in geographic context on interactive tourist maps supports planning for tourism, focusing on decisions making and management using GIS technique and presenting the results on the internet.
1.2. Objective
II. LITERATURE REVIEW
2.1. Geographic Information System.
GIS is a System of computer software, hardware, data, and human to help manipulate, analyze and present information that is tied to a spatial location, which is usually a geographic location. A geographic Information System (GIS) is a powerful tool for handling spatial data. It is used for storing, retrieving, maintaining, manipulating, analyzing, and producing the digital format of spatial data. Moreover, it could produce a spatial data in a hard-copy format (Aronoff, 1991).
In GIS environment, there are two types of common data that should be taken into account, spatial data and non-spatial data (United Nations, 1996). Spatial data provides information about the feature referred to geometrical orientation, size, and relative position from other features (United Nations, 1996). Non-spatial data is complementary information to spatial data, which provides some further information (United Nations, 1996).
A GIS is most often associated with a map view. A map, however, is only one of the following three ways you work with geographic data in a GIS.
• The Database View
• The Map View
It is a set of intelligent maps and other views that show features and feature relationships on the earth's surface. Maps of the underlying geographic information can be constructed and used as windows into the database to support queries, analysis, and editing of the information. This is called geo-visualization.
• The Model View
It is a set of information transformation tools that derive new geographic datasets from existing datasets. These geo-processing functions take information from existing datasets, apply analytic functions, and write results into new derived datasets. Together, these three views are critical parts of an intelligent GIS and are used at varying levels in all GIS applications.
2.2. The Related Research
2.2.1. Multimedia Tourism Information in Bakosurtanal
Atlas center in Bakosurtanal Indonesia has completed one project about tourism information in East Java. The result of the research is computer software that provides tourism information in East Java. The software was built based on Macromedia environment with pictures and video file. It also provides these maps of tourism object. These maps can be zoomed but it is not an interactive map. It means the map cannot be clicked or queried. This system cannot run in network environment. So the tourism information cannot be distributed easily.
2.2.2. Web Tourism Information from East Java Tourism Department.
unable to show tourism information with the map of interested objects. The address of this web site is http://www.eastjava.com.
2.2.3. Available Web-Based GIS
2.2.3.1. Mapzoom
This is one of research that was conducted by Computer Science at the University of Rochester.
Figure 2.1. Mapzoom Interface (http://www.cs.rochester.edu/7egildea/map)
Capability
This Web-Based GIS produces static web maps with map image prepared beforehand. CGI script is used to zoom and pan the map. The advantage is fast data processing.
2.2.3.2. Mapit
Figure 2.2. Mapit Interface (http://www.mapit.de/index.en.html)
Capability
This Web-GIS was designed based on thick-client architecture. The Server provides raster data and the client using plug-in to display the map.
2.2.3.3. Demis
This Website was developed to support analysis and decision support projects in the field of water, traffic, air and energy. This focus has been to develop map based user interfaces.
Capability
The map display by using Macromedia Flash technology with allow animation appear in Web browser. This map can be zoom in/out, queried point.
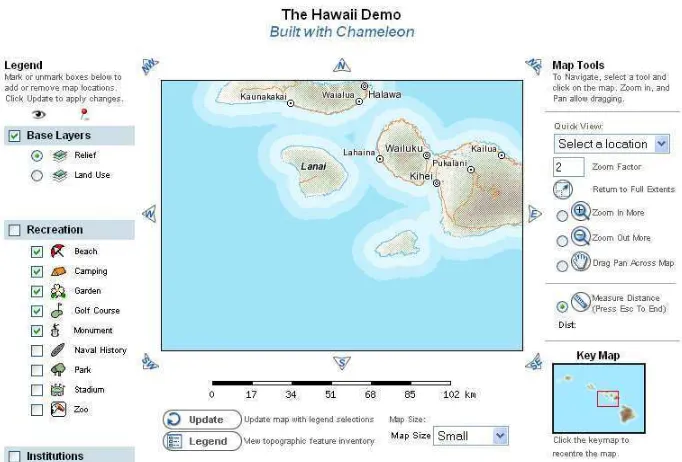
2.2.3.4. Chameleon
Chameleon is a distributed, highly configurable, environment for developing Web Mapping applications. It is built on MapServer as the core-mapping engine and works with all MapServer supported data formats through a regular MAP file.
Figure 2.4. Chameleon Interface (http://chameleon.maptools.org)
Capability
fixed piece of functionality, but the representation of the widget is normally highly configurable.
2.3. Web-GIS Technology
Internet GIS, as the name suggests, relies on the wired or wireless Internet to communication. Web GIS is a Geographic Information System distributed across a networked computer environment to integrate, disseminate, and communicate geographic information visually on the World Wide Web over the Internet.
2.3.1. Web-GIS Architecture
2.3.1.1. Typical Architecture
In the architectural system of Web GIS, this service is similar to the client/server architecture of the Web. The geo-processing breaks down into a server-side and client-side task.
Figure 2.5. Typical Architecture (Peng, 1997; Plewe, 1997, p.5)
The interface consists of WWW pages with HTML forms, which interact with the WWW server through CGI requests. This requires all functionality to reside at the server, reducing user friendliness, as every little function requires a network transmission and thus, increased network traffic and time delays between user and server. The forms are combined with images functioning as buttons and image-maps to provide the user functionality that includes data retrieval and image manipulation.
Web Server and Data Server: Internet server is software, which provides GIS functionality to users over the Internet. Data server is used to store data. It can be updated and secure (Finley et al., 1998).
A map server is a component that generates maps, fulfills spatial queries, and delivers symbolized maps. A client based on the user's request. The map server can be split into smaller parts to provide specific services. That is, each server could be specialized into one particular function or service.
A map server generally has seven basic functions (OpenGIS WMS specifications):
• To answer basic queries about the content of the map and the attribute of spatial features.
• To extract data from a database based on the criteria on the user's request.
• To perform spatial analysis such as buffering, feature overlay, spatial search, and network analysis.
• To communicate with other programs about the availability of services and data, such as what maps it can procedure and which of those can be queried further.
• To provide an interface for associating default symbols with a data set for use by clients with data publishing capability.
• To invoke other map servers to perform other analyses. This is referred to as a cascading map server in OGC's WMS specification.
The output of the map server can be in one of three forms: a simple map image (GIF, JPEG etc); a graphic element map or a map composition comprising one or more overlays with predefined colors, styles, legends, and so on; a filtered raster and/or vector data in a form that can be manipulated (query, pan, zoom) on the client.
2.3.1.2. Thin Client Architecture
the Web server side, there are some possibilities to realize the GIS connection to the WWW: CGI, Web server application programming interface (API), Active server page (ASP), Java Server pages (JSP), PHP, etc.
Figure 2.6. Thin Client Architecture (Alesheikh & Helali b2001) Advantages of this architecture:
• The system can be totally controlled in Server side.
• Data updating is easy.
• Latest version can be kept.
• It is generally cheaper.
• Integration is possible. Disadvantages of this architecture:
• Local needs are not responsive.
• It has large data volume (size of the database)
• Users use a browser and it takes long time to download new HTML frame.
• Vector data does not appear in client side: browser without additional plug-in can not read vector files.
2.3.1.3. Thick Client Architecture
problem most browser applications offer a mechanism that allow third tier program to work together with browser as a plug-in.
The user interface functionality has progressed from simple document fetching more interactive applications. This progress is as follows: HTML, ActiveX, Java script to enhance user interface capabilities, Java applets to provide client-side functionality. Fig 7 shows the schematic communication between Web browser, Web server and GIS server in thick client architecture.
Figure 2.7. Thick Client Architecture (Alesheikh & Helali b2001) Advantages of this architecture:
• Document/graphics standards are not required.
• Vector data can be used.
• Image quality no restricted to GIF and JPEG.
• Modern interface is possible. Disadvantages of this architecture:
• Users is required to obtain additional software
• Platform/browser and additional software may not be compatible.
2.3.2. Geo Data Transfer
data on the server has to be converted to raster format. The data volume due to the known image size and the original data on server is safe as only an image is sent to the client. The disadvantage of using raster data is the lack of comfort of handling and regarding cartographic aspects. Because of low vector data volume, it transmits faster than raster. Vector data handled by a standard Web browser with extended functionality (plug-in, applet etc). The user gets more functionality with vector data. For example, single objects can be selected directly or highlighted. One more advantage of using vector data sent over Web could be three to four times less than the amount of raster data needed for equivalent resolution resulting in faster response time and greater productivity (Nayak, 2000). Disadvantage of vector data are manufacturer dependence, as well as,
changing data volume; the amount of data varies with the selected area. To avoid data redundancy in client side, dynamic generalization must be provided
The choice of transferring data form (vector or raster) varies with application and the existing infrastructures. Software products, which offer optional transferring of vector or raster data, may provide advantages. They may allow a pre-selection with raster data, and afterwards, loading of the actual vector data with the possibility of subsequently local process (Leukert & Reinhardt, 2000).
(www.opengis.org). The W3C submits Scalable Vector Graphics (SVG), which is a language for describing two dimensional vector and mixed vector/raster graphics in XML (www.w3c.org).
2.3.3. Web Map
There are three kinds of Web map: Static map, Dynamic map and Interactive map.
• Static map:
A static map publish refers to embedding maps as graphic images like GIF, JPEG and PNG inside an HTML page. The map images are usually used as a visual presentation to illustrate the points inside the HTML text. But the map image itself is not intelligent. That is, the map image is a static image displayed on the Web browser. The user cannot click on it to zoom to a certain area or get more information. A static map publishing does not support feature data at the client side and does not have map-rendering tools. To publish a static map image, you can save a ready-made map as a graphic map image format and embed it inside an HTML page. In addition, Acrobat's PDF is another popular method to publish static maps on the Web. A static Web map also can provide additional information by creating hyperlinks from "hot spots" on the map image to other Web pages.
• Dynamic map
• Interactive map
It is generated in response to a user's query for specific data types. Examples include interactive yellow pages, direction-finding pages or other address-mapping services available on the Web. Users enter an address, ZIP code, state or other geographical name and a map is generated to show the location or region requested. The geographic location is found by querying a geographic database for the user-specified geographic name or by matching the address to a geographic location. The maps also can have "hot spots" for hyperlinks to other Web pages.
2.3.4. Web-GIS Development Cycle
Several strategies have been proposed to provide successful implementation of Web GIS (Alesheikh & Helali b2001). The implementation strategies have been scientifically assessed and modified so that the requirement of project can be met with minimum cost and time. Web GIS development cycle consists of eight steps starting with requirement analysis and ending with end using, maintenance.
2.3.5. Web GIS Advantage & Disadvantage
2.3.5.1. Advantage
• Using the WWW as a user tool for formulating requests for the available data sets and using WWW servers for generating responses to such requests.
• It has become a standard format or language for Internet and World Wide Web applications; HTML was adopted as a means to organize text, integrated with graphics and other features.
• GIS computation power residing at the server side can be brought to the user without the need of buying expensive GIS software and associated hardware.
• The WWW environment is a multimedia environment, allowing easy integration of many types of information, and one of its most essential features is the possibility to inter-link documents in a variety of ways.
• The Internet is a cheap, (almost) device-independent standard user interface environment.
• GIS development integrated with the WWW has the potential to reach many people who needs or share spatial data.
2.3.5.2. Disadvantage
2.4. Available Web-GIS Software Component
There are several Web GIS softwares to enable user obtaining spatial information via Website. Some of them have been listed with their descriptions as below.
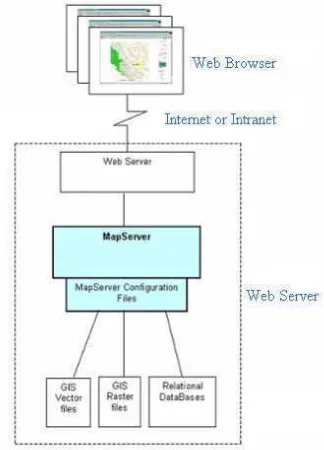
2.4.1. MapServer 4.8
MapServer was originally developed by the University of Minnesota (UMN) ForNet project in cooperation with NASA and the Minnesota Department of Natural Resources (MNDNR). Presently, the MapServer project is hosted by the TerraSIP project, a NASA sponsored project between the UMN and consortium of land management interests.
MapServer is not a full-featured GIS system like other Desktop GIS softwares. It excels at rendering spatial data (maps, images, and vector data) for the web. MapServer also can use layers from other map servers on the Internet as long as they are Web Map Servers (WMS).
2.4.2. ArcView Internet Map Server
ArcView Internet Map Server (IMS) is a program specially designed to run ArcView applications over the Internet. IMS has two parts. First, there is the Internet map server (IMS) itself, that enables ArcView GIS communicate with a Web server. The second part is the ESRI Map Web Server extension and is installed on the Web server platform. It enables the Web server to communicate with one or more ArcView GIS sessions running on one or more development platforms, administer these connections and balance the server load between them.
2.4.3. Autodesk MapGuide 4.0
Autodesk’s MapGuide 4.0 is a piece of software for Webmap publishing, from simple thematic Webmaps to full-fledged multimedia Webmapping applications. The suite of Autodesk MapGuide consists of the Server, the Author and the Viewer. The Server handles requests for maps and data from either the Author or the Viewer. The Author is a piece of software for the creation and publishing of maps according to pre-set display specifications. The Viewer is a plug-in for map display and lets the client perform many actions locally.
2.4.4. Intergraph Geomedia Web Map 3.0
be distributed through smart Webmaps over an Intranet or over the Internet (Intergraph, 1999a). The software is designed to serve geographic information to users running Windows and a standard Web browser.
2.5. Database
Database is a collection of non-redundant data, which is shareable among different applications representing needs of individual or group users (Laurini, 1996). The organization of database can be described in terms of records, fields,
and keys. Record is a group of related fields that stores data about a subject (Power, 2000).
2.6. Database Model
Database model is a collection of conceptual tools for describing data, data relationships, data semantics, and consistency constraints. There are several types of database model.
2.6.1. Relational Model
RDBMS (Relational DataBase Management System) is a database based on the relational model developed by E.F. Codd. A relational database allows the definition of data structures, storage and retrieval operations and integrity constraints. In such a database the data and relations between them are organized in tables. A table is a collection of records and each record in a table contains the same fields.
Properties of relational tables:
• Values are atomic
• Each row is unique
• The sequence of columns is insignificant
• The sequence of rows is insignificant
• Each column has a unique name
Certain fields of a table may be designated as key of that table. This key is used to identify and search record of a table. A join operation can be performed to select related records in the two tables by matching values in selected fields. The relational database model is based on the relation algebra
2.6.2. Hierarchical Model
The hierarchical data model organizes data in a tree structure. There is a hierarchy of parent and child data segments. This structure implies that a record can have repeating information, generally in the child data segments. Data in a series of records, which have a set of field values attached to it. It collects all the instances of a specific record together as a record type. These record types are the equivalent of tables in the relational model, and with the individual records being the equivalent of rows.
2.6.3. Network Model
can have that role in more than one set; hence the multi-parent concept is supported.
2.6.4. Object-Oriented Model
III. RESEARCH METHODOLOGY
3.1. Time and Location of Study
This research was conducted from January to May 2006 at Bogor Agricultural University. The location of study is East Java – Indonesia. Geographically, it is located at 70 12’ – 80 48’ S Longitude and 1110 0’ – 1140 4’ East Latitude. The northern side is bounded by Java Sea, Eastern part by Bali strait, Southern part by India Ocean and Western part by the province of central Java. The area of East Java is 428,67km2, coasting of 29 regencies and 9 cities. The location of study can be shown in figure 3.1.
Figure 3.1. Research Location
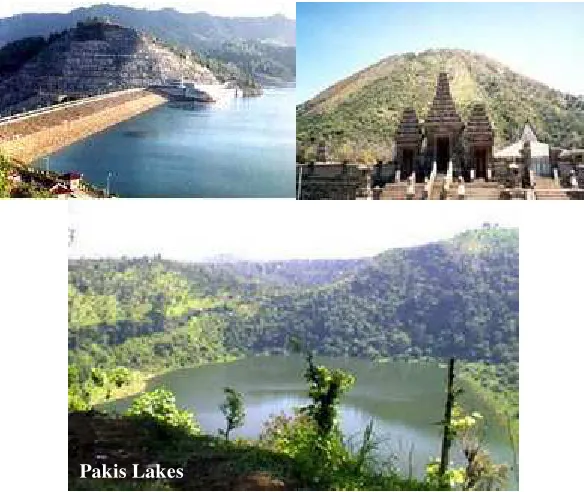
There are significant number of historical monuments and natural resorts in this area. Photographs of several historical and natural examples also can be seen in the figure 3.2. There are also several holiday resorts lie around this province.
East Java
Figure 3.2. Historical and Natural Objects
3.2. Web GIS Development Cycle
This system was analyzed and designed based on Web-GIS Development Cycle.
Figure 3.3. Web GIS Development Cycle (Alesheikh & Helali 2001)
The Web GIS development cycle is described in terms of eight major activities starting with the requirement analysis and ending with on-going use and maintenance of the Web GIS system.
Step 1. Requirement Analysis
The objective of this study is to build a Web based GIS in order to disseminate spatial and non-spatial tourism information via Internet.
Step 1.1. User Identification
There are two categories of user: tourist and manager.
• Tourist wants to know information of interested objects in order to make good planning and preparing for visit.
• Manager needs to know information of tourist area in order to make good service.
Step 1.2. User Needs
What needs of uses can be shown as questionnaire list below:
Tourism Manager
- Where is the city, state or country located?
- What is the climate? It has warm or cold weather?
- When is the best time of year to visit? - Where are the hotels and guesthouse in the city located? What is their
classification?
- What kinds of public transportation are available?
- Where are the cultural/natural showing located?
- Where are areas that tourists are interested in?
- What are the physical-geographic Characteristics of those areas?
- What are the demographic and socio-economic characteristics of the local population of each tourist space?
- What attractive places are near hotel? - Where are the banks?
- Where are the shopping centers?
- What's about service quality? - What are the tourism demands for tourism service?
Table 3.1. User Needs
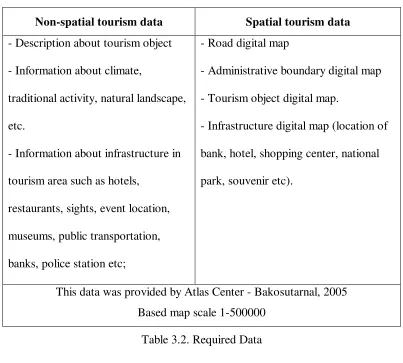
Step 1.3. Required Data
There are two types of data used in this research: Non-spatial tourism data, spatial tourism data.
Non-spatial tourism data Spatial tourism data
- Description about tourism object - Information about climate,
traditional activity, natural landscape, etc.
- Information about infrastructure in tourism area such as hotels,
restaurants, sights, event location, museums, public transportation, banks, police station etc;
- Road digital map
- Administrative boundary digital map - Tourism object digital map.
- Infrastructure digital map (location of bank, hotel, shopping center, national park, souvenir etc).
This data was provided by Atlas Center - Bakosutarnal, 2005 Based map scale 1-500000
Table 3.2. Required Data
Step 2. Conceptual Design
In the architectural system of Web GIS, this service is similar to the client/server architecture of the Web. The geo-processing is broken down into a server-side and client-side task.
A client typically is a Web browser. The server-side consists of a Web server and a Web GIS software programming. The client requests a map or some geo-processing over the Web from the remote server. The server translates the request into an internal code and invokes the GIS functions by passing on the request to the Web GIS software. The software returns the result that is reformatted for interpretation by the client browser application itself or with additional functionality from a plug-in or Java applet. The server then returns the result to the client for display, or sends data and analysis tools to the client for use on the client-side.
Figure 3.4. Web GIS architecture (Peng, 1997; Plewe, 1997, p.5)
The interface consists of WWW pages with HTML forms, which interact with the WWW server through CGI requests. Tourists will stay in this side and send request to server to get information. This requires all functionality to reside at the server.
A map server is a component that generates maps, fulfills spatial queries, and delivers symbolized maps. A client based on the user's request. The map server can be split into smaller parts to provide specific services. The output of the map server can be in one of three forms: a simple map image (GIF, JPEG etc); a graphic element map or a map composition comprising one or more overlays with predefined colors, styles, legends, and so on; a filtered raster and/or vector data in a form that can be manipulated (query, pan, zoom) on the client.
Step 3. Hardware and Software Survey
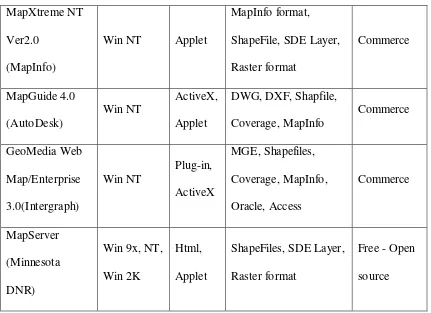
The purpose of this phase is to focus on the hardware and software components of the system and how to acquire information on what is available. Selecting suitable software is an important step in a successful implementation. Software was evaluated on functionality and performance, and dependent on hardware and operating system. Doing rapid survey in several available Web GIS softwares can be shown as table below.
Web GIS Software
Platform of IMS
Browser
plug-in Data format Price
MapXtreme NT requirements but almost packets are commercial. Only MapServer, which is developed by University of Minnesota is free and open source. Therefore this packet was used in this research functioned for spatial data process.
Step 3.1. Hardware
Step 3.2. Software
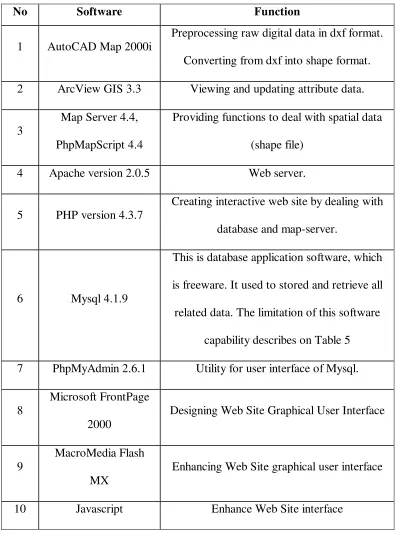
This system was developed by using several softwares, which can be shown as table 3.4.
No Software Function
1 AutoCAD Map 2000i
Preprocessing raw digital data in dxf format. Converting from dxf into shape format. 2 ArcView GIS 3.3 Viewing and updating attribute data.
3
Map Server 4.4, PhpMapScript 4.4
Providing functions to deal with spatial data (shape file)
4 Apache version 2.0.5 Web server.
5 PHP version 4.3.7
Creating interactive web site by dealing with database and map-server.
6 Mysql 4.1.9
This is database application software, which is freeware. It used to stored and retrieve all related data. The limitation of this software
capability describes on Table 5 7 PhpMyAdmin 2.6.1 Utility for user interface of Mysql.
8
Microsoft FrontPage 2000
Designing Web Site Graphical User Interface
9
MacroMedia Flash MX
Enhancing Web Site graphical user interface
10 Javascript Enhance Web Site interface
Operating System File-size Limit
Linux 2.2-Intel 32 bit 2 GB (LFS:4 GB)
Linux 2.4 (Using ext3 file system) 4 TB
Win32 w/FAT/FAT32 2 GB/4 GB
Win32 w/NTFS 2 TB (possible larger)
Table 3.5. Capability of Mysql
Step 4. Database Design and Construction
The primary purpose of this phase of Web GIS development process was to specify how the Web GIS performs the required application. Database design involved defining how graphic will be symbolized (e.g. color, size, symbols, etc), how graphic files will be structured, how non graphic attribute files will be structured, what is the active layer, in what scale shall the layers expose, how GIS products will be presented (e.g. map sheet layouts report format etc), and what management and security restriction will be imposed on file access.
Step 4.1. Non-Spatial Database Design
Non-spatial database design proceeds through the steps illustrated in Figure 3.5.
The first step is independent of the kind of DBMS used. This step converts the conceptual E-R to a set of record type, with each record made up a number of fields. The set of record types is known as the logical record structure (LRT). The conversion to an LRT is necessary because most commercial DBMS store data as a set of records. Records are the same fields are defined to be of the same type. The first step also defines how data in these records is to be used. These access requirements are used later to choose DBMS structure.
Step 2 and step 3 convert the LRS to a database definition. These steps use techniques that depend on the DBMS. DBMS - dependent techniques are needed because different DBMS support different kinds of links between their records. Database design depends on the structures supported by the DBMS and user techniques appropriate for these structures.
DBMS-dependent design proceeds in two stages. The first step is logical design, which defines the DBMS record types and the links between them. The next step is physical design. This step chooses a physical organization that supports the methods used to access the database
Non-spatial database contains description about tourism object, information about infrastructure in tourism area such as hotels, restaurants, sights, event location, museums, public transportation, banks, police station etc.
Step 4.1.1. Conceptual Design
method known as entity relationship analysis (Chen - 1976). Relational database model stores data as a set of table or relation.
Entity relationship analysis uses three major abstractions to describe data. These are:
• Entity, which are distinct things in the enterprise.
• Relationships, which are meaningful interactions between the objects.
• Attributes, which are the properties of the entities and relationships.
Entity relationship diagram gives a graphic representation to the conceptual model. To create the relationship among entities, the primary key and foreign key is used.
Step 4.1.2. Logical Design
Logical design is to convert the logical record structure to a data model supported by the DBMS. The conversion method depends on the type of data model supported by DBMS. In this research the relational database model is used, so in this case we need not even construct a logical record structure. Instead, the relational description of the used data becomes the DBMS data structure and each relation in the used model becomes a DBMS relation. So every entity will become table in DBMS.
Step 4.1.3. Physical Design
Step 4.2. Spatial Database Design
Spatial database design consists of a three-step (Elmasri and Navathe - 2000) design process. In the first step, all the available information related to the
application is organized, using a high-level conceptual data model. At the conceptual level, the focus is on data types of the application, their relationships and constraints. The Entity Relationship (ER) model is one of the most prevalent of all conceptual design tools.
The second step called the logical data model is related to the actual implementation of the conceptual data model in a commercial DBMS. Data in a commercial database is organized using an implementation model. Examples of implementation model are hierarchical, network, and relational model. The relational model is one of the most widely implemented models in current commercial DBMS. In the relational model, the data types, relationships, and constraints are all modeled as relations.
The third step called the physical data model deals with the nuts and bolts of the actual computer implementation of the database application. Issues related to the storage, indexing and memory management are handled at this level.
Step 4.2.1. Conceptual Design
In spatial database design, there is one important thing that is needed to consider is this type of spatial object. There are three types of spatial object: point, line, and polygon.
Step 4.2.2. Logical Design
The purpose of this step is to convert conceptual design to logical design. Every entity shown on the E-R diagram must be translated to a GIS layer, a relational table(s), or both, as indicated by the information to be included. In addition, every relationship of the type "relationship represented in database" (single line hexagon on the E-R diagram) must be implemented through the primary and secondary keys in the tables for the entities represented.
Step 4.2.3. Physical Design
The purpose of this step is to convert logical model to physical model with specific SDMB. In this research, physical model will be stored in Shape file format (ESRI).
Step 5. Acquisition of GIS Software and Hardware
GIS hardware and software acquisition includes the final selection of the hardware and software (by competitive bid in response to a request for proposals - RFP, as necessary); the delivery and installation of the hardware and software; and all necessary renovation of space, wiring, and environmental remodeling.
Step 6. Web GIS System Integration
expected. GIS System Integration is bringing the final database and the hardware and software together and testing their combined operation.
Step 7. Application Development
Web GIS application development is preparing applications identified in the needs assessment, which require additional programming using the GIS macro language or other supporting programming languages. By using this hardware and software component in this previous list, the system will be implemented.
Step 8. Web GIS Use and Maintenance
Client
Web Server
User
Web Browser HTTP
Map Application Server
(Mapserver 4.4)
Application Server
(PHP)
MySql Database Map File
Graphical User Interface
( PHP Pages, Java Script, Java Applet, and MacroMedia flash)
Shape File
IV. RESULT AND DISCUSSION
The results of this research will be shown based on these steps of research methodology.
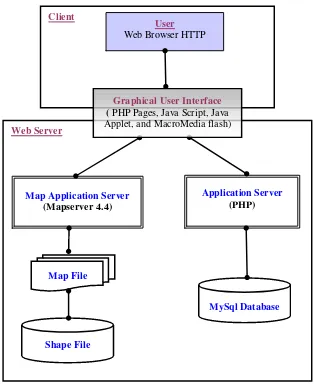
4.1. System Architecture
Tourism Information System is a computer-based system. It works as a Client – Server network model.
User: Tourist and manager.
Web Server is a layered system consisting of an Application Server and the Map Application Server. The Web Server software is Apache packet. It receives requests from the user thought the GUI and then passed to the application or map server.
Graphical User Interface (GUI) contains communications protocols allowing interaction with the Web Server and the User’s Computer. The GUI is a set of PHP Pages, Java Script and MacroMedia Flash files.
Application Server sends requests and receives information from Mysql database.
Map Application Server requests .map files objects when a request is receive from the GUI. It connects to the maps file through the MapServer packet.
Mysql Database is Database Management Software presented relational database model.
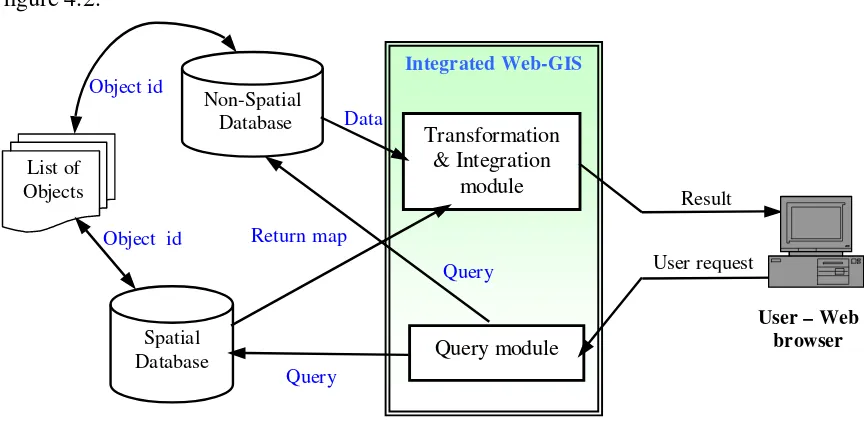
4.2. Query Work Flow
The query flow to get non-spatial and spatial data can be described as figure 4.2.
Figure 4.2. Query Workflow
4.2.1. Processes Involved when Interacting with Map (Spatial Data)
When the users want to interact with the available maps, Map server packet opens the .map file and works with the component specified to generate a view of the component fitting the zoom and pan commands issued by the user. The map server reads the configuration .txt file in the same folder as the index.php file to know how to configure the display. The final view is rendered as an image and served by the map server to the browser within the stream of HTML commands created by Apache processing of the .php pages. The list below shows the steps with more details:
• The Users generate the requests to the Map Application Server via HTTP on the Graphic User Interface.
• The Web Server receives requests from the User, and sends requests to Map Application server.
• The Map Application Server load Map file.
• The Map Application Server manipulates the .map file objects within the Map Server packet using CGI function.
• The final view is rendered as an image and served by the Map Application Server to the User computers in the Graphical User Interface.
4.2.2. Processes Involved when Accessing Non-Spatial Data
With the given layout of the Web page, the process for accessing non-spatial data may follow the following steps:
• The Users generate the requests to the Application Server via HTTP on the Graphic User Interface.
• The Web Server receives requests from the User, and sends to Application server.
• The Application Server connects and retrieves data from MySql database.
4.3. Database Design
4.3.1. Non-Spatial Database Design
4.3.1.1. Conceptual Design
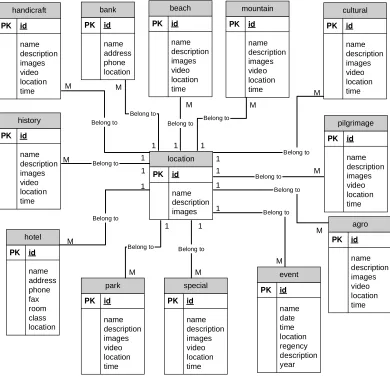
Entity relationship diagram was used to present conceptual model.
agro
Figure 4.3. Non-spatial Entity Relationship Diagram Guest book and airline entity
4.3.1.2. Logical Design
Deriving from entity relation diagram, the logical model can be shown as table below.
No Entity Attribute
1 location id, name, description, images.
2 handicraft id, name, description, images, video, location, time. 3 beach id, name, description, images, video, location, time. 4 cultural id, name, description, images, video, location, time. 5 history id, name, description, images, video, location, time. 6 park id, name, description, images, video, location, time. 7 special id, name, description, images, video, location, time. 8 mountain id, name, description, images, video, location, time. 9 agro id, name, description, images, video, location, time. 10 pilgrimage id, name, description, images, video, location, time.
11 guestbook
GuestId, GuestName, GuestEmail, GuestMessage GuestEntry, GuestIP.
12 airline id, name, departure, destination, time, day. 13 bank id, name, address, phone, location.
14 event id, name, date, time, location, regency, description, year. 15 hotel id, name, address, phone, fax, room, class, location.
Table 4.1. Non-spatial Logical Design Terminology
id: identification of object.
description: description of object
images: name of image file
video: name of video file
location: identification of regency, used to link object with regency.
4.3.1.3. Physical Design
Physical design follows logical design. The Database Management System (DBMS) was used is Mysql version 4.1.9. pilgrimage, mountain, special, park, history, cultural, beach, handicraft are the same structure.
Entity Attribute Type Width
id mediumint 9
name varchar 100
description text -
images varchar 50
video varchar 50
location mediumint 9
pilgrimage, mountain
special, park, history
cultural, beach, handicraft.
time tinyint 5
GuestId int 11
GuestName varchar 50
GuestEmail varchar 50
GuestMessage text -
GuestEntry date yyyy-mm-dd
guestbook
GuestIP varchar 50
id varchar 10
hotel
address varchar 200
location varchar 100
id varchar 5
name varchar 100
departure varchar 100
destination varchar 100
time varchar 20
airline
day varchar 200
Table 4.2. Non-spatial Physical Design
4.3.2. Spatial Database Design
4.3.2.1. Conceptual Design
Entity relationship diagram was used to present conceptual model.
4.3.2.2. Logical Design
Deriving from entity relationship diagram, the logical model can be shown as table below.
No Entity Attribute
1 regency_boundary Id, Name, Shape
2 hotel Id, Name, Shape
Table 4.3. Spatial Logical Design
4.3.2.3. Physical Design
Physical design follows logical design.
Id Varchar 3
Name Varchar 10
10 Beach
Shape Point
Table 4.4. Spatial Physical Design
The GIS software to be used dictates most of the physical database design. The structure and format of the data in a GIS, like ARC/INFO™, Intergraph™, MapInfo™, System 9™, ESRI Shape, etc have already been determined by each vendor respectively.
The translation from the entity representation in the E-R diagram and logical design to the physical design of the database in ESRI Shape for a single entity is shown in figure 21.
Figure 4.5. Physical Model in ESRI Shape Format (ESRI)
4.4. Setting Up Softwares and Hardware Components.
In this system, there are several softwares, which need to be set so that they can work together. The main software components of this system are
Object
Object.dbf Object.shx
Object.shp
Apache, PHP, MySQL, PhpMyAdmin, MapServer. The role of each softwares component is mentioned in table 3.4.
4.5. Implementation
4.5.1. Web User Interface
Figure 4.6. Web User Interface
There are four components in web user interface: Left panel, header panel, footer panel and content panel.
• Header panel presents the banner and the quick link to other pages.
• Footer panel presents the copyright and information of web master.
• Left panel contains the links of other pages.
• Content panel presents descriptions
4.5.2. Function of System
4.5.2.1. General Information
In the left panel, by using part General Information user can obtain information about East Java such as government, history, geography, population, and culture.
Figure 4.7. General Information in East Java
4.5.2.2. Quick Travel Planning
In fact, someone visits to East Java for other purposes not for traveling. After finishing their business, they still left some time, so they want to visit tourism object surrounding their location. This function of system will assist tourist to decide quickly where they should visit when they don't have so much time.
city of regency to tourism object. The system will produce some alternatives based on the input of tourist. Under here is an example of processing of this function. Tourist clicks on the link quick travel planning. The input form will appear.
Figure 4.8. Quick Travel Planning Form
Tourist selects regency, tourism object and visiting time, after that click on search button to view the tourism object that satisfies requirements. The results will show.
Figure 4.9. Result of Travel Planning
If tourist clicks on link more details the new page that contains information of this object will show up
Figure 4.10. Information of Searching Object
If tourist clicks on link Show map the new page that contains digital map of this object will show up.