EISSN: 2086-4094 DOI: 10.4308/hjb.18.1.21
AMMI Model for Interpreting Clone-Environment Interaction
in Starch Yield of Cassava
SHOLIHIN
Indonesian Legume and Tuber Crops Research Institute, Jalan Raya Kendalpayak, P.O. Box 66, Malang 65101, Indonesia Phonoe: +62-341-801468, Fax: +62-341-801496, E-mail: [email protected]
Received November 30, 2009/Accepted March 17, 2011
The aim of the study was to analyze the interaction between clone and environment for starch yield in six month-old plants of cassava clones based on additive main effects and multiplicative interaction (AMMI) model. The experiments were conducted on mineral soil in four different locations: Lumajang (inceptisol), Kediri (entisol), Pati (alfisol), and Tulangbawang (ultisol). The experiments were carried out during 2004-2005, using a split plot design withthree replications. The main plots were the simple and the improved technology. The clones used were fifteen clones. Parameter recorded was starch yield (kg/ha) of the 6 month old plants. The data were analyzed using the AMMI model. Based on the AMMI analysis, environmental factors being important in determining the stability of the starch yield were soil density for subsoil, pH of topsoil, and the maximum air humidity four months after planting. The clones of CMM97001-87, CMM97002-183, CMM97011-191, CMM97006-44, and Adhira 4 were identified as stable clones in starch yield within 6 month-old plants. CMM97007-235was adapted to maximum relative humidity 4 months after planting and to lower pH of topsoil, whereas, MLG 10311 was adapted to lower bulk density. The mean starch yield of MLG 10311 was the highest six months after planting.
Key words: cassava, interaction of clones and locations, AMMI model
___________________________________________________________________________
INTRODUCTION
It is expected that the demand for cassava in Indonesia will increase markedly in the future due to the increases in the human population and in industries using cassava as the raw material. Increasing cassava yields should therefore be our main goal for increasing cassava production. Planting the high-yielding varieties is one of the main components in increasing productivity.
Genotype interacts with environment to produce phenotype, and the environment basically can be classified as the predictable and the unpredictable environment. Irrigation, fertilization, plant population, and the planting method are classified as the predictable environment, whilst rain fall, humidity, and temperature can be classified as the unpredictable one. To response the predictable environment, the various trial should be carried out on the condition of environment which is similar to that of the central cassava plantation, while to response to the unpredictable environment, the various trial should be done on some environment during some planting season. Cassavas are planted in most provinces of Indonesia with various systems of cultivation, land condition, and climate. Cultivation system of cassava in Indonesia is mono-culture and inter-cropping with other plant like non-irrigated rice, maize, and peanut. Condition of land is also various, but in general, the condition is marginal with level of fertility from low to medium. Sumatera is relatively wet with rain distributed almost through the year, West Java is medium, Central Java, and East Java is relatively dry
with clear differences between rainy season and dry season. Therefore, young phase of cassava is in rainy season and its old phase is in dry season.
To analyze the data of multi-location trials, there were a few techniques of analysis; one of them is the technique based on additive models. This technique is concentrated in analysis of stability. This technique is based on regression variety performance on environment index like proposed and modified by Finlay and Wilkinson (1963), Eberhart and Russel (1966), Perkins and Jinks (1968), Freeman and Perkins (1971), and Shukla (1972). There is an assumption of a strong linear relationship between variety performance and environmental factors for the regression method which is almost never the case in wide area domains. Gauch (1992) proposed the technique based on model of additive main effects and multiplicative interaction (AMMI).
Some promising clones have been identified resulted from previous cassava breeding activities. These clones are needed to be tested in various locations/environments conditions to get the superior ones and released as new varieties. The aim of this study was to identify clones with wide or specific adaptabilities assessed with AMMI model.
MATERIALS AND METHODS
were selected since (i) they were the center of cassava production, (ii) their soils were varied, and (iii) they were representative of cassava area in Indonesia. The experiments were done using a split-plot design, three replications, with plot size was a 5 x 5 m. Three kinds of growing environments were: (i) simple technology (Plants were fertilized with 93 kg N/ha); plant population: 12,500 plants/ha; fertilizer: 93 kg N/ha; and (ii) improved technology (Plants were fertilized with 93 kg N+ 36 kg P2O5 + 60 kg K2O/ha); plant population 12,500 plants/ha; fertilizer 93 kg N + 36 kg P2O5 + 60 kg K2O/ha). These main plots were subdivided into subplots where different clones were grown. A total of 15 clones were tested in this experiment.
Data recorded from each plot were starch yield (kg/ha) produced after six months of planting. Starch yield was a multiplication of fresh tuber yield and starch content. Starch content was calculated from the specific gravity (SG) = (fresh tuber weight in the air)/( fresh tuber weight in the air - fresh tuber weight in the water) The starch content is SG x 112.1-106.4.
The environment data collected were climate, and soil properties such as N, P2O5, K content, oil moisture an others. Total rainfall, number of rainy days, the maximum and minimum air temperature, and the maximum and minimum air relative humidity were taken from climate station near the location of the experiment, each month during the growing period. Soil moisture was measured just after six months planting, three samples per location. Each sample was measured separately. Samples were taken during dry season. N, P2O5, K content of soil, CEC of soil, bulk density of soil, soil pH and soil texture on top-soil and sub-soil were recorded from three samples per location. Each sample was measured separately. Those data were taken just one time before planting. The average values were used for calculation of correlation with IPCA score.
Data of starch yield was analyzed using MSTAT (Michigan Statistic), version C software (released by Michigen State University) to obtain the combined analysis of variance. International rice research institute statistic (IRRISTAT) software version 5.0 was used to analyze of variance based on AMMI model and interaction principal component analysis (IPCA) score. IPCA scores is Σnλnγgnδen with λn = the singular value for PCA axis n; γgn = the genotype eigenvector for axis n; δen = the environment eigenvector. Correlations between IPCA scores and the environment data were analyzed using a MSTAT - C program. Biplot IPCA was constructed using Microsoft office excel program.
The stability of clones can be determined based on biplot IPCA. Chaudhary and Ahn (1996) added ellipse around the point (0.0) of biplot IPCA and Sumertajaya (2005) constructed ellipse by calculating radius (r) of ellipse. The radius (r) of ellipse was calculated as follows:
ri = ±√ [ (n-1)p / (n-p)] [F(α, p, n-p)] [√λi ei ] ri = radius (r) of ellipse for ith main component; n = number of genotype; p = number of dimension of AMMI model; F(α, p, n-p) = F table at a α level (0.05); λi = the singular value for PCA axis n; ei = eigenvector.
Clones being inside the ellipse can be classified as stable clones, conversely, those being outside the ellipse can be classified as unstable clones (Sutjihno 1996).
The characteristics of the locations were described as
follows: N content in topsoil ranged (0.06-0.14%) and that
in subsoil (0.03-0.07%), P content in topsoil ranged (1.27-105) ppm and that in subsoil (4.28-66.9) ppm. K content in topsoil ranged (0.08-0.58) me/100 g and that in subsoil (0.05-0.81) me/100 g. pH of topsoil ranged 4.7-6.6 and that of subsoil 4.9-6.15. Topsoil CEC ranged (6.82-23.9) me/100 g and subsoil CEC ranged 8.41-34.4 me/100 g. Bulk density of topsoil ranged 106.35-141.35 g, and that of subsoil 111.32-173.23. Percentage of sand of topsoil ranged 5.5-79%, and that of subsoil 5-85%. Percentage of silt in topsoil ranged 14-44% and that in subsoil 6-32%. Percentage of clay on topsoil ranged 5-50% and on subsoil 9-63%. Soil moisture ranged 7.67-25.4% (6 months after planting) and 1.97-16.47% (9 months after planting). The minimum air temperature from planting till 5 months after planting (monthly mean) ranged (22.8-25.23 oC). The maximum air
temperature from planting to 5 months after planting (monthly mean) ranged (31.53-34.27 oC). The maximum
relative humidity during growth period ranged (72.23-100%). The minimum relative humidity during growth period ranged (31.83-87%). Number of rainy days/month ranged 21 days, and a total rainfall/month ranged 0-511 mm.
RESULTS
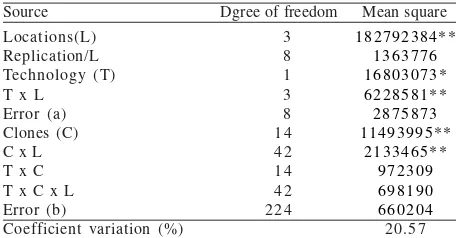
Interaction of clones and locations was significantly different (P = 0.001) for starch yield (Table 1). However, the interaction of technologies, clones, and locations was not different significantly. Starch yield of clones which were fertilized by 93 kg N/ha were similar to that of clones fertilized by 93 kg N+ 36 kg P2O5 + 60 kg K2O/ha in each location (Table 2).
Using the AMMI model to analyze the clone stability, it can be seen that the interaction of technologies, clones, and locations was not significantly different starch yield (Table 1). Besides, the starch yield of clones fertilized by 93 kg N/ha were similar to that of clones fertilized by 93 kg N+ 36 kg P2O5 + 60kg K2O/ha in each location (Table 2). Hence the technology factor in this experiment can be justified as replications. So for the AMMI model, there were 15 clones, 4 locations and 6 replications.
Table 1. Combined ANOVA for 15 cassava clones, 2 technologies, and 4 locations for starch yield
Source Dgree of freedom Mean square
Locations(L) Replication/L Technology (T) T x L
Error (a) Clones (C) C x L T x C T x C x L Error (b)
Coefficient variation (%)
3 8 1 3 8 1 4 4 2 1 4 4 2 2 2 4
182792384** 1363776 16803073* 6228581** 2875873 11493995**
AMMI Analysis. Based on the AMMI model, analysis of variance for the starch yield showed that the effect of interaction of clones and locations was different significantly at 1%. With the model, source of variance of clones x locations interaction can be divided into some components, i.e. IPCA1, IPCA2 and IPCA3, and IPCA 1 and IPCA 2 which were different significantly, meanwhile IPCA 3 was not Table 3. Fifty four percent of interaction sum of square was contributed by IPCA1, this value was the sum of square of IPCA1 times 100 divided by the sum of square of interaction of clones and locations , 34% by IPCA 2, and the residue by IPCA3.
The environmental data collected in this experiment can be correlated with IPCA scores as given in Table 4, 5, and 6. This correlation can lead to useful biological interpretation of the interaction effects. IPCA 1 was positively correlated with bulk density of subsoil. The bulk density will increase if IPCA 1 scores increase. Such information would not come out of the regression analytical methods, confirming a very positive aspect of PCA to reveal the hidden information in the data. IPCA 2 was
Table 2. Starch yield with simple and advanced technology in some locations
LSD (Least significant difference) 5%
5136a *Means followed by the same letter are not significantly different in DMRT (P = 0.05).
Table 3. Analysis of variance base AMMI model for starch yield
Source of variance Degrees of freedom Mean squares ** = significantly at 1%.
Table 4. Correlations between IPCA scores and characteristics of soil chemistry for starch yield
Chemical characteristics of soil IPCA1 IPCA2 N content on topsoil
N content on subsoil P2O5 content on topsoil
P2O5 content on subsoil
K content on topsoil K content on subsoil Soil pH of topsoil Soil pH on subsoil CEC of soil on topsoil CEC of soil for subsoil
Soil moisture, 6 months after planting
-0.159
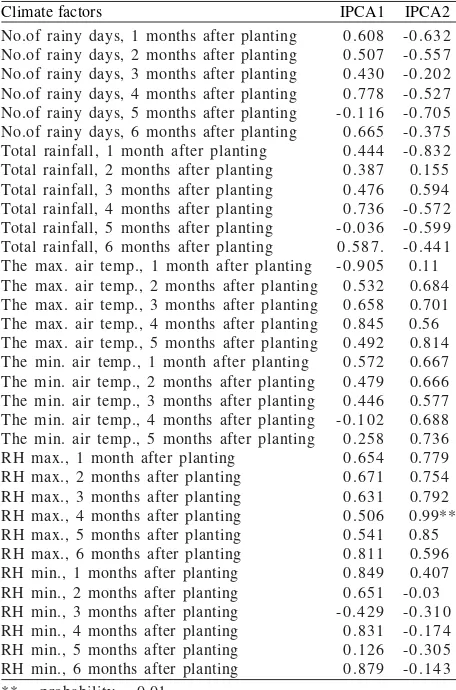
Table 5. Correlations between IPCA scores and climate factors for starch yield
Climate factors IPCA1 IPCA2 No.of rainy days, 1 months after planting
No.of rainy days, 2 months after planting No.of rainy days, 3 months after planting No.of rainy days, 4 months after planting No.of rainy days, 5 months after planting No.of rainy days, 6 months after planting Total rainfall, 1 month after planting Total rainfall, 2 months after planting Total rainfall, 3 months after planting Total rainfall, 4 months after planting Total rainfall, 5 months after planting Total rainfall, 6 months after planting The max. air temp., 1 month after planting The max. air temp., 2 months after planting The max. air temp., 3 months after planting The max. air temp., 4 months after planting The max. air temp., 5 months after planting The min. air temp., 1 month after planting The min. air temp., 2 months after planting The min. air temp., 3 months after planting The min. air temp., 4 months after planting The min. air temp., 5 months after planting RH max., 1 month after planting
RH max., 2 months after planting RH max., 3 months after planting RH max., 4 months after planting RH max., 5 months after planting RH max., 6 months after planting RH min., 1 months after planting RH min., 2 months after planting RH min., 3 months after planting RH min., 4 months after planting RH min., 5 months after planting RH min., 6 months after planting
0.608
positively correlated with the maximum relative humidity 4 months after planting. However, IPCA 2 was negatively correlated with the soil pH of topsoil.
IPCA 1 score of Lumajang was -22.81 (Table 7) and IPCA 1 was positively correlated with bulk density on subsoil. It meant that Lumajang had relatively low bulk density on subsoil, meaning that soil in Lumjang was relatively loose. Based on the soil analysis, bulk density
Table 6. Correlations between IPCA score and environmental factors for starch yield
Characteristics of soil physic IPCA1 IPCA2 % sand on topsoil
% silt on topsoil % clay on topsoil % sand on subsoil % silt on subsoil % clay on subsoil
Bulk density of soil on topsoil Bulk density of soil for subsoil
0.521
Table 7. IPCA scores for locations and mean of starch yield
of subsoil in Lumajang was 1.3 g/cm3. That was different
from that in Tulangbawang which was 1.8 g/cm3. IPCA
1 score of Tulangbawang was 42.2. It meant that Tulangbawang had high bulk density of subsoil, meaning that soil in Tulangbawang was relatively compact.
IPCA 2 was positively correlated with the maximum relative humidity 4 months after planting. IPCA 2 score of Lumajang was -33.35. It meant that Lumajang had lower relative humidity 4 months after planting. Based on the data taken from climate station, the maximum relative humidity 4 months after planting in Lumajang was 82.29%. That was different from that in Kediri which was 99.8%. It meant that Kediri had relatively higher maximum relative humidity 4 months after planting than Lumajang did. IPCA 2 score of Kediri was 33.50.
IPCA 2 was negatively correlated with the topsoil pH. IPCA 2 score of Lumajang was -33.35. It meant that Lumajang had relatively high soil pH of topsoil. Based on the soil analysis, the soil pH of topsoil in Lumajang was 6.6. That was different from that was in Kediri which was 5.1. IPCA 2 score of Kediri was 33.50. It meant that Kediri had relatively low soil pH of topsoil.
Biplot of IPCA 1 and mean of starch yield presented in Figure 1 showed that the starch yield of MLG 10311 was the highest, while Adira 1 was the lowest. Based on this figure, it can be determined that clones lie at the same point on the horizontal axis indicates that the clones had the similar main effect (starch yield), and clones lieat the same point on the vertical axis indicates that the clones had the similar interaction effect. The starch yield of clone 6 (CMM97007-145), 12 (CMM97001-12), 13 (UB 1-2),and
14 (Adira 4) were similar, but the interaction effect with location was different. Clone 6 (CMM97007-145) had a positive interaction with location D, while clone 12 (CMM97001-12 had a negative interaction with location D. That locations used was varied in environment factors. Biplot IPCA 1 and IPCA 2 for locations based on starch yield showed that locations used for cassava were good enough (Figure 2) and they are away from each other (Figure 1).
Based on IPCA score for 15 clones and starch yield the average of starch yield of MLG 10311 was the highest, followed by UB 1-2, CMM97001-12, CMM97007-14, Adira 4 (Table 8). Clone MLG 10311 and CMM97001-12 had a low score on IPCA 1 (-19.4 and -23.2) indicating their adaptation to low bulk density on subsoil since IPCA 1 scores were positively correlated with subsoil bulk density. IPCA 2 score of CMM97007-235was high (24.4) indicating their adaptation to maximum relative humidity 4 months after planting, since IPCA 2 scores was positive correlated with the maximum relative humidity 4 months after
MMI1 biplot of main effects and interactions 43.0
Date: PATI6, Data file: PATI6, Model FIT: 94.9% of Table Means
Figure 1. Biplot of IPCA 1 and starch yield in six months. 1: CMM97001-87, 2: CMM97015-255, 3: CMM97011-191, 4: CMM97002-183, 5: CMM97002-36, 6: CMM97007-145, 7: CMM97007-235, 8: CMM97006-52, 9: Adira 1, 10: Malang 2, 11: CMM97006-44, 12: CMM97001-12, 13: UB 1-2, 14: Adira 4, 15: MLG 10311, A: Lumajang, B: Pati, C: Tulangbawang, D: Kediri.
Figure 2. Biplot of IPCA 1 and IPCA 2 for clones based on starch yield in six months [r1= radius of ellipse for IPCA1 = 16.3; r2 = radius (r) of ellipse for IPCA2 =14.1]. 1: CMM97001-87, 2: CMM97015-255, 3:
CMM97011-191, 4: CMM97002-183, 5: CMM97002-36, 6:
CMM97007-145, 7: CMM97007-235, 8: CMM97006-52, 9: Adhira 1, 10: Malang 2, 11: CMM97006-44, 12:
CMM97001-12, 13: UB 1-2, 14: Adhira 4, 15: MLG
10311, A: Lumajang, B: Pati, C: Tulangbawang, D: Kediri.
Table 8. IPCA scores for clones and starch yield in six months
planting. Clone CMM97007-235was also adaptive to low topsoil pH since IPCA 2 was negatively correlated with the soil pH of topsoil.
Biplot of IPCA1 and IPCA2 for clones based on starch yield indicated that clone 1 (CMM97001-87), 4 (CMM97002-183), 3 (CMM97011-191), 5 (CMM97002-36), 8 (CMM97006-52), 11 (CMM97006-44), and 14 (Adhira 4) were classified as stable clones based (Figure 2). Clone 2 CMM97015-255, 12 (CMM97001-12), 13 (UB 1-2), 9 (Adhira 1), 15 (MLG 10311), 6 145), 7 (CMM97007-235), and 10 (Malang 2) were classified as unstable clones. Clone 15 (MLG 10311), 12 (CMM97001-12), and 13 (UB 1-2) were more adaptive compared to Adira 1 to the location which had a low bulk density of subsoil. Clones 2 (CMM97015-255) were more adaptive than clone 7 (CMM97007-235) to environment which was low maximum relative humidity 4 months after planting (Figure 2).
A and B locations were separated from the C location on IPCA 1, bulk density of soil in A and B location were lower than that in C location. The location having high Bulk density of soil, means that the air in the soil is low. For IPCA 2, A location was separated from the B location, the maximum relative humidity 4 months after planting of B location were higher than those of A (Figure 2).
DISCUSSION
Based on Table 2, it can be seen that starch yield of clones fertilized by 93 kg N/ha were similar to that of
clones fertilized by 93 kg N+ 36 kg P2O5 + 60 kg K2O/ha in
each location. This result may be due to the amount of N and P fertilizer was relative low. The result is different from the previous result reported by Wargiono (2003). The application of unbalanced fertilization, 0 kg N, 50 kg P2O5; 90 kg K2O and 90 kg N, 50 kg P2O5, 0 kg K2O on land with pH 4.5, p content 2.2% (medium) and K content 0.45 me/100 d (medium), in Lampung, gave low tuber yield. On the other hand, the application of balanced fertilization,
90 kg N + 50 kg P2O5 + 90 kg K2O)/ha gave a good yield.
Based on Table 1, it can be seen the interaction of clones and locations was significantly difference for starch yield. This was due to the heterogeneity of clones and the locations. Cassava is a cross pollinated crop and
therefore the plant is in heterozygote stage (Halsey et al.
2008). This condition makes the chance of the clone x locations interaction for quantitative characters is high. Sundari and Hartojo (2000) showing that the interaction effect between clones and locations was significant for tuber yield, starch yield, plant height, and number of tuber
per plant (Sundari and Hartojo 2000; Sundari et al. 2010).
Genotype interacts with environment to produce phenotype is natural low. This phenomena was also reported by Sundari (2009) and Kakani and Sharma (2010).
It showed that the starch yield of MLG 10.311 was the highest. However, this clone was the unstable clone based on AMMI models, this clone has specific adaptation which was adaptive to the location with a low bulk density of subsoil. In addition, tubers of clone MLG 10311 were 7% more efficient in producing bioethanol compared to Adira
4 (Ginting et al. 2009). For ethanol production, starch content of tuber is important. Result of biplot analysis of data reported by Ginting et al. (2009) can be seen that starch content was negative correlation with the value of conversion of tuber to ethanol (r = -0.68*). It means that the tubers with high starch content are more effective converted to ethenol than the tuber with low starch content.
Based on the Figure 2, it can be determined the clone with wide adaptation and the clone with specific adaptation. Clone 1 (CMM97001-87), 4 (CMM97002-183), 3 (CMM97011-191), 5 (CMM97002-36), 8 (CMM97006-52), 11 (CMM97006-44), and 14 (Adhira 4) were classified as the stable clones.Clone 2 CMM97015-255, 12 (CMM97001-12), 13 (UB 1-2), 9 (Adhira 1), 15 (MLG 10311), 6 (CMM97007-145), 7 (CMM97007-235), and 10 (Malang 2) were classified as the unstable clones. There are two possibilities why cassava is adaptable to various conditions of location; ie. the clone is a hybrid, and its genetic potential.
An advanced trial for clone MLG 10311 was also needed, so that this clone can be released as a new variety especially adapted to mineral soil with low bulk density on subsoil. In selection and evaluation, the bulk density on subsoil is needed to be attained specifically, so that the probability to get a new variety with wide adaptability is high.
IPCA 1 was positively correlated with bulk density of subsoil. The bulk density will increase if IPCA 1 scores increase. IPCA 2 was positively correlated with the maximum relative humidity 4 months after planting. However, IPCA 2 was negatively correlated with the soil pH of topsoil. Its implication is that to develop a new variety which is stable for starch yield, the important environmental factors i.e. bulk density of subsoil, and the maximum relative humidity 4 months after planting, and the topsoil pH should be considered in the process of clone selection and evaluation.
REFERENCES
Chaudhary RC, Ahn SW. 1996. International network for genetic evaluation of rice (INGER) and its modus operandi for
multi-environment testing. In: Cooper, Hammer (Eds). Plant
Adaption And Crop Improvement. Cambridge: Univ Pr. p 139-164.
Eberhart SA, Russel WL. 1966. Stability parameters for comparing varieties. CRPSAY 6:36-40.
Finlay KW, Wilkinson GN. 1963. The analysis of adaptation in a
plant breeding programme. Aust J Agric Res 14:42-54.
doi:10.1071/AR9630742
Freeman GH, Perkins JM. 1971. Environmental and genotype-environmental components of variability. VIII. Relations between genotypes grown in different environment and
measure of these environments. Heredity 26:15-23.
doi:10.1038/hdy.1971.67
Gauch HG. 1992. Statistical Analysis of Regional Yield Trial. Netherlands: Elsevier Science publishers Amsterdam. Ginting E, Sundari T, Saleh N. 2009. Ubikayu sebagai bahan baku
industri bioetanol. Buletin Palawawija 17:1-10.
Kakani RK, Sharma Y. 2010. Genec component analysis for yield and yield contributing traits undr diverse environment in
Barley. SABRAO J Breeding Genetics 42:9-20.
Perkins JM, Jink JL. 1968. Environmental and genotipe environmental components of variability III. Multiple lines and crosses. Heredity 23:239-256.
Shukla GK. 1972. Some statistical aspects of portioning
genotype-environmental components of variability. Heredity
29:237-245. doi:10.1038/hdy.1972.87
Sumertajaya IM. 2005. Kajian pengaruh inter blok dan interaksi pada uji lokasi ganda dan respon ganda [Disertasi]. Bogor, Bogor Agricultural Univ.
Sundari T. 2009. Morphological and physiological characteristics of shading tolerant and sensitive mungbean genotypes. Hayati J Biosci 16:127-134.
Sundari T, Hartojo K. 2000. Stabilitas hasil klon-klon ubikayu. Agritek 11:582-585.
Sundari T, Noertwijati K, Mejaya IMJ. 2010. Hubungan antara
komponen hasil dan hasil umbi klon harapan ubi kayu. J
Penelitian Pertanian Tanaman Pangan 29:29-35.
Sutjihno. 1996. Calculation of AMMI model using MSTAT program. Penelitian Pertanian 15:38-42.
![Figure 2. Biplot of IPCA 1 and IPCA 2 for clones based on starchyield in six months [r1= radius of ellipse for IPCA1 =16.3; r2 = radius (r) of ellipse for IPCA2 =14.1]](https://thumb-ap.123doks.com/thumbv2/123dok/764531.369502/4.595.57.284.461.699/figure-biplot-starchyield-months-radius-ellipse-radius-ellipse.webp)
