Assessment of Commercial Quality Evaluation of Yellowin Tuna Thunnus albacares
Meat Based on Myoglobin Properties
Mala nurilMala1, Hideki uShio1, Gen kaneko1 and Yoshihiro ochiai2*
1 Laboratory of Marine Biochemistry, Graduate School of Agricultural and Life Sciences, The University of Tokyo, Bunkyo, Tokyo 113-8657,
Japan
2 Department of Fisheries Science, School of Marine Science and Technology, Tokai University, Shimizu, Shizuoka 424-8610, Japan
Received September 23, 2012; Accepted November 18, 2012
Four quality grades (excellent, good, acceptable, and “not acceptable”) of yellowin tuna meat ( Thun-nus albacares), as judged by a professional appraiser, were compared based on the red/ox state and ex-tractability of myoglobin (Mb). As a result, the metMb ratio of the “not acceptable” grade of meat was signiicantly higher than that of the other higher-grade samples. In contrast, the highest ratio of oxyMb was found in the “excellent” meat, followed by good > acceptable > “not acceptable” meats. Color mea-surement revealed signiicant differences in a* value between the different grades of meat, but showed essentially no difference in L* and b* values. Both a* value and redness index (a*/b*) showed high corre-lation coeficients with metMb ratio. Mb extractability tended to be higher in the higher grade of meat. In conclusion, the commercial appraisal of tuna meat quality was demonstrated to be reliable.
Keywords: tuna, meat, quality, color, myoglobin
*To whom correspondence should be addressed. E-mail: [email protected]
Introduction
Seven species of tunas are consumed around the world. Yellowin tuna (Thunnus albacores), whose meat is charac-terized by a light red color and less fat, is one of the most commercially important and favored tuna species. This scombridae species inhabits tropical and subtropical waters around the world. Therefore, this species is generally export-ed to Japan from tropical countries, such as Indonesia, Tai-wan, and so on (MMAF, 2012). A quality check is frequently performed before processing and transportation. Sensory analyses performed by experienced appraisers are generally carried out to determine freshness as a composite of qualita-tive traits. Color is one of the most important factors affect-ing consumer preferences. The meat color of tuna is closely related with myoglobin (Mb) content and the red/ox state of the heme iron.
Mb is a small globular protein whose biological func-tion is basically to temporarily store oxygen in skeletal and cardiac muscles for facilitation of respiration (Livingston et al., 1983), though new functions of Mb have been recently
reported, such as nitrogen oxide scavenging activity (Cos-sins and Berenbrink, 2008; Flögel et al., 2010; Helbo et al., 2012). Generally, Mb content changes dependent on animal species, muscle part, age, and diet of the animal. Pale col-ored meat, such as chicken and pork, generally contain lower concentrations of Mb compared with red colored meat such as beef. Oxidative muscles, namely, slow skeletal muscle (including the dark muscle of ish) and heart muscle, contain abundant Mb. In scombridae ish such as tuna, abundant Mb is also found in fast skeletal muscle (also referred to as ordi-nary muscle, light muscle or white muscle).
An iron atom of heme is placed in the hydrophobic region of Mb, binding the imidazole group of proximal histidine di-rectly and distal histidine through a coordinate bond (Phillips and Schoenboen, 1981). The binding of oxygen, as well as the state of an iron atom in the heme pocket, contributes to the meat color; the Fe2+ form appears bright red and purple in
color while the Fe3+ one appears brown.
Determination of Mb derivatives The following pro-cedures were carried out at 0 − 4℃ unless otherwise stated. The meat slice samples were homogenized with 7 volumes of ice cold water under moderate speed for 1 min using a homogenizer (Polytron model PT 10 − 35, Kinematica AG, Littau, Switzerland). The supernatants obtained by cen-trifugation at 3000 g for 15 min were iltered through ilter paper (No.2, Advantec Co., Tokyo, Japan), and subsequently iltered through a cartridge ilter (0.20 µm pore size, RC 15; Sartorius, Goettingen, Germany). Visible spectra were mea-sured in the range of 380 nm to 780 nm using a spectropho-tometer (V-630 Bio, Jasco, Tokyo, Japan). The ratio of Mb derivatives (deoxyMb, oxyMb and metMb) was calculated based on absorbance at 380 and 780 nm (Tang et al., 2004). The measurement was performed in duplicate for ten meat samples for each grade.
Electrophoresis SDS-polyacrylamide gel electrophore-sis (SDS-PAGE) was carried out on the water-soluble frac-tion basically according to Laemmli (1970). After the run, the gel was stained with Coomassie Brilliant Blue (CBB) R-250. Equal volumes of the extracts from the different grades of meat were applied to the gel.
Measurement of Mb extractability The water-soluble fraction (prepared as described above) was used for the mea-surement of Mb extractability, as a parameter for the extent of Mb insolubilization (Chen and Chow 2001; Chow et al., 2009). To 1 mL of the extract was added 0.5 mL of 25 mM potassium buffer (pH 7.0) and gently mixed. Next, 25 µL of 5 % NaNO3 was added, followed by addition of 25 µL of 1
% KCN. After incubation of the mixture at room temperature for 1 min, the absorbance of the mixture was measured at 540 nm (A540). To calculate the concentration of Mb, the
mo-lecular extinction coeficient (11300) and momo-lecular weight (16000) were used to facilitate calculation (Chow et al., 2009). Mb concentration was calculated using the following equation.
Extractability of Mb (mg/100 g) = A540 × 2 × 16000
Meat color The color of the meat slice samples was measured with a colorimeter (NF333, Nippon Denshoku Co., Tokyo, Japan). The tristimulus (L*, a*, and b*) values (Hunt, 1977) were measured in triplicate for each sample meat slice. The redness index (a*/b*) was also adopted to evaluate the meat color according to Chen et al. (1997). The correlation between metMb ratio with a*, and metMb ratio with a*/b* were examined as described by Ochiai et al. (1988).
Statistical analysis JMP 7.0.2 (SAS Institute, Cary, NC, USA) was used for all the statistical analyses. Experimental results were provided as mean values with standard devia-tions. The data were analyzed using one-way analysis of Imamura et al., 2012). However, the reliability of quality
ranking by sensory evaluation has not yet been well docu-mented to date. Thus, the objective of this study was to in-vestigate the reliability of quality grading of yellowin tuna meat by measuring color and examining the characteristics of Mb derivatives.
Materials and Methods
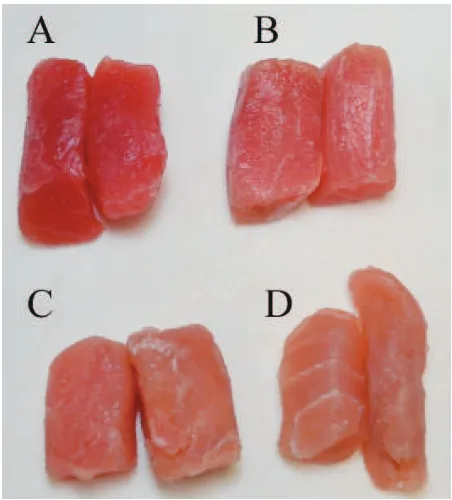
Sample preparation Fresh yellowfin tuna specimens, caught by long-line ishing in the Celebes Sea and landed at the Port of Bitung, Sulawesi, Indonesia, in August of 2009, were obtained. Samples were ranked into four categories by sensory evaluation (mostly according to appearance, odor, and inger touch) of a professional qualiied appraiser belonging to a tuna meat processing company (Nutrindo Fishery Co.); namely, excellent, good, acceptable, and “not acceptable” grades, the basic grading for Japanese and US markets (Fig. 1). Ten different individuals were obtained for each group. The meat (fast skeletal muscle) was sampled from the dorsal part of the fish, wrapped in polyethylene ilm and immediately transported on ice to our laboratory in Tokyo (via jet plane within one day). Samples were stored at −80℃ until used for the experiment (for up to 6 months). Just before the experiment, the meat in the vinyl bag was thawed in tap water and immediately subjected to the follow-ing analyses.
Chemicals All the chemicals used in this study were of reagent grade, purchased through Wako Co., Otsu, Japan.
meat was approximately 18%, suggesting this meat grade was very fresh. The value is comparable to that of bigeye tuna (Thunnus obesus) meat frozen by air-blast freezing at −70℃ for 48 h and stored at −55℃, which was reported to be 20 − 25% (Imamura et al., 2012).
SDS-PAGE Figure 3 shows the SDS-PAGE patterns
of the water-soluble fractions of yellowin tuna meat of dif-ferent quality grades. The molecular weight of yellowfin tuna Mb without posttranslational modiication is 15574, as reported by Lee et al. (2003). This band (Mb) is highlighted in the igure with an arrow. Irrespective of the quality grade, the protein fraction showed similar electrophoretic patterns, except for the densities of the bands X and Y indicated in the igure. Band X, which is considered to be a decomposed variance (ANOVA). Differences among the different grades
of tuna meat were analyzed using the Tukey-Kramer test (Steel and Torrie, 1988), and statistical signiicance was de-termined at P < 0.01 and P < 0.05 levels.
Results and Discussion
As shown in Fig. 1, high quality meat is distinguishable by its vivid red color, but as deterioration proceeds, the red-ness is reduced and a whitish color becomes pronounced. The quality of yellowin tuna meat was found to remain basi-cally unchanged during storage at −84℃ for up to approx. one month, as demonstrated by parameters such as K value and pH (Agustini et al., 2001). However, slight discoloration of tuna meat during freezing/thawing has been reported (Chow et al., 1988). Moreover, the lower grade meat also emitted a ishy odor (data not shown).
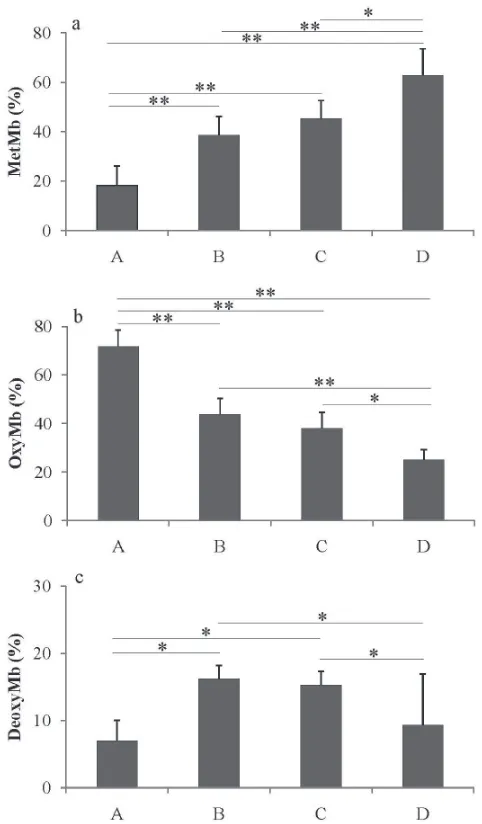
Mb derivatives ratio In this study, the relation between quality and Mb derivatives of yellowin tuna meat was inves-tigated. The deterioration of meats is partly induced by met-Mb formation, resulting in browning of the meat. The ratio of Mb derivatives, namely, deoxyMb, oxyMb, and metMb was determined based on the spectrophotometric absorption of the meat extract. The grade of meat was signiicantly cor-related with metMb ratio (%) (Fig. 2a); i.e., the value was the lowest in the excellent grade meat, and gradually increased as the grade of meat decreased. However, the values for the good and acceptable grades were similar to each other, with no signiicant difference between them.
The oxyMb ratio was inversely related with metMb ra-tio (Fig. 2b). Both metMb and oxyMb rara-tios could be good parameters indicative of the quality of tuna meat. As far as the deoxyMb ratio is concerned, no significant correlation with meat quality was recognized, except for the excellent and “not acceptable” meats (Fig. 2c). The ratio of deoxyMb tended to be higher, probably because of the exposure of the meat samples to the ambient air during transportation to the lab, even though the samples had been kept in vinyl bags and ice-stored as described above. This value corresponds to the value observed at partial oxygen pressure of ~ 9 mm Hg (Faustman and Cassens, 1990), suggesting a slight decrease of deoxyMb during handling of the samples in the present study.
Oxygen binds to the sixth coordination site of ferrous heme, appearing bright red color on the surface. Conversion of ferrous oxyMb to ferric metMb, via autoxidation, causes browning of the meat and is considered undesirable by con-sumers. Therefore, maintenance of the bright red meat color, representing freshness, occurs mainly through managing the red/ox state of an iron atom by reducing the Mb autoxidation rate. In this study, metMb ratio of the excellent grade tuna
oxidation resulted in increased L* and decreased a* values (Chow et al., 1990, Chen and Chow, 2001). This discrep-ancy might be due to the lower Mb content of yellowin tuna meat.
Next, the redness index (a*/b*) was calculated using the data in Fig. 4, and was compared between the different grades (Fig. 5). The values were found to be significantly different between the different meat quality grades. Even between the B and C meat grades, a signiicant difference (P
< 0.05) was observed. This value clearly represented differ-ences in the quality of tuna meat.
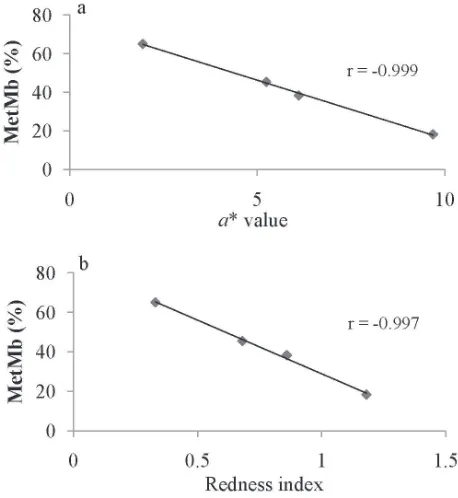
The correlations of a* value and redness index against metMb ratio (%) value are shown in Fig. 6. The correlation coeficients were −0.999 and −0.997 for a* and redness in-dex against metMb ratio, respectively. These results are quite similar to previous reports on fish Mb (Chow et al., 1988; Ochiai et al., 1988; Chen and Chow, 2001).
Extractability of Mb Mb concentrations of the water extracts, namely the extractability of Mb from the different protein, was present except for in the excellent grade meat,
while the density of band Y, approx. 40 kDa, (including the one just below this band) was clearly low in the “not accept-able” grade meat. In this grade, there were also other bands of lower staining intensities compared to those of higher-grade meat. This seems to be the result of protein denatur-ation in the low quality meat. Stagg et al. (2012) observed protein degradation triggered by acidiication and high tem-perature in the muscle of skipjack (Katsuwonus pelamis). It was concluded that meats of excellent and “not acceptable” quality grades are clearly distinguishable from each other.
The results further confirmed the reliability of sensory evaluation, although differences between meats of good and acceptable grades were not recognized. In this context, in the case of bluefin tuna (Thunnus orientalis), the protein band of about 50 kDa, which is considered to be creatine kinase, decreased in low quality meat or burnt meat (Ochiai, 2010). In the case of yellowin tuna, band Y could be a parameter of meat quality. Creatine kinase has already been characterized as an indicator of physical stress and muscle damage in live-stock animal production (Daroit and Brandelli, 2008).
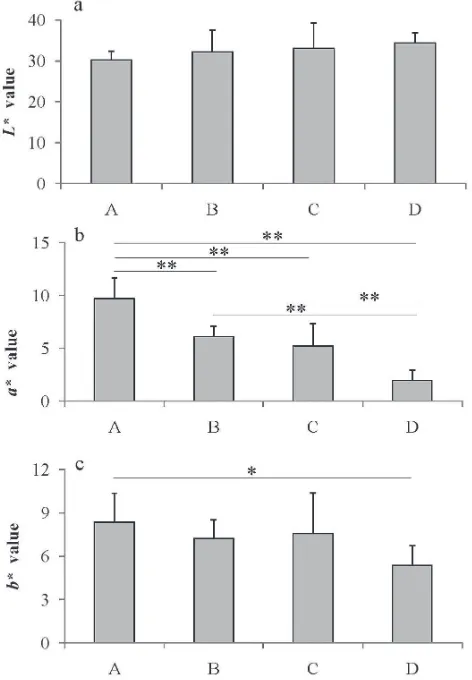
Color measurement The L*, a* and b* values of the different quality grades of tuna meat are shown in Fig. 4. The
L* value did not differ significantly between the different meat quality grades (Fig. 4a). The values were around 30, with no signiicant differences, and therefore, did not relect meat quality. On the other hand, the a* value tended to be smaller in the lower grades of meat (Fig. 4b). The values were signiicantly different (P < 0.01) between any combina-tions of meat quality grades. The result is quite reasonable, since the value is roughly proportional to the optical mani-festation of meat redness (Fig. 1). It was concluded that a* value is an excellent parameter to distinguish meat quality. In the case of b* value, there were almost no signiicant dif-ferences between the meat of different quality grades (Fig. 4c). Previous studies on bluein tuna meat disclosed that Mb
Fig. 4. Differences in the tristimulus values of different quality grades of tuna meat. A, excellent; B, good; C, acceptable; D, “not acceptable”. a, L* value; b, a* value; c, b* value. The asterisks rep-resent signiicant differences (**P < 0.01 and *P < 0.05). Data are shown as average with standard deviation (n = 10 for each grade). Fig. 3. SDS-PAGE patterns of the water-soluble fractions from
the a* value of meat and the Mb concentration of the water extract (r = −0.990).
These significant differences in Mb derivatives ratio could have been due to differences in the freshness of the fish. Namely, in the case of long-line fishing, the time re-quired for harvesting ish on board the ships differs greatly, because there are so many hooks on the line. Some ish are harvested alive, while others are dead and remain in the warm seawater for a long time. For this reason, it is impos-sible to harvest fish of similar freshness using this fishing method. The ranking of ish quality before shipping is thus very important.
As described above, tuna meat quality deteriorates under sub-optimal storage conditions. In the case of yellowin tuna, low meat quality is considered to result from prolonged incu-bation of the catch in the warm seawater postmortem. Body temperature is generally maintained at a higher tempera-ture than that of ambient seawater (Carey and Teal, 1966). Muscle pH is also considered to decrease in postmortem tuna meat (Roy et al., 2011). Tuna Mb is quite unstable at a high temperature range and under low pH (Chow et al., 1989). Preincubation of puriied tuna Mb at 40℃ and pH 6 resulted in its structural decay (Ochiai, 2011), suggesting that Mb in the yellowin tuna meat was denatured.
grades of meat, are shown in Fig. 7. Signiicant differences were found between any combinations of meat grades. Mb concentration is also an excellent parameter of meat quality grade. Mb concentration should be very similar in a given species (Brown, 2006); therefore, it is likely that Mb was partially denatured and insolubilized. The extractability of Mb was reduced in lower grades of meat. The absolute con-tents of oxyMb, calculated based on the data of Figs. 2 and 7, were 157 ± 26.5, 63.7 ± 11.5, 50.6 ± 8.0 and 22.6 ± 5.5 mg/100 g for the excellent, good, acceptable and “not ac-ceptable” meats, respectively. The values seem to appropri-ately demonstrate quantitatively the quality of each grade. As
shown in Fig. 8, a close relationship was observed between Fig. 8. Correlation between Mb extractability and a* value. Fig. 7. Mb extractability in meat of different quality grades. A, excellent; B, good; C, acceptable; D, “not acceptable”. The aster-isks represent signiicant differences (**P < 0.01 and *P < 0.05). Data are shown as average with standard deviation (n = 10 for each grade).
Fig. 5. The redness index (a*/b*) of different quality grades of tuna meat. A, excellent; B, good; C, acceptable; D, “not acceptable”. The asterisks represent signiicant differences (**P < 0.01 and *P < 0.05). Data are shown as average with standard deviation (n = 10 for each grade).
dential Scholarship (JIPS) -World Bank. The authors would like to thank Dr. H. Tjandrason for collecting the specimens used in the present study and also Professor S. Watabe, Kitasato University, for his useful advices throughout the study.
References
Agustini, T.W., Suzuki, T., Hagiwara, T., Ishizaki, S., Tanaka, M. and Takai, R. (2001). Change of K value and water state of yel-lowin tuna Thunnus albacares meat stored in a wide temperature range (20℃ to −84℃). Fish. Sci., 67, 306-313.
Birnbaum, G.I., Evans, S.V., Przybylska, M. and Rose, D.R. (1994). 1.70 Å resolution structure of myoglobin from yellowin tuna. An example of a myoglobin lacking the D helix. Acta Cryst. D, 50, 283-289.
Brown, W.D. (2006). The concentration of myoglobin and hemo-globin in tuna lesh. J. Food Sci., 27, 26-28.
Carey, F.G. and Teal, J.M. (1966). Heat conservation in tuna fish muscle. Proc. Nat. Acad. Sci. USA, 56, 1464-1469.
Chajian, M., Benjakul, S., Visessanguan, W., Lee, S. and Faustman, C. (2008). Interaction of fish myoglobin and myofibrillar pro-teins. J. Food Sci., 73, 292-298.
Chen, H.H., Chiu, E.M. and Huang, J.R. (1997). Color and gel forming properties of horse mackerel (Trachurus japonicus) as related to washing conditions. J. Food Sci., 62, 985-991.
Chen, W.L. and Chow, C.J. (2001). Studies on the physicochemical properties of milkish myoglobin. J. Food Biochem., 25, 157-174. Chow, C.J. (1991). Relationship between the stability and
autoxida-tion of myoglobin. J. Agric. Food Chem., 39, 22-26.
Chow, C.J., Chu, Y.J. and Wang, L.C. (1990). Comparison of heme pigment extraction from tuna and round herring. The Proceedings of The Second Asian Fisheries Forum, pp. 877-880. Asian Fisher-ies Society, Manila, Philippines.
Chow, C.J., Ochiai, Y. and Hashimoto, K. (1985). Effect of freezing and thawing on the autoxidation of bluein tuna myoglobin. Bull. Japan. Soc. Sci. Fish., 51, 2073-2078.
Chow, C.J., Ochiai, Y., Watabe, S. and Hashimoto K. (1988). Effect of freezing and thawing on the discoloration of tuna meat. Bull. Japan Soc. Sci. Fish., 54, 639-648.
Chow, C.J., Ochiai, Y., Watabe, S. and Hashimoto, K. (1989). Re-duced stability and accelerated autoxidation of tuna myoglobin in association with freezing and thawing. J. Agric. Food Chem., 37, 1391-1395.
Chow, C.J., Yang, J.I., Lee, P.F. and Ochiai, Y. (2009). Effect of acid and alkaline pretreatment on the discoloration rates of dark muscle and myoglobin extract of skinned tilapia illet during iced storage. Fish. Sci., 75, 1481-1488.
Cossins, A.R. and Berenbrink, M. (2008). Myoglobin’s new clothes. Nature, 454, 416-417.
Daroit, D.J. and Brandelli, A. (2008). Implication of skeletal muscle creatine kinase to meat quality. J. Anim. Feed Sci., 17, 285-24. In order to understand the molecular mechanisms
in-volved in postmortem quality deterioration of red colored meat, it would be advantageous to characterize Mb proper-ties. Mammalian Mbs have eight α-helical segments, desig-nated A through H. However, the D-helix is missing in ish Mbs, as reported by Birnbaum et al. (1994). This appears to be the reason why ish Mbs are less stable than their mam-malian counterparts (Ochiai et al., 2010). The thermal de-naturation of tuna Mb consists of three stages, based on the measurement of α-helical content by circular dichroism (CD) spectrometry (Ochiai et al., 2010). In addition, ish Mb con-tains a cysteine residue, which is absent in mammalian Mbs (Livingston and Brown, 1981). This could be the reason for the higher aggregation tendency of fish Mbs (Chow et al., 1989; Faustman and Cassens, 1990).
Previous studies reported that the structural stabilities of scombridae ish Mbs clearly differ among species, although the sequence identities of amino acids were in the range of 91 − 99% (Ueki et al., 2004; 2005; 2006). Among them, skipjack tuna Mb was the most thermostable, and bullet tuna (Auxis rochei) Mb showed the lowest stability. Thermal sta-bilities of tuna Mbs, including that of yellowin tuna, fall in between those of skipjack tuna and bullet tuna Mbs (Ueki
et al., 2004). Slight differences in stability have also been reported among tuna Mbs (Chow, 1991). In spite of these facts, tuna Mbs are considered to be more stable than those of stenothermal ish species, as demonstrated by differences in the autoxidation rate (Madden et al., 2004).
The mechanism responsible for Mb aggregation has been partly characterized; Mb itself tends to self-aggregate (Chow
et al., 1989), whereas it has been reported that, in postmor-tem meat, Mb binds to myoibrillar proteins (Chajian et al., 2008) or reacts with fatty acids (Suman et al., 2007).
Conclusions
The quality of yellowfin tuna as evaluated using sen-sory tests by a professional appraiser was found to be quite reliable based on the results of Mb derivatives ratio, color measurement, Mb concentration, and electrophoretic patterns of the water soluble protein fraction. It follows that even untrained persons can judge the meat quality grade by using these methods. Meanwhile, it is very important to establish how the high quality of meat can be maintained. First of all, the method of harvesting fish should be improved, while handling, storage and transportation conditions also require reconsideration.
Presi-nus thynPresi-nus orientalis. Nippon Suisan Gakkaishi, 76, 695-704. Ochiai, Y. (2011). Temperature dependent structural perturbation of
tuna myoglobin. World Acad. Sci. Eng. Technol., 74, 731-735. Ochiai, Y., Chow, C., Watabe, S. and Hashimoto, K. (1988).
Evalu-ation of tuna meat discolorEvalu-ation by Hunter color difference scale. Bull. Japan Soc. Sci. Fish., 54, 649-653.
Ochiai, Y., Watanabe, Y., Ozawa, H., Ikegami, S, Uchida, N. and Watabe S. (2010). Thermal denaturation proiles of tuna myoglo-bin. Biosci. Biotechnol. Biochem., 74, 1673-1679.
Phillips, S.E.V. and Schoenboen, B.P. (1981). Neutron diffraction reveals oxygen-histidine hydrogen bond in oxymyoglobin. Na-ture, 92, 81-82.
Roy, B.C., Ando, M., Itoh, T. and Tsukamasa, Y. (2011). Structural and ultrastructural changes of full-cycle cultured Paciic bluein tuna (Thunnus orientalis) muscle slices during chilled storage. J. Sci. Food Agric., 92, 1755-1764.
Stagg, N.J., Amato, P.A., Giesbrecht F. and Lanier, T.C. (2012). Au-tolytic degradation of skipjack tuna during heating as affected by initial quality and processing conditions. J. Food Sci., 77, C149-C155.
Steel, R.G.D. and Torrie, J.H. (1980). “Principles and procedures of statistics.” New York: McGraw-Hill.
Suman, S.P., Faustman, C., Sramer and S.L., Liebler, D.C. (2007). Proteomics of lipid oxidation-induced oxidation of porcine and bovine oxymyoglobins. Proteomics, 7, 628-640.
Tang, J., Faustman, C. and Hoagland, T.A. (2004). Krzywicki revis-ited: equations for spectrophotometric determination of myoglo-bin redox forms in aqueous meat extract. J. Food Sci., 69C, 717-720.
Trout, G.R. (1989). Variation in myoglobin denaturation and color of cooked beef, pork and turkey meat as inluenced by pH, sodi-um chloride, sodisodi-um tripolyphosphate, and cooking temperature. J. Food Sci., 54, 536-540.
Ueki, N., Chow, C.J. and Ochiai, Y. (2005). Characterization of bul-let tuna myoglobin with reference to thermostability – structure relationship. J. Agric. Food Chem., 53, 4968-4975.
Ueki, N. and Ochiai, Y. (2004). Primary structure and thermosta-bility of bigeye tuna myoglobin in relation to those from other scombridae ish. Fish. Sci., 70, 875-884.
Ueki, N. and Ochiai, Y. (2006). Effect of amino acid replacement on the structural stability of ish myoglobin. J. Biochem., 140, 649-656.
Duran, A., Erdemli, U., Karakaya, M. and Yilmaz, M.T. (2008). Effects of slaughter methods on physical, biochemical and mi-crobiological quality of rainbow trout Oncorhynchus mykiss and mirror carp Cyprinus carpio illeted in pre-, in- or post-rigor peri-ods. Fish. Sci., 74, 1146-1156.
Faustman, C. and Cassens, R.G. (1990). The biochemical basis for discoloration in fresh meat: a review. J. Muscle Foods, 1, 217-243.
Faustman, C., Sun, Q., Mancini, R. and Suman, S.P. (2010). Myo-globin and lipid oxidation interactions: mechanistic bases and control. Meat Sci., 86, 86-94.
Flögel, U., Fago, A. and Rassaf, T. (2010). Keeping the heart in balance: the functional interactions of myoglobin with nitrogen oxides. J. Exp. Biol., 213, 2726-2733.
Helbo, S., Dewilde, S., William, D.R., Berghmans, H., Berenbrink, M., Cossin, A.R. and Fago, A. (2012). Functional differentiation of myoglobin isoform in the hypoxia-tolerant carp indicates tis-sue-speciic protective roles. Am J. Physiol. Regul. Integr. Comp. Physiol., 302, R693-701.
Hunt, R.W.G. (1977). The specification of colour appearance. 1. Concept and terms. Color Res. Appl., 2, 55-68.
Imamura, S., Suzuki, M., Okazaki, E., Murata, Y., Kimura, M., Kimiya, T. and Hiraoka, Y. (2012). Prevention of thaw-rigor dur-ing frozen storage of bigeye tuna Thunnus obesus and meat qual-ity evaluation. Fish. Sci., 78, 177-185.
Laemmli, U.K. (1970). Cleavage of structural proteins during as-sembly of the head of bacteriophage T4. Nature, 227, 680-685. Lee, S., Joo, S.T., Alderton, A.L., Hill, D.W. and Faustman. (2003).
Oxymyoglobin and lipid oxidation in yellowfin tuna (Thunnus albacares) loins. J. Food Sci., 68, 1664-1668.
Livingston, D.J. and Brown, W.D. (1981). The chemistry of myo-globin and its reactions. J. Food Technol., 35, 244-252.
Livingston, D.J., Lamar, G.N. and Brown, W.D. (1983). Myoglobin diffusion in bovine heart muscle. Science, 220, 71-73.
Madden, P.W., Babcock, M.J., Vayda, M.E. and Cashon, R.E. (2004). Structural and kinetic characterization of myoglobins from eury-thermal and stenoeury-thermal ish species. Comp. Biochem. Physiol., 137B, 341-350.
MMAF (Ministry of Marine Affairs and Fisheries). (2010). Indone-sian Fishery Statistics.