Depth Image Layers Separation (DILS) Algorithm of
Image View Synthesis based on Stereo Vision
Nurulfajar
AbdManap
#1,John J. Soraghan *2,
Lykourgos Petropoulakis *3
# Faculty of Electronic and Computer Engineering, Universiti Teknikal Malaysia Melaka, Durian Tunggal, 76100, Melaka, Malaysia
* Centre for Excellence in Signal and Image Processing (CeSIP), Electronic and Electrical Engineering Department, University of Strathclyde, Glasgow, United Kingdom
2 j . soraghan@eee. strath. ac. uk
3 1. petropoulakis@eee. strath. ac. uk
Abstact- A new Depth Image Layers Separation (DILS) algorithm for synthesizing inter-view images based on disparity depth map layers representation is presented. The approach is to separate the depth map into several layers identiied through histogram-based clustering. Each layer is extracted using inter view interpolation to create objects based on location and depth. DILS is a new paradigm in selecting interesting image locations based on depth, but also in producing new image representations that allow objects or parts of an image to be described without the need of segmentation and identification. The image view synthesis can reduce the coniguration complexity of multi camera arrays in 3D imagery and free-viewpoint applications. The simulation results show that depth layer separation is able to create inter-view images that may be integrated with other techniques such as occlusion handling processes. The DILS algorithm can be implemented using both simple as well as sophisticated stereo matching methods to synthesize inter-view images.
I. INTRODUCTION
With new developments in display and camera technologies, multi-view imaging systems are receiving widespread attention. Using a limited number of cameras results in 3D scenes being described only rom speciic visual angles. Intermediate views may be obtained through dense camera conigurations, which entail additional equipment and coniguration costs. Alternatively, intermediate view synthesis and rendering algorithms compose images and locate them in virtual viewpoints between source image viewpoints [1]. Most existing intermediate view synthesis algorithms are based on disparity estimation [2] with many methods using the taxonomy presented in Scharstein and Szeliski [3].
Layers have been used in many applications for multi-view images. Several layered representations have been proposed as in the layered depth images by Shade [4] and in the ree viewpoint video by Zitnick [2]. These methods are designed to produce an accurate depth map of the scene. New views of the scene are rendered through warping of the layers. This is very sensitive to errors in depth reconstruction [5]. Other layered representations are designed for image-based rendering such as the coherent layers in pop-up light ield [6] and plenoptic layers [7]. These representations are based on approximate geometry rather than exact depth. There is a relation between
the complexity of the scene (depth variation, occlusion, non lambertian) and the actual layer extraction. Based on this relationships, the authors in [8] and [9] reconstruct an approximate depth map based on interpolating images with different constant depth ilters and using in-focus regions. In [6], the user manually extracts layers until satisied with the rendered result. Bleyer [10] divides one single surface that contains texture into several segments by applying colour segmentation. In general, the concept of layers and planes presented by the layered-based algorithms are similar with the main difference being on how the layers are assigned and extracted rom disparity maps. Sjostrom [11] outlines possible errors, such as empty cracks, translucent cracks, corona-like efects, unnatural contours and empty regions, occurring with 3D image synthesis for a layered - algorithm.
The rendering system presented in this paper contains several novel aspects and improvements over previous approaches. Firstly, the known geometry is not assumed as in Chai [12]. Secondly, user interaction is not required as in Shum [6]. Thirdly, the depth estimation in Li [8] is block based which may cause reconstruction artefacts in the boundaries of layers and does not take into account occlusions. Fourthly, Takahashi [9] does not take into account occlusions and relies on the user to indicate the number of layers. Finally, no geometrical information is required as in Berent [5]. Both the depth estimation and interpolation techniques in this paper take occlusions into account and the number of layers is estimated based on a histogram distribution.
II. DEPTH LAYERS REPRESENTATION
A. Disparity Depth Map
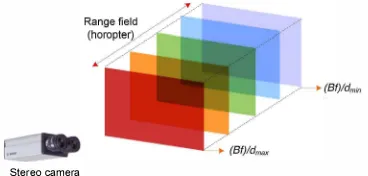
The basic concept of view synthesis with stereo matching data is to use pairs of neighbouring camera views in order to create and render arbitrary virtual views on a speciied camera path between them. Instead of transforming using the image based rendering (IBR) geometry technique, this approach will use the basic idea of range ield (horopter) rom the stereo rig of the camera. Basic geometry rules are used in order to calculate the 3D location or the range ield of the scene. For a simple case using a pair of perfectly aligned and exactly identical cameras on a stereoscopic rig it has been shown [13] that:
Z=� =B
XI-X.
d
(I)where XI and Xr are the respective let and the right image views PI and Pr of a point P in the physical world, d = XI-Xr is the disparity between these views, B denotes the baseline distance between let and right camera, f is the focal length of camera, and Z is the depth.
Disparity varies with object distance (depth), being higher for points closer to the cameras. The range ield of the system is constrained by the disparity range [dm!", dmax] with the baseline B and focal length! The depth measured by a stereo vision system is discretized into parallel planes or layers (one for each disparity value).
Stereo camera
Fig. 1. Disparity range and the corresponding layers, where the disparity value is higher for points closer to the camera.
The range ield for different disparity and depth is shown in Fig. 1. The igure indicates the disparity depth map can be distinguished to different layers by assuming the objects separated by certain distance. Based on the different layers of depth, the layers can be separated to focus on particular points or objects on the scene. The layers of disparity for a rectangular object through the disparity range are shown in Fig. I, where the disparity depth map consists of ive layers. Layer 1 represents the range ield of the scene that is nearest to the camera (i.e. (B)/dmax), with the last layer as the farthest (i.e. (B)/dmi
n
). This disparity depth information allows the formation of the new view synthesis based on a layered representation. Disparity information plays an important role in synthesizing intermediate views rom stereo images with the synthesized view quality depending mainly on the accuracy of the disparity estimation. In this work, area-based methods are used because disparity information for every pixel is required.B. Inter-view Synthesis Based on Disparity Depth Map
The main concept of view synthesis algorithms is to obtain inter-view syntheses by using a disparity depth map layers representation. Fig. 2(a) illustrates a virtual camera view of an image scene to be synthesized and located between real cameras 1 and 2. In the geometry model shown in Fig. 2(b), two identical cameras CL and CR are used. The cameras are on the same parallel coordinates and their image planes are coplanar [14, 15]. In this model, a 3D object point is simultaneously captured on both the let and right viewing planes. Hence a scene point P rom Fig. 2(b) projects onto the let and right image planes at points PL and PR respectively. The disparity rom let to right with the let image as the reference is given by:
(2)
where Z denotes the depth of point P.
Camera 1 Virtual Camera 2 camera view
(a) (b)
Fig. 2. Inter-view synthesis: (a) The virtual camera view placed between cameras 1 and 2. (b) Geometric stereoscopic camera model [15].
The virtual camera Cv, which corresponds to a position between cameras 1 and 2, is located a distance X rom the let camera. The disparity between the let and virtual cameras is given by [15]:
v = -XJ= =
(
�
)
dll =dll
(3)where �= x/B, O��� I, indicates the baseline ratio between the let and right images.
The multiple virtual cameras of Cv can be created along the between the let and right images according to the constraints of � to produce multi-view images.
Based on the calculated disparity maps over stereo image sequences, virtual views can be synthesized at any virtual camera position that is represented by the ratio of a baseline, �.
The most popular method is linear interpolation [16-17], which can be written as [16]:
r
(x')
=
(1-)Il (x
+i)
+J1R(x
+ (1-)d)
(4)where I) is the virtual view image, hand IR are the let and right images respectively, X and x' are pixel positions, d is the
This method has been adopted in several view synthesis systems proposed by Lu [14-15], Wang [I] and Jain [18]. However, the linear interpolation method oten results in blurring and ghostly effects. To reduce these artefacts, a new virtual view synthesis method is proposed in the DILS algorithm, which will be described in the following section.
III. DEPTH MAP BASED NOVEL VIEW SYNTHESIS ARCHITECTURE
The proposed depth map based view synthesis architecture consists of two main components: a stereo matching engine and a view synthesis module (Fig. 3). In the irst component disparity estimation through an area-based stereo matching algorithm is used to obtain the disparity depth map. The stereo matching engine uses a stereo matching algorithm and a disparity reinement process. The second component uses a new view synthesis approach. This separates the depth layers of the disparity depth map based on the disparity range. The layers are divided into non-occlusion and occlusion regions using their image histogram distributions. The non-occlusion regions contain several layers depending on the complexity of the disparity depth map. Linear interpolation is used on the regions in different modes according to the characteristics of each region. Ater each of the layers has been interpolated, the layers are lattened into single novel view image.
Let image Right image
Disparity refinement
Novel view synthesis
Stereo Matching Engine View Synthesis Module
Fig. 3. Block diagram of novel view synthesis based on depth map layers representation
The view synthesis module in Fig. 3 comprises the two main phases of the DILS algorithm: the depth layer separation and the intermediate view interpolation. The depth layer separation involves the histogram distribution, layers identiication and layer separation. The intermediate view interpolation synthesis includes the layer translation, mask layers, intermediate view interpolation and hole-illings.
The selection of stereo matching algorithms has been described by Scharstein and Szelinski in [3]. In this implementation, we used a basic Fixed Window (FW) searching similarity metric to calculate the matching pixels. Thus the SAD metric was selected due to faster execution, low computational effort, and because it performs better than the other similarity metrics, such as the Sum of Squared Differences (SSD) in the presence of outliers [19]. The area based method is selected because the disparity information for
every pixel is required to synthesize the new virtual view. In order to reine the obtained disparity depth map, we apply a Let-Right Consistency Check (LRCC) proposed by Fua [20] and image iltering techniques without explicitly enforcing any constraint about the underlining disparity maps. The inal disparity depth map ater the stereo reinement, known as the dLRC, is then used to obtain the novel view synthesis.
IV. INTER-VIEW SYNTHESIS USING OILS ALGORITHM The main idea of inter-view synthesis is to separate the depth map into several layers of depth based on the disparity distance of the corresponding points. The new view synthesis is interpolated independently for each layer of depth rom the let and right part of the image by masking the particular depth layer. The separation process of the layers is carried out ater evaluating the number of different layers on the disparity depth map. The disparity distribution is obtained using a histogram plot.
A block diagram of the Depth Image Layers Separation (OILS) algorithm is illustrated in Fig. 4. It consists of several important steps to obtain the inter-view synthesis of the stereo images. In the stereo matching engine, the raw disparity depth map, obtained rom the stereo matching algorithm, is processed with the stereo disparity reinement. At this stage, the depth map addresses the presence of occlusions through let-right consistency in order to remove uncertainty and eliminate false matches. A fast median ilter is applied to the results to urther remove outliers and produce a smooth depth map. The disparity depth map ater this stage, deined as dLRC,
signiies the let-right consistency check and is based on the let image as reference.
PHASE 1
Disparity depth map
Histogram distribution
Layers
identification
Layers
separation
PHASE 2
Layer i, i=O,l, . . ,O
Layers masking
All layers
PHASE 3
Final image synthesis
Fig. 4. Depth Image Layer Separation (DILS) algorithm
The view synthesis module consists of two main phases: depth layer separation and intermediate view interpolation synthesis. With reference to Fig. 4 a brief overview of the processes involved is provided here with more detailed explanations in the corresponding subsections.
level of the disparity depth map image, dLRc can be distinguished rom the histogram distribution, as detailed in subsection IV(1). Each disparity level, d is quantized based on a selected threshold to deine and identify the layers from 0 to
D, where D is the maximum number of layers.
The second phase incorporates an iterative process where every layer is processed. Here, the right image in each layer is translated into the let reference image. Layers are then masked based on whether they are occluded or non-occluded regions. The let and right images are then synthesized to produce the intermediate view interpolation for that particular layer. Since the intermediate virtual view image, t, Vlx,y), is located between the let and right camera images, the It,Vlx,y)
for each layer is translated to the right. Ater all layers have been processed, the collection of layered images module lattens the layers into a single image, i.e. the inter-view virtual camera image, Iv(x,y), in the third phase. The holes and cracks in the inal inter-view image are corrected in the hole-illing process. The following subsections (1) - (7) discuss in detail the processes involved in the algorithm.
I) Histogram Distribution: This stage is used in the disparity depth map to distinguish the number of matched pixels in each disparity level. For simpler depth maps, it consists of a few numbers of matched pixels depending on the disparity levels. However, for complex depth maps the distributions of matched pixels will be spread out along all disparity pixel values rom minimum to maximum. Consider the disparity depth map as an N-bit H greyscale image. There are d distinct sample values that could occur in the disparity depth map, depending on the disparity levels. The histogram of the disparity depth map image comprises a table of d integer values (rom dmin to dmax), where the klh entry in the histogram table contains the number of times a sample of value k occurs in the image map.
2) Layer Identication: The layers can be recognized immediately with the disparity level values [dmim dmax] on the stereo matching algorithm. For each layer matched pixels are concentrated over a relatively small disparity range on the histogram distribution. This distribution will depend on the complexity and the matched correspondence pixels of the stereo pair. Therefore, the number of layers for a disparity depth map can be obtained rom this histogram. The quantization of the matched pixels, p, is performed according to the following equation:
p'(d,) = 1, f p(d,) > T k E 0,1, ... 4m,
p'(d,) = 0, elsewhere
(5)
where T is the threshold to set the minimum number of pixels to be selected as the matched corresponding points for the stereo pair. In our experiments the value of T was set as 20 pixels.
The threshold values that match the pixels of p' with ' 1's can be grouped into layers. The process to identiY the layers uses an algorithm which is a modiied version of the zero run length algorithm so as to accommodate the search process of
the irst and last '1's in each layer or cluster. In order to extract the layers the threshold matched pixels, p' can be clustered and grouped as follows: (i) A group of two or more continuous 'O's is regarded as non-layer. It also signiies a separation of layers of continuous '1 's. (ii) A group of continuous ' 1 ' s (including a single ' 1') is regarded as a layer. (iii) An isolated individual '0' surrounded by 'I 's is regarded as '1' and the group is treated as in (ii) above.
The layers are grouped into two main regions: (a) Non occluded region - this layer is for the non-linear segment dk
into (i: D) layers (clusters), where iEl,2, ... ,D and
kE 0,1, ... (b) Occluded region - for a partly completed or occluded disparity map, the result is a '0'. With the layers identiied, we can determine the minimum (di(mil) and maximum (di(max) disparity range levels for each layer.
3) Layer Separation: With the maximum number of layers,
D, identiied, the starting point for the iteration process to synthesize each layer commences. The disparity depth map is divided into D layers with known di(min) and di(mn) for each lh
layer.
4) Layers Masking: Ater the let and right images for the disparity depth i have been located at the same pixel location points as the mask region, the next stage is to mask the layers. The let and right images are merged with the respective mask of the i'h layer. This stage will be iterated for every layer. For all translated images (let or right) the masked region of ' 1's will be replaced by the pixel values, which correspond to the same pixel locations.
5)
Intermediate View Interpolation: At this stage two identical images have been obtained for a particular region of interest based on the disparity depth. The new intermediate view, t,vlx,y) is obtained through an interpolation process. This obtains the pixel values rom the corresponding pixel values of the let and right masked images (Ii,L(M/X,y), Ii.R(M/x,y) in each layer. For this process a weighted element known as alpha blending, a, is used to obtain the correct pixelvalues. Thus the intermediate view t,vlx,y) is deined as follows:
(I (x, y) = aJl(M,( x, y) + (1- a )(R(M'(X, y)
i E 0,1, ... 0
where
(O; a; 1).
(6)
7) Hole-Filling: Holes and cracks between layers in the interpolated image may arise rom layer image translation when mapping the layers into a single image. An eicient method to overcome this error is to ill the holes by the adjacent pixels or offset vectors through the horizontal plane. Although these approaches are not very accurate, the holes can be easily corrected without reducing the quality of the image.
V. ESULTS AND DISCUSSION
This section gives a detailed evaluation of the proposed algorithm in terms of results and quality. In order to validate the performance of the DILS ramework, we performed the experiments with the Middlebury test scenes [3]. We use the following test data sets: 'Teddy' (450 x 375 pixels, search range: 60), 'Venus' (434 x 383 pixels, search range: 20), 'Tsukuba' (384 x 288 pixels, search range: 16) and 'Cones' (450 x 375 pixels, search range: 60). The 'Tsukuba' image set contains ive images (views 1-5), and the 'Venus', 'Teddy' and 'Cones' image sets contain nine images (views 0-8). The Middlebury image sets are performed with views I and 5 for the 'Tsukuba' image sets and views 2 and 6 for the 'Venus', 'Teddy' and 'Cones'. The synthesized view images created for the camera baseline ratio P=0.25, 0.5 and 0.75 at the views (2, 3, 4) for 'Tsukuba' and (3, 4, 5) for the remaining data sets. The samples of the let images for the Middlebury data sets are shown in Fig. 5.
Fig. 5. Middlebury data sets for the let image
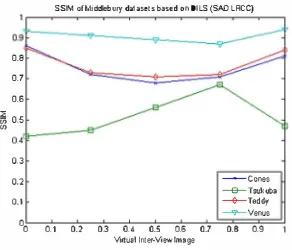
The proposed method was tested using the same parameters for all the test images. The weighted factor for alpha blending was a=0.5 in the intermediate view interpolation process. The sizes of the sets of the neighbouring pixels in the window searching cost were 21x21 ('Cones' and 'Teddy'), 11x11 (,Tsukuba') and 25x25 ('Venus'). The quality of the synthesized novel views that were obtained by the virtual camera with these approaches measured and analysed with the PSNR and SSIM index [21] performance measurements. In this assessment, the reconstructed novel view images for the virtual camera views were compared with the original images in the camera views. The results of PSNR and SSIM are calculated based on the conventional inter-view interpolation and DILS algorithms [22] for each camera view and shown in Tables 1 and 2.
For an objective evaluation, we compare reconstructed images using LI and DILS evaluating the results through PSNR and SSIM. The results are shown in Table 1 and Table 2 respectively. The DILS algorithm generally performs well compared with the LI, with an average PSNR of 33.52 dB and SSIM of 0.72. The LI and DILS performed best with the 'Venus' dataset. The 'Tsukuba' dataset produced the worst results in term of PSNR, MSE and SSIM. Most of the errors
were due to the high texture background region in the 'Tsukuba' image that cannot be interpolated accurately between the let and right images. Subjectively, the quality of the synthesized image views for all the datasets is satisfactory for ree-viewpoint applications. The overall performance of the DILS algorithm for the Middlebury datasets is shown in Fig. 6 and 7, which indicates that the 'Venus' produced the best result followed by 'Cones', 'Teddy' and 'Tsukuba'.
TABLE 1. PSNR RESULTS OF INTER-VIEW SYNTHESIS IMAGES BASED ON CONVENTIONAL LINEAR INTERPOLATION (LI) AND DILS ALGORITMS
� Teddy (dB) Venus (dB) Tsukuba Cones (dB)
(dB) Ratio
LI DILS LI DILS LI DILS LI DILS
0.25 32.3 36.8 36.8 37.4 29.6 30.4 30.4 32.9 0.5 33.3 35.6 35.6 36.4 30.2 29.4 29.4 31.7 0.75 33.4 34.9 34.9 35.8 31.3 29.8 29.8 33.7
TABLE 2. SSIM INDEX RESULTS OF INTER-VIEW SYNTESIS IMAGES BASED ON CONVENTIONAL LINEAR INTERPOLATION (L1) AND OILS ALGORITHMS
� Ratio
0.25 0.5
0.75
Venus Tsukuba LI
0.61
0.52 0.44
DILS LI DILS LI DILS
0.73 0.88 0.91 0.41 0.45
0.71 0.85 0.89 0.45 0.56
0.72 0.83 0.87 0.57 0.67
PSNR of da!aSel5 blged on OIS (SD ICC)
lo 0.1 0.2 0.3 0.4 05 0.6 0.7
ilua11nler-iwlm9ge
-Cones
-Tsukub3
---Teddr --Venus 0.8 0.9
Cones
LI DILS
0.43 0.72
0.36 0.68 0.35 0.71
Fig. 6. PSNR of Middlebury datasets based on OILS algorithm
SSIM o(Middlebuy dalasels based on OILS (O LRCC) 0.9
0.7
0.6
�
: 0.5
0.3
A.' -Cones
--T$ukybl
0.1 --Teddy
�Venus
00 0.1 0.2 0.3 0.4 0.5 O.S OJ' 0.8 0.9
ilulllnter.iwrm�ge
Fig. 7. SSIM Index of Middlebury datasets based on OILS algorithm
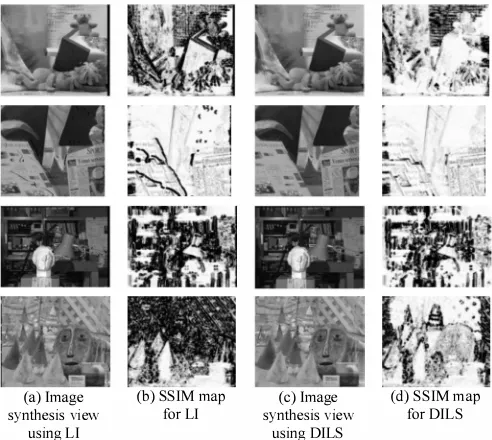
illustrates the SSIM image map for each respective image view synthesis approach. In general, both techniques produce good results on the synthesis images although the results based on LI contain small holes. The quality of the synthesized images provides users with natural ree-view images and videos for 3DTV and ree viewpoint applications. However, when compared with the original images through the SSIM image map, the DILS was found to produce fewer errors than LI as indicated in the Fig. 8(b) and 8( d). The SSIM map of LI contains more dark regions compared with the SSIM map of the OILS method.
(a) Image synthesis view
using LI
(b) SSIM map for LI
(c) Image synthesis view
using OILS
(d) SSIM map for DILS
Fig. 8. Image view synthesis of Middlebury datasets at camera baseline ratio 0.5 obtained through: (a) Conventional Linear Interpolation (L1), (b) SSIM map images based on L1, (c) DILS algorithm, (d) SSIM map images based on
DILS.
VI. CONCLUSION
In this paper a novel Depth Image Layers Separation (OILS) algorithm was presented and used to synthesize virtual inter view images based on disparity map layers representation. DILS features a new paradigm that is not just a method to select interesting locations in the image based on the depth analysis, but also a new image representation that allows description of the objects or parts of the image without the need of segmentation and identiication. The performance of the algorithm was tested on the Middlebury database yielding high PSNR and SSIM index values. The quality of synthesized multi-view images is satisfactory for ree viewpoint applications. The proposed method gives comparable performance to other conventional inter-view interpolation approaches. In the experiments, it was demonstrated that it is possible to eficiently synthesize realistic new views even from not very accurate depth information through the DILS algorithm. However, it can be used with either simple or sophisticated stereo matching techniques to synthesize better quality inter-view images.
ACKNOWLEDGMENT
This work was supported by the Universiti Teknikal Malaysia Melaka (UTeM) under the Short Term Research Grants P J P /20 13/FKEKK( 16C)/SO 1203.
REFERENCES
[I] C Wang, L Zhao, Z -y Qi, J Xi, A Novel Intermediate View Synthesis Method Based on Dispariy Estimation, Proceeding of the first IEEE Intenational Conference on Information Sceince and Engineering, 1079-1082, 2009.
[2] L Zitnick, S Kang, M. Uyttendaele, S Winder, R Szeliski, High quality video view interpolation using a layered representation, ACM Trans. Graph, 23, 600-608, 2004.
[3] D. Scharstein, R Szeliski, A Taxonomy and Evaluation of Dense Two Frame Stereo Correspondence Algorithms, Intenational Iounal of Computer Vision, 47, 7-42, 2002.
[4] . Shade, S. Gortler, L. W. He, R. Szeliski, Layered depth images, in: Proceedings of the 25th annual conference on Computer graphics and interactive techniques, ACM, pp. 231-242, 1998.
[5] . Berent, P.L. Dragotti, M. Brookes, Adaptive Layer Extraction for Image Based Rendering, International Workshop on Multimedia Signal Processing, 2009.
[6] H.Y Shum, J Sun, S. Yamazaki, Y Li, C K. Tang, Pop-up light field An interactive image-based modeling and rendering system, ACM Trans. Graph, 23, 143-162,2004.
[7] J Berent, P.L Dragotti, Plenoptic Manifolds, Signal Processing Magazine, IEEE, 24, 34-44, 2007.
[8] Y. Li, X. Tong, C K. Tang, H.-Y. Shum, Rendering driven depth reconstruction, IEEE Intenational Conference on Acoustics, Speech, and Signal Processing, 784, 780-783, 2003.
[9] K. Takahashi, T. Naemura, Layered light-field rendering with focus measurement, Signal Processing: Image Communication, 21, 519-530, 2006.
[10] M. Bleyer, M. Gelautz, A layered stereo matching algorithm using image segmentation and global visibility constraints, ISPRS Jounal of Photogrammetry & Remote Sensing, 59, 128-150,2005.
[II] M. Sjostrom, P Hardling, LS. Karlsson, R Olsson, Improved Depth Image Based Rendering Algorithms, 3DTV Conference (3DTV-CON), 2011.
[12] . X. Chai, X. Tong, S.-C Chan, H.-Y. Shum, Plenoptic sampling, in: Proceedings of the 27th annual conference on Computer graphics and interactive techniques, ACM Press/Addison-Wesley Publishing Co., pp. 307-318,2000.
[13] G. Bradski, A Kaehler, Leaning OpenCV Computer Vision with the OpenCV Library, 1 st ed. , O'Reilly Media, Inc , 2008.
[14] C Lu, H. Wang, H. Ren, Y Shen, Virtual View Synthesis for Multi view 3D Display, Third Intenational Joint Conference on Computational Science and Optimization (CSO), 2, 444-446, 2010. [15] L. Chaohui, A Ping, Z. Zhaoyang, Efficient Stereo Disparity
Estimation for Intermediate View Synthesis, The 47th Midwest Symposium on Circuits and Systems, 3,483-486,2004.
[16] JD. Oh, S Ma, C-CJ Kuo, Disparity Estimation and Virtual View Synthesis From Stereo Video, Proc. IEEE Symposium Circuits and Systems (ISCAS), 993-996, 2007.
[17] N. A Manap and I Soraghan, "Novel View Synthesis Based on Depth Map Layers Representation," 3DTV Conference: The True Vision - Capture, Transmission and Display of 3D Video (3DTV -Con 2011), May 2011.
[18] AK . lain, L.C Tran, R. Khoshabeh, T.Q. Nguyen, Efficient Stereo-to Multiview Synthesis, International Conference on Acoustics, Speech and Signal Processing (ICASSP), 889-892,2011.
[19] K. Muhlmann, D. Maier, . Hesser, R. Manner, Calculating Dense Disparity Maps from Color Stereo Images, an Eicient Implementation, International Jounal of Computer Vision, 47, 79-88, 2002.
[20] P Fua, Combining Stereo and Monocular Infonnation to Compute Dense Depth Maps that Preserve Depth Discontinuities, Intenational Ioint Conference on Artificial Intelligence, 1292-1298, 1991.