THE UTILISATION OF CONCENTRATION PROFILE SIMULATION TO PREDICT
LITHIUM-ION CELL PERFORMANCE
1
Norzihani Yusof, 2Abd. Samad Hasan Basari and 3Nuzulha Khilwani Ibrahim Centre for Advanced Computing Technology
Faculty of Information and Communication Technology, UTeM Hang Tuah Jaya, 76100 Durian Tunggal, Malacca, Malaysia
{1norzihani, 2abdsamad, 3nuzulha}@utem.edu.my
ABSTRACT
This paper presents the lithium-ion concentration profile simulation in the cathode for the half cell to predict the performance of the lithium-ion cell. The mathematical model is utilized in order to identify the lithium-ion cell system in the solution phase. Then the model is used to describe the discharge behavior of the rechargeable cell based on the simulated concentration profile. For this work, the cathode is the positive electrode employing LiMn2O4 as the active material. In addition, the numerical technique namely Finite Difference Method is used to solve the material balance equation of lithium-ion cell. This method is compared to other methods to identify the concentration profile. Nevertheless, the solutions in this paper merely focus on the concentration profile of lithium-ion in the cathode under galvanostatic discharge in the half cell.
KEYWORDS
Concentration Profile, Lithium-ion cell.
1.INTRODUCTION
Nowadays, a portable power source indubitably provides electrical sources to power electronic devices in many applications. Consequently, the portable power sources generates much interests in medical, military, aerospace, transportation and other recognized applications [1].
To obtain a superior design of batteries with excellent performance, this undeniably would necessitate the knowledge of the value of the significant parameters such as diffusion coefficient of species in electrolyte [2], porosity of the electrodes [3], thickness of separator and electrode materials [4], transference number [5] and initial concentration of electrolyte [6]. Even though the experimentalist is able to optimize these parameters,
however this would involve countless trial-and-errors, time, materials and money. In order to minimize the constraint, an appropriate and precise equation is derived. Then the parameters are tested as well as simulated by the mathematicians. As a result, the theoretical characteristics of the battery can be predicted.
However, if the value of the parameters for the battery materials could not meet the suggested value from the equation during identifying the performance of the battery, the materials can be customized or engineered. This can be materialized by the use of proper auxiliaries or by some other means to achieve the suggested values.
2.GOVERNINGEQUATION
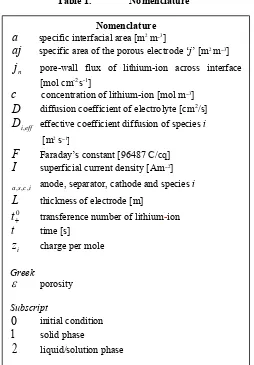
Prior to embark upon the simulations for the concentration profile of lithium-ion in the solution phase, a set of the equations are derived for this work. The related nomenclature of related symbols is shown in Table 1.
The cathode as the positive electrodes consists of the active material LiMn2O4 for the reduction
process [7]. As for the transport of lithium-ion through the cathode blended with active material [8], the species i of the material balance equation are able to be inscribed as
) 1 ( . 0
N aj t
t c
n i i
Table 1. Nomenclature
From the concentration solution theory, the series of flux [9] can be written as
By substituting equation (2) into (1), the equation can be simplified as
) With the substitution of equation (4) in equation (3), the material balance for the porous electrode on the salt becomes boundary and the initial condition can be written as
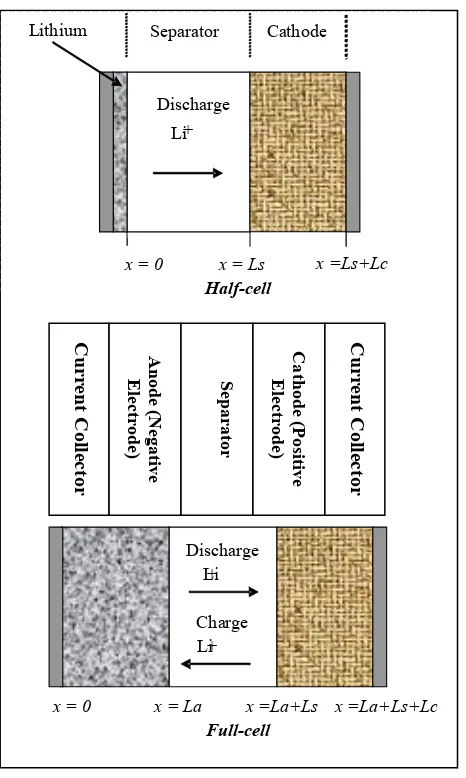
FD considered to simulate the theoretical mathematical calculation of the lithium-ion concentration profile. Though in this paper only show the half-cell system, this work is able to be extended for the full-cell with the anode as negative electrode coated with LiC6,
the cathode as positive electrode intercalated with LiMn2O4 and lastly is the porous and permeable
D diffusion coefficient of electrolyte [cm2/s]
eff i
D, effective coefficient diffusion of species i [m2 s−1
]
F Faraday’s constant [96487 C/cq] I superficial current density [Am−2]
i c s
a,, , anode, separator, cathode and species i
L thickness of electrode [m] 0
t transference number of lithium-ion
Figure 1. Schematic view of the half-cell/full-cell
As from the material balance acquired from equation (5), the rectangular grid is needed for the cathode. Therefore the Finite Difference Method is used in obtaining the grid. The rectangular grid
The vertical and horizontal grid lines are defined by equation for the lithium-ion concentration profile in the cathode, the equations can be organized in the solution/liquid phase as follows
with the boundary conditions
D
and from the initial condition
0 theoretical mathematical equations by implementing Finite Difference Method, MATLAB software is chosen as it provides straight forward access to matrix software such as matrix theory, linear algebra and numerical analysis [13]. In addition, MATLAB is among the best selection as it is able to handle simulator consists of three parts.
Figure 2. First GUI of the MATLAB simulation
There are input for variable parameters and fix parameter, the output of the lithium-ion concentration in the anode, separator and cathode over distance, and finally the projected graph output for the numerical analysis and the simulation. Before the construction of the graphic user interface (GUI) for the simulation, the parameters are standardized and used as shown in Fig. 2. However, the user can change the variable parameter according to the different set of cell models. Accordingly, this is considered as one of the advantages done by the simulator to save materials, money and time as the different set of physical experiments are not required. Within the column data from the analysis projected as from Fig. 3, the values in the table can be exported for other purpose analysis. As from the graph projected at the end of the result as in Fig. 4, it is useful to predict the behavior and better understanding regarding the performance of the lithium-ion cell. Prior to this, the model equation of the material balance as in equation (16) is coded to the software with the parameters identified as in Fig. 2. Subsequently, the grid for the cathode is then iterated by MATLAB to obtain the position of the distance and the concentration of lithium-ion during discharge.
Figure 3. Second GUI of the MATLAB simulation
Figure 4. Third GUI of the MATLAB simulation
Figure 4. Third GUI of the MATLAB simulation
5.SIMULATIONRESULTSANDDISCUSSION
Theoretically, the overall cell-reaction for the lithium-ion cell charge and discharge [15] can be written as
C Li O Mn Li C
Li O Mn
Lix 2 4 y 6 x 2 4 y- 6 (20)
at [21] the positive electrode (cathode) and
O Mn Li Li
O Mn
Liy-x 2 4 x xe y 2 4 (21)
at [21] the negative electrode (anode)
Li O Mn Li C
Lix 6 0 2 4 x xe (22)
Based on the theoretical prediction for the chemical reaction, the discharge process occurs from the left cell-reaction to the right. Then the ion in the cathode will decrease because the lithium-ion will combine with electrons that have entered the cathode from the external circuit. Therefore from Fig. 4, the graph simulated from the MATLAB describes the lithium-ion concentration profile when discharged is acceptable.
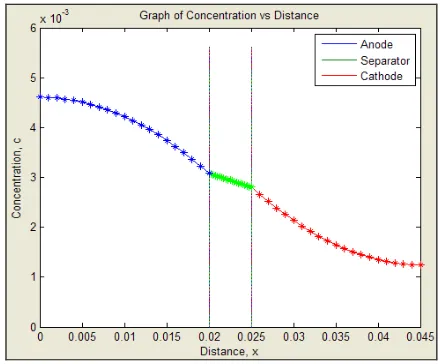
According to Hashim Ali [16] and Johan [8], the concentration profile across the separator and cathode during galvanostatic discharge are decreasing when the distance of x is increasing. Fig. 5 shows that the lithium-ion concentration profile when discharged is decreased as the distance progressed. Therefore, the simulation results are
satisfying with the author’s lithium-ion
concentration profile. This is reasonable because during the full charge [8], it is expected that the lithium-ion concentration in the cathode would be almost zero and during discharge the lithium-ions filled up the back portion of the cathode. Since this work is capable to be extended in full-cell as seen in Fig. 5, it is obvious that the simulated concentration of lithium-ion is higher in the separator than in cathode and highest in the anode. This result is similar to the one obtained by Arora [17].
Figure 5. Full-cell simulation of the concentration profile
As compared with another simulated results from numerical software namely MODAL [18], the results of the MATLAB simulations from the cathode (Fig. 4) as well as full-cell (Fig. 5) are satisfactory with the projected output from the MODAL. When comparing both results, the graphs show the progressive decreases of lithium-ion across the electrolyte.
It is known that the prediction in the cathode can be done by the numerical, analytical and experimental techniques or methods [19] [20]. As for the experimental techniques [22], LiMn2O4 is
In addition, the numerical method is a good medium and efficient for learning to use computers as it is a proficient way to study programming by coding the computer programs [24]. It is considered as a medium to strengthen the understanding of mathematics by reducing higher mathematics to basic arithmetic operations [24].
6. CONCLUSION
From the results and the comparisons, it is discovered that modern simulation and mathematic modeling technique is capable of predicting the behavior and the performance of the lithium-ion cell. In consequence, this could be used to design the batteries. This research has shown that the half-cell model system is used to simulate the theoretical mathematical calculation of the lithium-ion concentration profile. Therefore, the variable parameter can be changed by the user according to the different set of cell models. With the appropriate and precise equation derived, the parameters are tested as well as simulated by the mathematicians. Then, the theoretical characteristics of the battery can be predicted. Accordingly, this is considered as one of the advantages done by the simulator to save materials, money and time as the different set of physical experiments are not required. Even though this simulation is focus on cathode, the simulation is capable to be extended in full-cell.
Since this work is using the numerical method for the theoretical mathematical equations by implementing the Finite Difference Method, MATLAB software is chosen as it provides straightforward access to matrix software such as matrix theory, linear algebra and numerical analysis. As to test the simulation reliability, the graph simulated from the MATLAB is compared to the graph obtained using other method. As the conclusion, the simulation of this work is consistent to be used for predicting the behavior of the cell as well as to design a good battery system.
7.ACKNOWLEDGMENT
We would like to thank Universiti Teknikal Malaysia Melaka (UTeM) and Faculty of Information and Communication Technology (FICT) for the endless support to render this
research successfully. This research is supported by a fundamental research grant scheme (FRGS) from the Ministry of Higher Education Malaysia.
8.REFERENCES
[1] Pham, T. K., Dunn-Rankin, D. and Sirignano, W. A.: Flame structure in smal-scale liquid film combustors. In: Proceedings of the Combustion Institute, 31, II, pp. 3269-3275, (2007).
[2] Maier, J.: Fundamentals, Applications, and Perspectives of Solid-State Electrochemistry: A Synopsis. WILEY-VCH Verlag GmbH & Co. KGaA, Weinheim, 978-3-527-32318-0. pp 1-13, (2009).
[3] Chen, C.Y. and Tsao, C. S.: Characterization of electrode structures and the related performance of direct methanol fuel cells. In: International Journal of Hydrogen Energy, 31 (3), 391-398,( 2006).
[4] Djian, D., Alloin, F., Martinet, S., Lignier, H. and Sanchez, J. Y.: Lithium-ion batteries with high charge rate capacity: Influence of the porous separator. In: Journal of Power Sources, 172 (1), pp. 416-421, (2007).
[5] Li, L. F., Lee, H. S., Li, H. Yang, X. Q., Nam, K. W., Yoon, W. S., Mcbreen, J. and Huang, X. J.: New electrolytes for lithium ion batteries using LiF salt and boron based anion receptors. In: Journal of Power Sources, 184 (2), pp. 517-521, (2008).
[6] Mohan, N. Balasubramanian, N. and Basha, C. A.: Electrochemical oxidation of textile wastewater and its reuse. In: Journal of Hazardous Materials, 147 (1-2), pp. 644-651, (2007).
[7] Dell, R. M. and Rand, D. A. J.: Understanding Batteries. United Kingdom: The Royal Society of Chemistry, Cambridge. pp 1, 94-98, 147-162,( 2001).
[8] Johan, M. R. and Arof, A. K.: Modeling of electrochemical intercalation of lithium into a LiMn2O4
electrode using Green function. In: Journal of Power Sources, 170, pp. 490–494, (2007).
[9] Newman, J. : Electrochemical Systems. Englewood Cliffs, New Jersey, (1971).
[10] Bruggeman, D. A. G.: Ann. Phys., 24, 636, (1935).
[11] Doyle, M. and Newman, J.: Analysis of capacity-rate data for lithium batteries using simplified models of the discharge process. In: Appl. Electrochem., 27, 846, (1997).
[12] Wakihara, M.: Recent Developments in Lithium-ion Batteries. In: Material Science and Engineering R33, pp. 109-134, (2001).
[13] Burden, R. L. and Faires, J. D.: Numerical Analysis, 8th Edition. United States: Thompson Higher Education, Belmont. pp. 44, (2005).
[14] Moshe, Y. GUI with MATLAB. Signal and Image Processing Laboratory, Electrical Engineering Department, pp. 1-17, (2004).
[15] Eriksson, T.: LiMn2O4 as a Li-Ion Battery Cathode. From Bulk to Electrolyte Interface. Acta Universitatis Upsaliensis. Comprehensive Summaries of Uppsala Dissertations from the Faculty of Science and Technology 651, 53 pp. 1-58, Uppsala. ISBN 91-554-5100-4,(2001).
[16] Hashim Ali, S. A. and Mohamed, N. S.: Modeling of transport through a LiMn2O4 film electrode. In: Proceedings of the 2nd IMT-GT Regional Conference on Mathematics, Statistic and Aplications, USM, pp. 1-5, (2006).
and Experimental Data for High-Rate Discharges of Plastic Lithium-ion Batteries. A technical paper accepted for publication in Journal of Power Sources, pp. 1-50, (1999).
[18] Ternay, F., Djian, D. and Martinet, S.: Simulating Lithium-Ion Batteries Operation with MODAL Recent Development and Some Test Cases. In: 6th. Int. con$ on
Thermal, Mechanical and ,&‘fKltiphysicSsim ulation and Experiments in Micro-Ekctmnics and Micm-Systemr,E uroSimE, 0-7803-9062-8/05, pp. 318-324,( 2005).
[19] Luan, J. and Tee, T. Y.: Analysis of PCB Subassembly Dynamic Responses using Integrated Analytical, Numerical and Experimental Techniques. In: 6th International Conference on Electronic Packaging Technology, 0-7803-9449-6/05, pp. 1-8, (2005).
[20] Dehmollaian, M. and Sarabandi, K. : Analytical, numerical, and experimental methods for
through-the-wall radar imaging. In: ICASSP IEEE, 1-4244-1484-9/08, pp. 5181-5184, (2008).
[21] Rong, P. and Pedram, M.: An Analytical Model for Predicting the Remaining Battery Capacity of Lithium-Ion Batteries. TVLSI-00029-2003.R1, pp. 1-12, (2003).
[22] Pitoia, G., Antonini, A., Rosati, R. and Zane, D.: Storage characteristics of chatodes for Li-ion batteries. Electrochimica Acta, l4, 17 pp. 2683-2689, (1996).
[23] Kawano, S. and Nishimura, F.: Numerical analysis on
charge characteristics in Lithium ion batteries by multiphase fluids model. In: JSME International Journal, 48, 3, pp. 548-554, (2005).