PROJECT COMPLETION REPORT FOR
SHORT TERM RESEARCH GRANT
Principal Researcher: NURHIDAYAH BINTI ISMAIL Co-Researcher : 1. DR. REDUAN BIN MAT DAN
2. DR. RUZTAMREEN BIN JENAL 3. NURUL HILWA BINTI MOHD ZINI
Project Code No: PJP / 2012 / FKM (2C) / S01053 Report Submission Date: September 3rd, 2014
Department of Plant & Maintenance FACULTY OF MECHANICAL ENGINEERING UNIVERSITY TEKNIKAL MALAYSIA MELAKA
i
ACKNOWLEDGEMENT
First of all, the authors would like to take this opportunity to express gratitude to the Universiti Teknikal Malaysia Melaka (UTeM) for the financial support (Short Term Research Grant Project). Many thanks as well to the Faculty of Mechanical Engineering, Universiti Teknikal Malaysia Melaka (UTeM) for the opportunities given and facilities offered.
The authors also would like to express the sincere gratitude to the students, Mohammad Azim Bin Baharuddin and Muhammad Fauzan Bin Pazemin for their dedicated and prodigious support in conducting the experiment for this work.
ii
ABSTRACT
iii
TABLE OF CONTENTS
Acknowledgement ... i
Abstract ... ii
Table of Contents ... iii
List of Tables ... v
List of Figures ... vi
Chapter 1 ... 1
Introduction ... 1
1.1 Background ... 1
1.2 Problem Statements ... 2
1.3 Objectives ... 3
1.4 Scope of Study ... 4
Chapter 2 ... 5
Literature review ... 5
2.1 Introduction ... 5
2.2 Defect Mechanism and Propagation ... 6
2.3 Vibration Analysis... 9
Chapter 3 ... 13
Methodology ... 13
3.1 Introduction ... 13
3.2 Gear Test Rig Development ... 13
iv
3.4 Vibration Data Measurement ... 16
3.5 Wear Debris Analysis... 17
Chapter 4 ... 20
Result and discussion ... 20
4.1 Vibration Analysis Result ... 20
4.2 Wear Debris Analysis... 23
Chapter 5 ... 31
Conclusion and recommendation ... 31
5.1 Conclusions ... 31
5.2 Recommendation ... 32
References ... 34
v
LIST OF TABLES
Table 1: Type of adhesion... 7
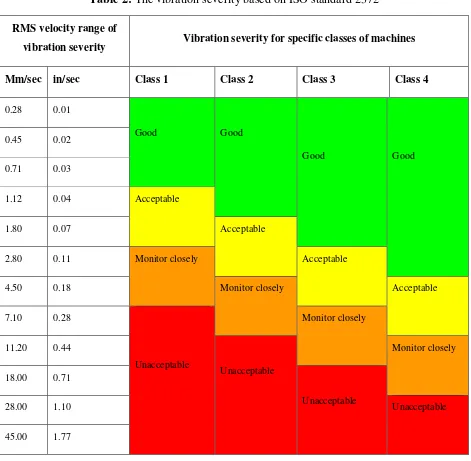
Table 2: The vibration severity based on ISO standard 2372 ... 12
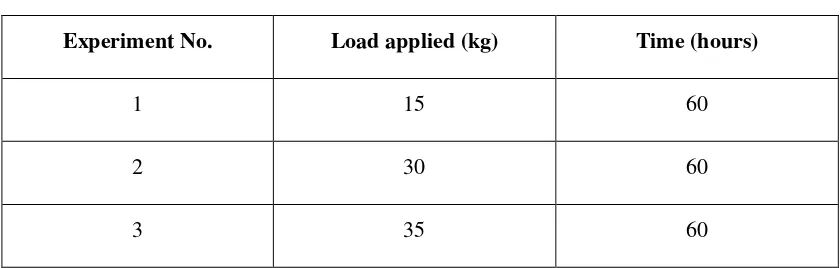
Table 3: Experimental configuration ... 16
Table 4: Result of GMF value ... 21
vi
LIST OF FIGURES
Figure 1: The frequency spectrum in the beginning of the experiment ... 10
Figure 2: The frequency spectrum after two weeks operation ... 11
Figure 3: The schematic design of test rig ... 14
Figure 4: Gear rotating test rig ... 14
Figure 5: Accelerometer ... 15
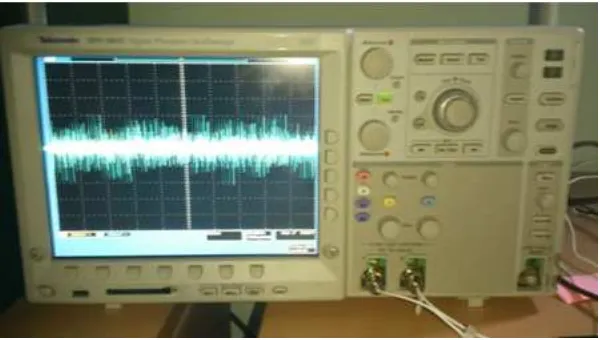
Figure 6: Oscilloscope ... 17
Figure 7: Comparison of the GMF values ... 22
Figure 8: Particle size of Experiment 2... 23
Figure 9: Image of particle under microscope at 16th hours 27th hours ... 24
Figure 10: Particle size of Experiment 1... 25
Figure 11: Image of particle under microscope at 52nd hours ... 25
Figure 12: Image of particle under microscope at 57th hours ... 26
Figure 13: Contaminant at 60th hours ... 28
Figure 14: Contaminant at 55th hours ... 29
Figure 15: Contaminant at 35th hours ... 29
CHAPTER 1
INTRODUCTION
1.1 Background
Many industrial companies have been bothered with machineries failures that are caused by defects that occurred on the gears drive which, used as a propeller for certain machine compartments. Gear drives components that usually experiencing distress are gears, bearings, shafts and seals.
2 transmitted at specific required speed. While, the area of contact during gears meshing will dictate the load capacity of the gears.
The defects of the gear will happen eventually after a long operational time. However, the lifespan of the gears can be prolonging by eliminating the sources of defects such as imbalanced of the rotating parts, misalignment of the shaft and others. The examples of gear defect which usually can be seen on the gears tooth are pitting, scuffing, spalling, scoring and etcetera. These defects are basically are a result of repeated surface or rub-surface stresses during gear meshing that goes beyond the endurance limit of the materials that caused surface fatigue. These defects will cause the vibration level in the system to rises and exceeding the normal vibration level. The defect on certain gears can be detected using several methods such as visual and sound inspection, however, the analysis on the lubricant used and vibration analysis is proven to give out better result.
Vibration is one of mechanical phenomenon whereby it oscillating about its’ equilibrium point. The vibration level in every machines are impossible to be eliminated because there will always be a vibration due to gears meshing, however, the level of unwanted vibration should be monitored and minimized. Therefore, vibration analysis is compulsory to be monitor from time to time periodically. However, vibration based systems require extensive interpretation by trained diagnosticians to create algorithms that indicate impeding failures (Dempsey,2000). These excessive vibration may contributed to undesired sound and motion, energy wasting, reducing performance of the system, shorten the life span or even causing catastrophic failure to the machineries or system.
1.2 Problem Statements
3 major damages in future, for example machines breakdown then contributed to delay on the production line of the companies.
Besides extending the lifespan of the machinery, the reduction cost of the maintenance activity also possible. The expenditure is cut down by only replacing the parts that identified experiencing failure such as gear that defected and avoiding any major failure. Moreover, the production line will be smooth, if the maintenance processes are scheduled accordingly to the defects indicator.
Therefore, this study is carried out in order to help us to recognize and monitor the defect of the rotating components such as gears. Moreover based from the previous study it found that, failures associated with gears represent the cause of extended outages and are typically caused by gradual deterioration and wear (Elforjani et al. 2012).
1.3 Objectives
The main interest of this research is to monitor the defect in rotating gears using vibration health monitoring system. The main objectives are as follows:
a) To develop gear test rig for on-line vibration health monitoring system.
b) To determine the vibration severity of the rotating gears that run under certain conditions.
4 1.4 Scope of Study
From the objectives, the scope of study is design and narrowed down to become more specific in order to make sure the clear view of the research is given.
a) The first step is to design and fabricate the gear test rig based on the current industrial condition. The component of the gear test rig consists of bearings, shafts and driven by DC electric motor. An accelerometer is used as a sensor component to monitor the health condition of the gear. The sensor is attached to the driven gear bearing housing in order to capture the vibration signal.
b) A number of experimental tests are conducted where several parameters are taken into consideration such as speed, load and time. Simple Design of Experiment (DOE) is constructed in order to help the experiment run smoothly.
c) Data measurement of vibration signals are collected analyzed using vibration analysis technique.
CHAPTER 2
LITERATURE REVIEW
2.1 Introduction
In this chapter, the literature reviews of project are discussed. The content of this chapter discuss about the previous study which obtained from the published journal collected. From the previous study, the expectation data collection and result are developed. The result from the previous study, is then use to be compared with the data collected during the experimental period.
Furthermore, the theories established from knowledge and ideas of researchers and accredited intellectual will be discussed. The theories related to the title of vibration analysis on the rotating gears in order to identify the defects are going to be used as the reference to compare and validate the result obtained in the research.
6 2.2 Defect Mechanism and Propagation
Defect is defined as imperfection or slight change in the original geometries or physical of something. However, defects on the gear are said to the deformation that occurred eventually. Gears defect occurred due several factors such as vibration, poor maintenance procedure which initiate from machineries poor installation or manufacturer. Gear defects or wear are categories into two mechanisms which is considered as causes of wear. The wears are occurred due to:
a. Mechanically mechanism
b. Chemically-mechanical mechanism
Mechanically dominated wear mechanism is a mechanism of wear that only caused by the mechanical only. There are two examples of wear mechanisms that are contributed mechanically to the wear propagation of the structures such that surface fatigue and abrasion.
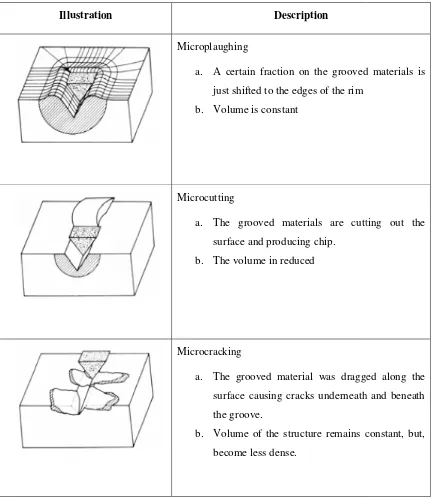
The surface fatigue occur due to crack initiate and propagate, that usually take place at the surface or in certain depth below the surface depend on the contact situation and microstructure of the materials illustrated in Figure 1. This problem can be overcome by controlling the temperature of the system, since, it affecting the lubricants viscosity, besides, increasing the endurance limit of the materials.
Illustration
just shifted to the edges of the rim
b. Volume is constant
surface causing cracks underneath
There are also some wea These wear mechanisms, affected adhesion and tribochemical react
Adhesion is wear mechan happened due to both body a destruction of any intermediate cold region underneath the conta counter body or vice versa. The the result of adhesion. This mech stop or reduce by lubricating the s
Lastly, the tribochemical that contributed by both chemica body experienced chemical reac will stop the adhesion. However, reaction which can be seen in Fig physical, chemical and mechanic that wear is brought about by spa of the layer due to the oxidation o
ear mechanisms that caused by both chemical ted by the change in the materials due forces end ction.
anism that explained by the micro joints or fricti and counter body are plastically deformed w
e layer. The boundaries of this joint takes place ntact area. The materials from the body may be t e sliding wear of overheated or unlubricated sur chanism is explained in Figure 2. The mechanism e surface.
al reaction between the contact surfaces is the w ically and mechanically. The materials in both b action due to interfacial medium and environme er, there are films or layers formed on the surface Figure 5. Quinn (1983), has stated that the wear ra nical properties of the reaction products. Moreov spalling off an oxide layer, which has reached its
n of materials.
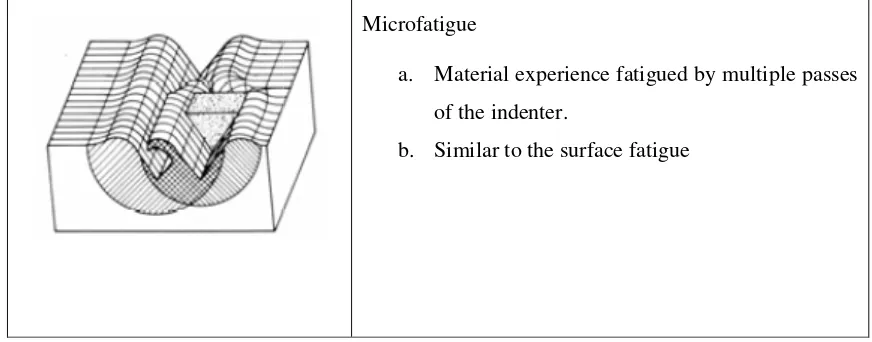
Microfatigue
a. Material experience fatigued by mu
of the indenter.
b. Similar to the surface fatigue
9 2.3 Vibration Analysis
The vibration is an oscillating motion that exists in every structure about their static equilibrium position, the motion is continuous, repetitive and often periodically. In certain area, the vibration can be beneficial such as vibration for energy harvesting field. However, the vibration may cause many undesirable effects, for examples fatigue, breakage, and wear to the structure, improper operation of equipment, noise pollution, and etcetera. The vibration can be categorized into few groups which are:
a. Free vibration – vibration occur with no external force and oscillating at natural frequency
b. Force vibration – there is forces applied to the system
c. Damped / undamped vibration – system with/without damper.
In the rotating machineries, vibration is considered as one of the predominant factors for failures that occurred. Vibration in the rotating rotor cannot be eliminated because the vibration will eventually occurred, at least once-per-revolution frequency component. This is because it is impossible to make any rotor perfectly mass balanced. All machinery has their specific allowable vibration level which is crucial to machine durability, reliability, and life is rarely disputed. In case of this research which implies gears, the vibration from the gear meshing is also in consideration. Thus, vibration analysis on the rotating machineries is necessary and convenient to monitor the machineries performance.
10 Fast Fourier Transform, FFT Spectrum is an algorithm to compute the Discrete Fourier Transform (DFT) and its inverse by converting time domain signal to frequency spectrum and vice versa for machineries vibration monitoring. This technique is chosen over other techniques since, this experiments carried out are basically a machineries simulation.
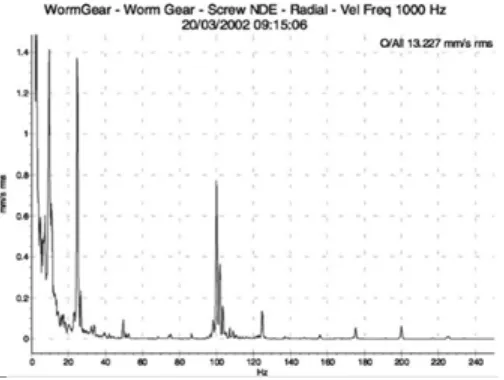
Figure 2 shows the frequency spectrum at the beginning of the gear rotating which obtained during the experiment (Peng & Kessissoglou 2003). The gear type used in the experiment is worm gear. According to Peng and Kessissoglou, the amplitude of the shaft running speed recorded at approximately to 1.4 mm/s, which is quite high for the beginning run. This is might be because of the imperfection of the original manufactured surfaces of theworm gears and the use of the Vitrea oil which cannot provide appropriate boundary lubrication between the surfaces of the gears. Even though is high, the value is still in the acceptable condition according to the ISO standard as shown in Table 2.
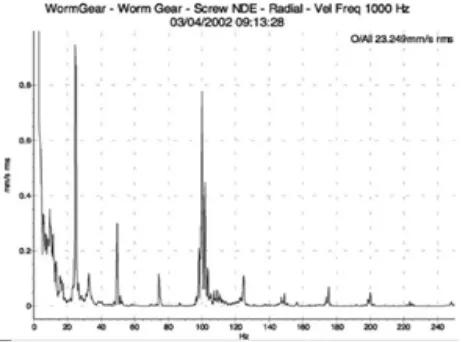
11 Figure 2: The frequency spectrum after two weeks operation
The experiment where continue until two weeks. After two weeks, the amplitude of the running frequency reduced gradually approximately to 0.1 mm/s referring to Figure 2. This decreasing in the vibration signal can be attributed to a reduction in wear due to the smoothing of the scratched surface using the more viscous Trivela lubricating oil (Peng & Kessissoglou 2003).
12 Table 2: The vibration severity based on ISO standard 2372
RMS velocity range of
vibration severity Vibration severity for specific classes of machines
Mm/sec in/sec Class 1 Class 2 Class 3 Class 4
2.80 0.11 Monitor closely Acceptable
4.50 0.18 Monitor closely Acceptable
CHAPTER 3
METHODOLOGY
3.1 Introduction
These chapters are discussed about the technique and procedures that taken in order to make sure that the objectives are successfully meet. The content of this chapter are focusing on the process development of the test rig, equipments involved, experimental setup and also the design of experimental configurations. Besides, the techniques of analysis used in this study are also explained.
3.2 Gear Test Rig Development
Figur
Since the aim of transducer which is acce actually a device that con signal in response to a accelerometer used the ge
ure 3: The schematic design of test rig
Figure 4: Gear rotating test rig
of the study is to implement on-line health mo ccelerometer type is used to help the monitorin
onverts one form of energy into another and provi a quantity, property, or condition that is being general sensing method upon which all accelero
15 where acceleration acts upon a seismic mass that is restrained by a spring and converts a physical force into an electrical signal, which measured in pico Coulomb per g (pC/g), where g is stands for unit of gravity force. In this study, during experiment the accelerometer are attached near the bearing housing of the driven gear tank using heat resistance wax. Figure 5 shows the location of the accelerometer which is attached to the bearing housing.
Figure 5: Accelerometer
3.3 Experimental Design Configurations
16 Table 3: Experimental configuration
Experiment No. Load applied (kg) Time (hours)
1 15 60
2 30 60
3 35 60
3.4 Vibration Data Measurement
The data measurement is the process carried out after the equipment was setup. The data is collected based of the vibration signal obtained from the accelerometer) which is placed on the bearing housing of the driven gear. The signal from the transducer is convert into an electrical signal, which is then, be amplified and display on the oscilloscope in form of time waveforms. For accurate vibration signal result, the accelerometer should be attached to the gears since the aim of this study is to investigate the rotating gears but since the accelerometer used is wired so the attachment should be locate at bearing housing.
Oscilloscopes are used to display the change of an electrical signal over time, such that voltage and time describe a shape which is continuously graphed against a calibrated scale. This shape is commonly referred to as a waveform, and makes it easy to view voltage changes over time, allows measurement of peak-to-peak voltage, the frequency of periodic signals, the time between pulses, the time taken for a signal to rise to full amplitude (rise time), and relative timing of several related signals.
17 data was taken every an hour gap. Besides that, the images of the specimen gears are captured every three hours to observe the physical conditions of the rotating gear.
Figure 6: Oscilloscope
3.5 Wear Debris Analysis
Wear debris analysis is also known as one of the condition monitoring technique of tribosystems. There are reasons for measuring the quantity of wear debris by using lubricants oil because wear debris analysis is usually to determine the wear rates of various components of a machine. Analysis of debris or particle consists of metallic and non-metallic. The metallic particle is a wear condition that separates in different size and shapes of metallic dust from components like bearings and gears or coupling. Metallic wear debris also can be differentiated or classified by type particle morphology into several classes, for example; rubbing, cutting, spherical, laminar, fatigue chunk and severe sliding wear particles (Sondhiya & Gupta, 2012).