Direct
NOAAImagery Extraction System
for Data Acquisition of Rice Growth
Modeling
R.V. Hari Gin~rdil.~, I. H a n d ~ k o ~ , ~ & Kudang
8,
Seminap
'MI1 Study Program. Bogor Agrlculturol University. SEAMEO BIOTROP Campus. Jolan Rayo Tajur krn 4. PO BOK 1 16. Bogor. Indonesia
?lnstitut Teknologi Sepuluh November. Surabaya. Indonedo Faculty of Mathematics and Natural Sciences. Bogor Agricultural Unlvenlty.
Jalan Rayo Pajojaran, Bogor, Indonesia.
'Foculty of Agrtculturol Technology, Bogor Agrlculturol University. Danaga Campus. Bogm. Indonesia.
Abstract
This research presents a new method for processing remote sensing data. A customized tool was developed to handle data acquisition for a rice growth model using daily NDVl data from NOAA AVHRR satelllfe. Thts tool outornates several baslc remote sensing steps to produce NDVI dataset for a specfic study area lncludlng image retrieval, image rectification, NDVl calculation, re-sam- pling. and dota masking.
The architecture of thls system considers the above application be used as an independent tod which can be executed directly from computer console. or called by other applications as o sub module. To meet thls requirement. the output of the system is declared to be compatible with input data format spec[- fication of the current rice growth model. We used the Shierory-rice model (Handoko, 1994) as the main system.
Our focus in developing this application was the automotlon process of N O M AVHRR imoge rectification without uslng any vector / map as a reference for coordlnote reglstratlon. Coordinate registration was extracted from the NOAA imagery itself. Thls methodology enables the use of NOAA Imagery for every area in the earth surface. even there is no digital map available for the area.
Evaluation and validation were performed to ensure that this system woks prop erly according to the design. We compared our system with current rnethodol- ogy using available remote sensing tool.
Key Words : NOAA. NDVI, crop mcdel, Shierary, rice, Java, remote Senslh~
1, Introduction
1.1. Managing Natural Resources using Information Technology
Natural resources management is an inherently and increasingly complex task.
To
provide formal yet practical decision support it requires a new approach to support a moreopen
and participatory decision making process. A new paradigm ofman-machine
systems is needed where the emphasls is no longeron
finding an optimal solution to a well defined problem, but rather to support the various phases of the probtem defini- tion and solving process.Management of natural resources requires integration of
often
very large volumes of disperse lnformation from numerous sources: the coupling of this information with efficient tools for assessment and evaluation that allow bmd interactive participation In the planning, assessment, deci-sion
making process and effective methods of communicating results and findings to a broad audience. lnformatlon technology, and in particular, the integration of database management systems,GIS,
remote sensingand
Image prmessing, simulationand
multi-criteria optimization mod-els, expert
systems,
and computer graphics provide some of the tools for effective decision support in natural resources management.Integration of complex and powerful software tools in problem oriented systems provides direct and easy
access
to large volumes of data. It supp o r t s interactive analysis and helps displaying and interpreting results in a format which is directly understandable and useful for decision maklng processes. Integrated information systems can support o more Interac- t i e . exploratory. and parti-cipatory, and thus useful and effective ap- proach to natural resources planning and management.
From a technical point of view, many basic tools ore available and the underlying concepts have been well developed. And new technologies such as wide area networks
and
their promise of easy access to poten- tially large volumes of information are rapidly becoming available.2
Journal of GIS. Remote Sensing & Dynamic Modelling No. 2, 2002 : 1-23To summarize,the need for better tools to handle even more critical envi- ronmental and resource management problems is obvious. The Integra- tion of models with geographic information systems. expert systems, in- teractive graphics, generating a virtual reality version of the decision prob- lem, is a promising and challenging development in environmental sys- tems analysis, strategic decision support, and applied informatics. The
biggest challenge, however,
seems
to be the integration of new inforrna- tion technologies and more or less matureformal
methods of analysis into institutional structures and societal processes, that is, putting these tools to work in practice.1.2. Crop Growth Modeling
I
Deterministic crop growth model as a basis for crop growth monitoring and yield forecasting is already operational. The coverage area of cur- rent model has been developed from a sample size area to regional /
national applications which is very useful for regional agricultural plan- ning.
Major components of crop growth modeling are crop variables, particu- larly leof
area
index (MI), soil variables (soil water content, nitrogencon-
tent), meteorological variables (solar radiation, temperature, relative hu- midity. rainfall and wind speed), and methods of cultivation. For a dy- namic modeling with a daily time resolution. the soil variables can
be
determined from ground truth measurements; cultivation characteristics
(i.e, sowing time, cultivars) can be derived from land use survey; and meteorological variables can be measured from a recorded doily data using ground weather station. Crop variables are simulated daily as
out-
puts of the models.
NOAA-AVHRR dotaset provides useful information for the
extension
over wide land surfaces. It has many important points to beused
as inputs for crop growth modeling: remotely sensed crop variables and climaticIn-
formation. This covers a wide area of data acquisition, availability of #
doily data acquisition, high resolution sensor, and reasonable cost.
Dlrect NOAA lrnogery Extraction System for Doto Acquisition of Rice Growth
3
NOAA-AVHRR dataset, as the daily input for crop growth models, should be supported by a series of processes to extract the important informa- tion from remotely sensed data in a specific imagery format to become
1
readable data hpwt for the model. These include import process to im-age processing software, image rectification using available GIs data, NDVl calculcrtion. data filtering using GIs land-use data, and exporting the result to the format specified by the crop model. Most of those pro- cesses take a large amount of time and they require specific tools and skilled opera tors.
t .3. Molivation and Objectives
Current research on applying remote sensing data for crop growth mod-
eling emphasizes measuring NDVl value to calculate leaf area index. This value can overlde
the
need of daily climate to calculate the biomass. The processes of measuring NDVl and calculating LA1 in remote sensing ,are based on raster data model using the image processing method. This paper introduces an automation process of NOAA-AVHRR imagery ex- traction. Theoutput
Is
restricted to obtain NDVl values of rice field in Java Island as an input for rice growth modeling from daily NOAA AVHRR data. The optimlzation of the whole system, affected by this automation process will be evaluated.We consider an automation process module a s appropriate for this ob-
jectlve. This module was developed using C++ language as an inde- pendent application running on Windows operating system. The main
input for the application is NOAA AVHRR dataset. The additional input is
a rfce fleM fitter dataset file. Spatial and temporal data of NOW AVHRR dataset can be examined from the dataset content.
The
optirnlzation ofu data structure,
memory
management and file handling was also consid- ered to make the program run faster and efficient.1.4. Reseurch Boundary Scheme
ThiE'research is a part of managing natural resources using information technology. An overall system for rice growth modeling was constructed from four important sub-systems : geographic information system, remote
q
Journal of GIs, Rer note Sensing & Dynamic Modelling No. 2, 2G02 : 1 -23 [image:3.817.465.732.51.376.2]g l p y b l k * H I . -
I!
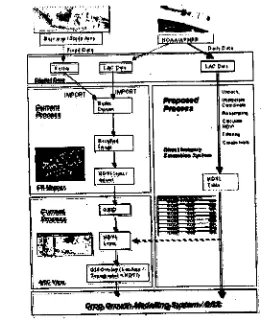
Figure 1. Blodr Diagram of Proposed System
sensing, dynamic modeling. and decision suppoit system. The automa- tion process using Visual
C++
programming was designed to improve data acquisition method of dynamic rice growth model. Figure 1 shows the system block diagram.1 -5. Research Output
I
Field1
Natural ,
Resources
Manaaement '
Prototype of direct NOAA imagery extraction system has been developed and implemented
us in^
C++ programming language. The program was tested with a series of NOAA dataset starting from 1 May 2MX) to 30 June2000.
The dataset was used to verify the capability of handling current daily NOAA data to support the current research of SARl (Satellite Assess- mentof
Rice in Indonesia) project.Vector map was used to visually verify the rectification process. ArcView GIs was employed to display and compare the raster NDVl dataset to ensure the image processing I remote sensing module runs properly. This vector map was also used to visually verify the spatial mask / filtering of rice field
process.
The flnal result of thisautomatlon process is a list of NDVl data of selected
cells
or rice
field area. This data is saved in a standard ASCII tabular format for futureuse
in modellng application.3 CUS- Our major confdbutton Is
an
Integrated data handllng module fhot Ptomired
and optimized for supporting daily NDVI data acquisition for rice growth modeling. Thls module Involves image processingand
6 8 analy- sls without the need of specific expensive s~ttwaie and skilled operutor. All controls to the module are fed using command line parameters.2.
Background
Natural resources management
has
become
a multidiscipline coopera- tion and research. Basically, GIs, remote sensing. modeling,and
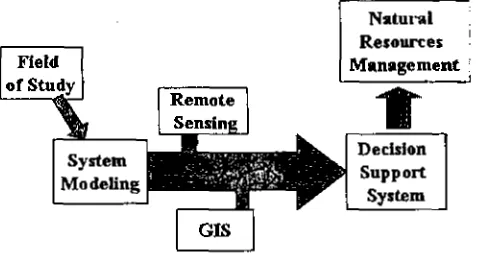
decision support system con be integrated as shown in Figure 2.Many researches on infotrnation technology for natural resources
man-
[image:4.822.530.769.50.177.2]agement use a forementioned basic integration scheme. Sophisticated tools for remote sensing and GtS are currently available. Decision support
Figure 2. Managing Naturaf Resources
system module and modeling module are specific tools that are designed to be used in certain type of natural resources management. Currently. there are many researches in developing dynamic model for natural re- sources management. One of the dynamic models for agricutture is crop growth model.
2.1. Crop Growth Model
In the early development of deterministic and mechanistic crop growth modeling. system behavior was defined to simulate the
actual
crop
growth of a certain species in a limited area of data observation. The area of data observation was restricted to reduce the cost and time to acquire real data. Scaling up process was used to predict the result of model over wider area from a limited space of observation data.
Timely and accurate crop yield forecasts on a regional scale are becom- ing increasingly important to policy makers, commodity trade and food industry to support their decisions. Recently, other methods for yield fore-
casting are being explored based on new techniques such as simulation, geographic information system (GIs) and remote sensing technology. Satellite remote sensing provides opportunity to measure actual crop
growth and development.
Direct NOAA lmogery Extrochon System for D a t a Acquisition of Rice Growth
7
Modeling {P. V . H. Ginordi. I. Handoko & K. 8. Seminar)
Tamme van der Wal (1996) used remote sensing dato from satellite to calibrate a crop simulafion model WOFOST in Sevilla, Spain. The other satellite imagery combination for crop yield assesment had been applied in Poland (Dabrowska. 1996). where 30 NOAA-AVHRR images combined with SAR data
and
LandsatTM image were used to determine NDVl and soil moisture, and to calculate Ml from those two indices.NOAA-AVHRR data have already been demonstrated useful for eco-cli- matic classlfication. because of the abundant environmental informa- tion contained in NDVl and thermal infrared images (Derrien ef a/.. 1992,
Benedetti et al., 1994). The performance of NOAA-AVHRR was evafuated in Tuscany, Italy for climatic data ,extraction, and showed that it could
provide useful information for the extension of fundamental climatic pa- rameters over wide land surfaces. (Claudio Conese et
a/.,
1996).Other trial to determine evapotranspiration using surface temperature from NOAA Scrtellite over Hungary was reported from 1992 to 1994 (Dunkel
et
al.,
1996). Other work using NOAA imagery for enhancing rice growthW e l n g
and
yield forecasting is currently conducted in China (1 W & m ) and also in Indonesia (SARI project, since 1998). The capability of NOAA- AVHRR data to estimate M I for agrometeorological models was evalu- ated In Flnland (1995) by comparing M I from field measurement and M I estimated from NOAA-AVHRR satellite imagery (Kuittinen et a/.. 1995).2.5. NOAA AVHRR Dataset Exhction
Dynamic crop growth modeling using NOAA AVHRR datasets as input to determine IAt is currently developed in Indonesia. The dynamic crop growth modeling contains several main sub-models and their specific tools: input data handling. remote sensing. geographic information sys- tem. crop growth model, and decision support system.
Remote Sensing tools provide various image processing capability such
as image display (view). enhancement, rectjfication, manipulation, clas- sificatlon and format conversion. Only very fimited features are
used
for support in^ this modeling purpose. GIS tools also provide various spatial analysis features for dlgital map processing. but very limited feotures that1
8 Journol of GIs, Remote Sensing & Dynamic Modelling No. 2, 2W2 : 1-23
can be used to support this modeling purpose. Reducing the use of sophisticated and expensive software was considered as one of the ad- vantages of making the model feasible to be operated using daily NOAA- AVHRR data. A customized application should be developed to extract the NDVl information directly from NOAA-AVHRR imagery and produce a
numerical table containing earth locations (longitude and latitude) and their corresponding NDVl values.
NOAA AVHRR Dato structure and processing method are available on the internet, and can be obtained through NOAA Official website. The NOAA dataset user is described in NOAA Polar Orbiter Data
user
guide (NOAA POD Guide). N O W Imagery extraction system was designed based on this user guide and Windows programming environment.2.6. Surface Interpolation
Remotely sensed data was constructed by a matrix of digital number corresponding to a certain observation point on the earth surface. Since the sensor scans the reflectance of features on the earth surface in the form of spheroid. the observation points are not Inearly distributed. To interpolate the observation value (e.g. NDVI) from
known
observation points into the entire surface of coverage area, the interpolation proces from reference points should be performed. This process is also a part of image rectification (Lillesand, 1994). Re-samplingprocess
is required to filt the matrlx cell value, For natural resources management or feature's detection, the nearest neighborhood re-sampling method is commonly used. This method sets the value of each target cell to the closest known point value (lillesand, 1994).111. Muteriab and Methods
3.1, Research Material
The output of this research was designed to support currently established rice growth model in SARI project,
Slnce
the rice growth dynamicmodel
had already been established (Handoko 1994). thls research focused ondata preparation for the model. The raw data input from NOAA AVHRR dataset were processed to produce NDVl as data input for the model b y the use of a computer programming language.
Direcl NOAA lrnogery Extraction Syslem for D a t o Acqulsitlon of Rice Growth
9
a. Study area : Java Island. The landuse map and other data are in ArcVlew format. All maps are in Geographic Coordinate System us- ing decimal degree unit, with a map scale of 1 : 250,000. Java Island covers about 70% of rice field in Indonesia.
b. Satellite Imagery
data:
NOW-AVHRR 14 daily data, downloaded fromNOAA webslte
~ ~ o : l / w w w
saa.noaa,aovl in LAC (Local Area Cov- erage) format, Temporal data boundary for this research is daily data from 01 January 1999 until 16 June 2000.c. Sputio-temporal data handling : Flle naming convention to handle daily input data and output data. Daily data consist of raw imagery data, rectified imagery data, NDVl imagery data, filtered imagery data. Spatial resolution of the observation is 100 ha for each pixel. Temporal resolution is daily.
d. Processing schedule : Data acquisition, image processing. NDVl
cal-
culation, filtering rice field data and file handling.
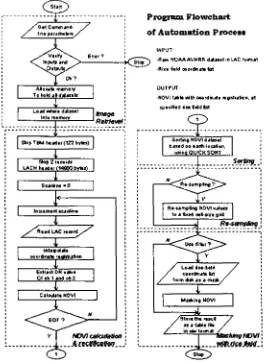
e. Programming constraints : Program flowchart is shown in Figure 3. Thii flowchart shows general steps of the extraction method. There are several constraints should be considered in this application:
1) Windows Memory management. Program should optimize the use of computer memory to reduce the 110 process. Most of windows based compiler such as DelpM or Visual C++ support the memory handling system.
High speed processing (efficient algorithm). Program should optimize the program flow to minimize the processing time.
3) Huge dataset. Program should be capoble to handle a very big dataset file and
manage
a multi-temporal data.4) Spatial and temporal database, Program considers NOAA-AVHRR dataset imagery as spatial databases. The data structure was based on NOAA POD Guide documentation.
1
0
Journol of GlS. Remote Sensing & Dynornic Modelling No. 2,2002 : J-23,....--.--- . _ _ - - . . . . _ _ _ _ . _ _ _ _ I ,
ProgramFbwehart
Oet C m m d -
hnt p r r a m k a : of Automation P-e#l
OUTPUT
[image:6.822.495.760.49.413.2]-NWI t.bh rllh m r r h a ~ r n p d ~ l m n . .t