accredited by DGHE (DIKTI), Decree No: 51/Dikti/Kep/2010 305
An Improved Image Contrast Assessment Method
Yuanyuan Fan1, Yingjun Sang2, Guang Hu1, Zaijin Zhou1, Yunrong Hao1
1Faculty of Mathematics and Physics, Huaiyin Institute of Technology, Huaian 223003, China 2
Faculty of Electronic and Electrical Engineering, Huaiyin Institute of Technology, Huaian 223003, China e-mail: [email protected]
Abstrak
Kontras merupakan faktor penting yang mempengaruhi kualitas gambar. Untuk mengatasi masalah lokal kontras-band terbatas, diusulkan sebuah metode baru penilaian kontras berdasarkan sifat HVS. Pertama, gambar dengan low-pass filter dilakukan dekomposisi wavelet cepat. Kedua, semua tingkat band-pass disaring sesuai gambar dan citra low-pass filter yang diperoleh dengan mengolah koefisien wavelet. Ketiga, kontras lokal band terbatas dihitung, dan band-terbatas entropi kontras lokal dihitung sesuai dengan definisi entropi. Akhirnya, entropi kontras gambar diperoleh dengan rata-rata entropi kontras-band lokal terbatas ditimbang menggunakan koefisien CSF. Hasil percobaan menunjukkan bahwa kontras gambar terbaik dapat diidentifikasi secara akurat dalam gambar urutan diperoleh dengan menyesuaikan waktu paparan dan peregangan abu-abu masing-masing, hasil penilaian sesuai dengan karakteristik visual manusia dan membuat kurangnya lokal kontras-band terbatas.
Keywords: penilaian kualitas gambar, kontras, transformasi wavelet, sensitivitas kontras, sistem visual manusia
Abstract
Contrast is an important factor affecting the image quality. In order to overcome the problems of local band-limited contrast, a novel image contrast assessment method based on the property of HVS is proposed. Firstly, the image by low-pass filter is performed fast wavelet decomposition. Secondly, all levels of band-pass filtered image and its corresponding low-pass filtered image are obtained by processing wavelet coefficients. Thirdly, local band-limited contrast is calculated, and the local band-limited contrast entropy is calculated according to the definition of entropy. Finally, the contrast entropy of image is obtained by averaging the local band-limited contrast entropy weighed using CSF coefficient. The experiment results show that the best contrast image can be accurately identified in the sequence images obtained by adjusting the exposure time and stretching gray respectively, the assessment results accord with human visual characteristics and make up the lack of local band-limited contrast.
Keywords: image quality assessment, contrast, wavelet transform, contrast sensitivity, human visual system
1. Introduction
The contrast is one of the most basic characteristics of the image, which has a significant impact on image quality. Too large or too small contrast will lead to the blur of the details of the image and degrade image quality. At present, the contrast of the image has many definitions, in simple mode, there are two basic definition [1]: Weber contrast and Michelson contrast, these two global definition contrast can give better assessment, but when incentives become more complex and contain a wide frequency range, the above two methods will fail; the apparent contrast, inherent contrast and modulation contrast [2] are commonly used in the visible light detection, in addition, contemporary contrast [3], average contrast [4], power spectral contrast [5], root mean square error contrast [6] are also more commonly used; in complex mode, there are mainly band-limited contrast [7], local band-limited contrast [8], S. Winkler isotropic contrast [9].
better than those without consideration of HVS assessment method [10], and the log-change performance is more in line with human visual characteristics. On the basis of local band-limited contrast, introducing contrast sensitivity(CSF) characteristics of HVS, a novel image contrast assessment method based on the property of HVS is proposed in this article, The experiment results show the effectiveness of the method which solves the shortage of local band-limited contrast, the assessment results accord with human visual characteristics.
2. Image Contrast Assessment Based On Human Visual System
The system framework of the assessment method is shown in Figure 1.
)
,
(
u
v
Bp
j)
,
(
u
v
Lp
j)
,
(
x
y
C
Lj
CE
(
x
,
y
)
L jFigure 1. Assessment algorithm block diagram
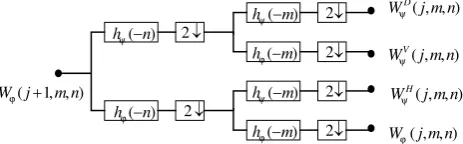
Firstly, the image by low-pass filter is performed fast wavelet decomposition. Secondly, all levels of band-pass filtered image and its corresponding low-pass filtered image are obtained by processing wavelet coefficients. Thirdly, local band-limited contrast is calculated, and the local band-limited contrast entropy is calculated according to the definition of entropy, Finally, the contrast entropy of image is obtained by averaging the local band-limited contrast entropy weighed using CSF coefficient.
2.1. Image preprocessing
At this stage, we analyze only the gray image, the assessment of color image contrast is the next topic. Therefore, if the image is a color image, it is extracted luminance component X, And then is low-pass filtered to obtain the image F in order to eliminate noise interference.
In the fast wavelet transform algorithm, the fast wavelet transform is achieved through iterative using of the digital filter. Two-dimensional fast wavelet transform ( FWT ) filter banks is shown in Figure 2 [11].
) , , 1 (j mn Wϕ
) ( n hψ
) ( n hϕ
2
2
) ( m hψ
) ( m hϕ
) ( m hψ
) ( m hϕ
2
2
2
2
) , , (jmn WD
ψ
) , , (jmn WV
ψ
) , , (jmn WH
ψ
) , , (jmn Wϕ
Figure 2 Two-dimensional fast wavelet transform filter banks
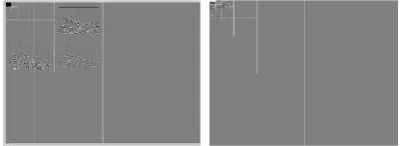
Considering the evaluation effect and running speed, the image after pre-processing is performed k =5 level fast wavelet decomposition, after a large number of simulation experiments, the Symlets sym4 of discrete wavelet series is selected as the wavelet function, the image Plane and its 5 scale wavelet transform is shown in Figure 3 .
2.2. Frequency decomposition
According to the definition of Lubin local band-limited contrast, the frequency coefficient
the corresponding low-pass f the filter banks, u, v are res
coefficient matrix. The secon frequency coefficient of image
Figure
Figure 4 the secon
2.3. IFWT
The extracted various
low–pass frequency coefficie
obtain the bandpass filtered i
level band-pass filter image a shown in Figure 5.
Figure 5 the
2.4. Computing local band-lim
2
( ,
( , )
( ,
j L
j
j
bp x
C
x y
lp
x
Where, c1,c2are con denominator are zero so that simulation test, c1 = 0.00001, c
s frequency coefficient
Lp
j2( , )
u v
are extracted respectively the abscissa and ordinate of any p cond band pass frequency coefficients and the c ge plane are shown in Figure 4.
re 3 Plane and its 5 scale wavelet transform
cond level band-pass and low-pass frequency coeff
us band-pass frequency coefficients Bpj(u,v)and t
cients Lpj2( , )u v are performed inverse fast wav
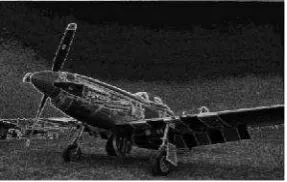
d image bpj(x,y) and low-pass filtered images lp
e and the corresponding low-pass filter image of
the third level band-pass and low-pass filter images
-limited contrast
( , )
1
( , )
2
x y
c
x y
c
onstants and greater than zero for preventing th at the result is no significance, in the paper, After a 1, c2 = 0.001.
d respectively from point in frequency corresponding low
efficient
d the corresponding
avelet transform to
) , (
2 x y
lpj . The third
of plane image are
es
(1)
2.5. Computing local band-limited contrast entropy
)
,
(
log
)
,
(
)
,
(
x
y
aC
x
y
2C
x
y
CE
Lj
Lj
Lj(2)
Where, a is adjustment factor, reasonable selection of a can make the results in a suitable range. In this paper , a = 10.
2.6. Computing contrast sensitivity weight
The commonly used CSF function is proposed by Mannos and Sakrison [12], the concrete form is:
)
)
114
.
0
(
exp(
)
114
.
0
0192
.
0
(
6
.
2
)
(
f
f
f
1.1A
(3)where the spatial frequency
2 2
y
x
f
f
f
( cycles / degree ),
f
xandf
yare horizontal and vertical spatial frequency respectively.For image F, each pixel spatial frequency value f is calculated. the image is blocked pixel by pixel, the block size is M * N, then the row space frequency and column space frequency of the image block are shown below respectively [13].
1 1
2
0 1
1
[ ( , )
( ,
1)]
M NR
x y
f
F x y
F x y
MN
(4)
1 1
2
0 1
1
[ ( , )
(
1, )]
N MC
x y
f
F x y
F x
y
MN
(5)
The image spatial frequency:
2 2
(
R)
(
C)
f
f
f
(6)
The f is unitary processed:
min
max min
2 (
)
norm
f
f
f
f
f
(7)
Where
f
maxandf
min are the maximum and minimum values of the image blocksspatial frequency respectively;
f
normis normalized spatial frequency value. The CSF weight)
,
(
x
y
Q
of image is obtained through puttingf
norminto formula (3) , in this paper M = N = 3. The CSF weighed image of plane is shown in Figure 6.2.7. Calculation of image contrast entropy
To reflect the characteristics of human visual system, the contrast entropy of
image(HVSNRC) is obtained by averaging the local band-limited contrast entropy
CE
(
x
,
y
)
L j1 1
1
1
1
k jHVSNRC
k
m
where m, n are image
F
3. Experimental Results and In order to verify the v caused by gray-scale stretch the results are compared to th
3.1. Gray stretch images The original image Ca is processed: the gray of eac pixels higher than the mean respctively, while the gray val 40, 35, 30, 25, 20, 15, 10, 5 re the image is to do the oppos image are decreased 45, 40, 3 lower than the mean in the im get another 9 pieces of low c state. In order to facilitate the Figure 8 shows the comparis image is 10, the gray stretc respectively.
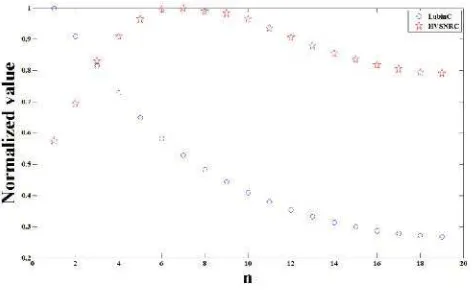
As shown in Figure 7, th can enhance image contrast, image quality, in which the im image details can not be fully reduced gradually, the B is th the image details become blu Compared with b and g, the distortion is very serious, the assessment results on gray str with the characteristics of hum the best image of contrast in with human visual system, and
3.2. Different exposure time im At present, some peop field [14-15], and image contr technology based on image pr This part of images camera MS50K produced in Ca other conditions remain uncha to 400000μ s, the image is se
,
1
( , )
Lj( , )
x y
Q x y CE x y
mn
ge length and width respectively, k is wavelet decom
Figure 6 CSF weighed image of plane
nd Analysis
e validity of the proposed assessment method, the h and exposure time are chosen to carry out the the Lubin local-band contrast (LubinC).
Carnivaldolls selected in the LIVE Database Relea ach pixel is stretched to the both sides of mean, an in the image are increased 45, 40, 35, 30, 2 value of pixels lower than the mean in the image a respectively to get 9 pieces of contrast enhanced osite process, the gray value of pixels higher than
, 35, 30, 25, 20, 15 ,10, 5 respectively, while the gr image are increased 45, 40, 35, 30, 25, 20, 15, 10
contrast images Figure 7 shows the original ima he comparison and analysis, the evaluation values rison for HVSNRC and LubinC, where the serial n etching and compressing images are at its righ
7, the gray stretch amplitude between 5 and 15 to th st, make the details of the image more clearly, the image d is the best; but with the increasing gray s lly embodied and even lost cause image distortion the worst. The gray compression to the original im
lurred, image quality is reduced gradually, the g e the background of image b has been completely
the quality is worse. As you can see from Figu stretch image give the high assessment value, wh uman vision, while the HVSNRC in this paper can a in a series of gray image, the assessment result is
nd consistent with human subjective feeling.
e images
eople have done a lot of research works in image a ntrast assessment function plays a key role in au processing.
s are a series of BMP images continuously sho Canadian Mega Speed company, the resolution is changed during filming, the exposure time is adjus selected every 1000us, and 40 pieces of images
(8) composition level.the contrast images e experiments, and
ease2 image library n, the gray value of , 25, 20, 15, 10, 5 are decreased 45, d images; And then an the mean in the gray value of pixels , 10, 5 respctively to age and its typical es were normalized. l number of original ight and left sides
to the original image thereby improve the y stretch amplitude, tion, image quality is l image also makes effect is the worst. tely lost, the image gure 8, the LubinC which do not accord n accurately identify t is more consistent
automatic dimming automatic dimming
exposure to excessive exposu exposure time. In order to fa normalized. Figure 10 shows t
(b)
(d)
Figure 7 Carnivaldolls and stretch 30, (d) gray stretch
Figu
As shown in Figure 40000μ s, at the beginning ima not been shown up, and the im image contrast is increased gr exposure starts excessive, the
osure are selected, Figure 9 shows 6 pieces of im facilitate the comparison and analysis, the evalua s the comparison for HVSNRC and LubinC.
(a)
(c) (d)
(e) (f)
d its typical state, (a) original image, (b) gray stretc tch 15, (e) gray compression 15, (f) gray compressio
compression 45
igure 8 Comparison for 2 kinds of methods
re 9, in the process of adjusting exposure time mage exposure is serious inadequacy, the dark par
image contrast is very low, while with the increasin gradually, and achieve the best state at 15000us, the bright part of the details information get worse a
images of different luation values were
tretch 45, (c) gray sion 30, (g) gray
e from 1000μ s to art of the details do sing exposure time, s, subsequently the
a 2000μ s
d 24000μ s
Fi
As you can see from detail lost due to underexpos properties, while HVSNRC co series of exposure image, characteristics.
Figure
4. Conclusion
In this paper, the ana method and the human visual assessment method based o results show that the best con obtained by adjusting the ex results accord with human vi contrast.
b 7000μ s c 15000μ
e 32000μ s f 40000μ
Figure 9 different exposure time images
m Figure 10, the LubinC can not give a good eva posed, the assessment result is not consistent wi
could quickly and accurately find out the image of , the assessment result is more consistent wi
ure 10 Comparison of two kinds of methods
nalysis of the defects of the local band-limited co al system characteristics have been carried out, on on the human visual characteristics is proposed contrast image can be accurately identified in the s
exposure time and stretching gray respectively, visual characteristics and make up the lack of l
00μ s
0μ s
valuation of images t with human visual f best contrast in a with human visual
Acknowledgments
This work was supported in part by Science Research Foundation of Huaiyin Institute of Technology (HGC1112).
References
[1] E Peli. Contrast in complex images.Optical Society of America. 1990; 7(10): 2032-2040.
[2] DAIDe-de, SUN Hua-yan, HAN Yi,et al.Image quality assessment of laser active imaging system. Laser & Infrared. 2009; 39(9): 986-990.
[3] Sanchez-marin F J, Srinivas Y, Jabri K N,et al. Quantitative image quality analysis of a nonlinear spatio-temporal filter.IEEE Transactions on Image Processing. 2001; 10(2): 288-295.
[4] CHEN Yong, AI An-na, WANG Jie,et al. Automatic parameter optimization for lower layer image mining technique.Journal of Optoelectronics Laser. 2009; 20(7): 950-953.
[5] GUO Baoping,ZHANG Zhaodong. Application of Blind Image Quality Assessmentin the Intelligent Transportation System.Transportation Information and Safety. 2009; 1(27): 157-160.
[6] M. Pavel, G. Sperling, T. Riedl, A. Vanderbeek, Limits of visual communication: the effect of signal-to-noise ratio on the intelligibility of American Sign Language.Opt Soc Am.1987; A 4: 2355-2365. [7] R F Hess, A. Bradley, L Piotrowski. Contrast- coding in amblyopia. I. Differences in the neural basis
of human amblyopia. Proc. R. Soc. London Ser.1983; B 217: 309-330.
[8] J Lubin. A visual discrimination model for imaging system design and evaluation in Vision Models for Target Detection and Recognition. World Scientific Publishing. 1995: 245–283.
[9] S Winkler, P Vandergheynst. Computing isotropic local contrast from oriented pyramid decompositions. Proceedings of ICIP. 1999; 420-424.
[10] Wang Kongqiao, Jari A. Kangas. Quality Assessment of Digital. Images Measurement & Control Technology.2000; 19(5): 14-16.
[11] Rafael C.Gonzalez. Digital Image Processing Using MATLAB. Publising House of Electronics Industry. 2005.
[12] J L Mannos, D J Sakrison.The effects of a visual fidelity criterion on the encoding of images.IEEE Transactions on Information Theory. 1974; 20(4): 525-536.
[13] WEI Chongkui. Studying of the Method for Image Quality Assessment Model Via HVS. Chang Sha, National University of Defense Technology. 2003.
[14] Jin L X, Lv Z M, Xiong J W. Automatic light-adjusting system of CCD video camera.Opt. Precision-Eng.2002; 10(6): 588-591.
[15] Guan Che, Wang Yan-Jie. Real-time auto light control system of CCD camera.Opt. Precision- Eng. 2008; 16(2): 358-366.