KEK SOO LING
BORANG PENGESAHAN STATUS TESIS
JUDUL: UNSUPERVISED IMAGE CLASSIFICATION USING ISODATA AND FUZZY C-MEANS
SESI PENGAJIAN: SESI 2013/2014
Saya KEK SOO LING mengaku membenarkan tesis (PSM/Sarjana/Doktor Falsafah) ini disimpan di Perpustakaan Fakulti Teknologi Maklumat dan Komunikasi dengan syarat-syarat kegunaan seperti berikut:
1. Tesis dan projek adalah hakmilik Universiti Teknikal Malaysia Melaka.
2. Perpustakaan Fakulti Teknologi Maklumat dan Komunikasi dibenarkan membuat salinan untuk tujuan pengajian sahaja.
3. Perpustakaan Fakulti Teknologi Maklumat dan Komunikasi dibenarkan membuat salinan tesis ini sebagai bahan pertukaran antara institusi pengajian tinggi.
4.**Sila tandakan (/)
_____________ SULIT (Mengandungi maklumat yang berdarjah keselamatan atau kepentingan Malaysia seperti yang termaktub di dalam AKTA RAHSIA RASMI
1972)
_____________ TERHAD (Mengandungi maklumat TERHAD yang telah ditentukan oleh organisasi/badan di mana penyelidikan dijalankan)
√ TIDAK TERHAD
__________________________ ___________________________ (TANDATANGAN PENULIS) (TANDATANGAN PENYELIA) Alamat tetap :3510, Taman Muhibbah, EN. OTHMAN BIN MOHD 73200 Gemencheh, NS Nama Penyelia
Tarikh : ___________________ Tarikh: ____________________
CATATAN: * Tesis dimaksudkan sebagai Laporan Akhir Projek Sarjana Muda (PSM)
KEK SOO LING
This report is submitted in partial fulfillment of the requirement for the Bachelor of Computer Science (Computer Networking)
FACULTY OF INFORMATION AND COMMUNICATION TECHNOLOGY UNIVERSITI TEKNIKAL MALAYSIA MELAKA
DECLARATION
I hereby declare that this project entitled
UNSUPERVISED IMAGE CLASSIFICATION USING ISODATA AND FUZZY C-MEANS
is written by me and is my own effort and that no part has been plagiarized without citations
STUDENT: ___________________________ DATE: _________________ (KEK SOO LING)
DEDICATION
Dear Parents
Thank you for your giving me the big support and encouragement. Your biggest support and care have helped me to achieve the final task in my university life.
Dear Lecturer, Supervisors and Evaluator
ACKNOWLEDGEMENTS
Firstly, I feel lucky to have persevere, patience and good health throughout the duration of this final year project research. I feel very fortunate to have En Othman Bin Mohd as my research supervisor. Besides, I would like to express my high appreciation to my supervisor En. Othman Bin Mohd. The supervision and support that he gave truly help the progression and smoothness of my final year project. The co-operation is much indeed appreciated. For evaluator, Dr Azman Abu, thank you for guidance during the presentation on PSM and also for the evaluating and reading this report.
Moreover, deepest thanks and appreciation to my parents and family members for their encouragement and full of support for the report completion, from the beginning till the end.
ABSTRACT
ABSTRAK
Kajian ini fokus kepada teknik tanpa pengawasan ke atas imej satelite untuk membuat klasifikasi dengan mengunakan dua teknik iaitu ISODATA dan FCM. ISODATA merupakan lanjutan kepada KMeans algorithma tetapi ISODATA menentukan beberapa kumpulan secara dinamik. ISODATA akan mencari kluster sentroid yang terbaik melalui pendekatan leleran sehingga is mencapai penumpuan kriteria. Selain itu, ISODATA melibatkan pemisahan dan penggabungan keputusan kluster atas ambang yang dispesifikasikan oleh pengguna. Bagi situasi permisahan, kluster akan memisahkan kepada dua bahagian semasa sesuatu sisihan piawai kluster berada pada tahap yang atas ambang yang dispesifikasikan. Bagi situasi penggabungan, dua kluster akan bergabung semasa jarak antara sentroid kurang dari tahap yang ditetapkan. FCM merupakan teknik fuzzy yang popular kerana ia berkaitan dengan hubungan antara data dengan 0 and 1. Maka, objektif FCM adalah mencari kluster sentroid untuk mengurangkan ketidaksamaan antara algorithma. Kesimpulannya, kajian ini adalah untuk menjalankan pengklasifikasian dan membincangkan teknik yang menghasilkan keputusan yang baik dengan menggunakan Matlab 2010a.
TABLE OF CONTENTS
CHAPTER SUBJECT PAGE
DECLARATION i
DEDICATION ii
ACKNOWLEDGEMENTS iii
ABSTRACT iv
ABSTRAK v
TABLE OF CONTENTS vi
LIST OF TABLES ix
LIST OF FIGURES x
LIST OF ABBREVIATIONS xii
CHAPTER 1 INTRODUCTION
1.1 Project Background 2
1.2 Problem Statements 4
1.3 Research Questions 5
1.4 Objective 6
1.5 Scope 7
1.6 Project Significant 8
1.7 Expected Result 8
1.8 Report Organization 10
1.9 Summary 10
CHAPTER 2 LITERATURE REVIEW
2.1 Introduction 11
2.2 Related Work 12
2.2.2 Image Classification
Definitions 15
2.2.3 Unsupervised Classification
Techniques 17
2.3 Analysis of current problem and
justification 21
2.4 Proposed Solution 22
2.5 Summary 23
CHAPTER 3 METHODOLOGY
3.1 Introduction 24
3.2 Project Methodology 24
3.3 Project schedule and Milestones 30
3.4 Gantt Chart 35
3.5 Summary 36
CHAPTER 4 IMPLEMENTATION
4.1 Introduction 38
4.2 Project Requirements 38
4.2.1 Software Requirements 39 4.2.2 Hardware Requirements 40
4.3 Unsupervised Classification
Techniques Algorithms 40
4.3.1 ISODATA 42
4.3.2 FCM 45
CHAPTER 5 TESTING
5.1 Introduction 55
5.2 Test Plan 55
5.2.1 Test Organization 56
5.3 Test Description 56
5.3.1 Preprocessing 58
5.3.2 Processing 59
5.3.3 Decision 64
5.3.4 Accuracy Test 68
5.3.5 Final Output 69
5.4 Summary 71
CHAPTER 6 PROJECT CONCLUSION
6.1 Introduction 72
6.2 Advantages and Disadvantages of
Techniques 72
6.3 Contribution 73
6.4 Future Work 74
6.5 Summary 74
REFERENCES 75
APPENDIX A 76
LIST OF TABLES
FIGURE TITLE PAGE
1.1 Summary of Problem Statements 4
1.2 Summary of Research Questions 5
1.3 Summary of Research Objectives 6
3.1 Milestones for PSM 1 Summary 31
3.2 Milestones for PSM 2 Summary 32
3.3 PSM 1 Activities 32
3.4 PSM 2 Activities 34
4.1 Software Requirements 39
4.2 Hardware Requirement 40
4.3 ISODATA Parameters 44
4.4 FCM Parameters 47
4.5 ClusterFinder Buttons Description 49
4.6 Specified ISODATA Parameters 51
5.1 Organization responsibilities on testing phase 56 5.2 Organization responsibilities on testing phase 57
5.3 Objects for ISODATA clusters 65
5.4 Objects for FCM clusters 66
5.5 Comparison of clusters between ISODATA and FCM 67 5.6 Classified Image and Pie Chart of ISODATA 67 5.7 Classified Image and Pie Chart of FCM 68
5.8 MSE of ISODATA and FCM 69
5.9 Characteristic comparison between ISODATA and
FCM 70
6.1 Advantages of ISODATA and FCM 73
LIST OF FIGURES
FIGURE TITLE PAGE
2.1 Summary Chart for Image Processing 13
2.2 Image Classification Process 15
2.3 Overview of Proposed Solution 22
3.1 Summary Chart of Image Processing 25 3.2 Unsupervised Classification of the Satellite Image 26 3.3 Five main stages for the overall project 27
3.4 Project Methodology Flows 29
4.1 The Flow of Unsupervised Classification
Techniques Implementation 41
4.2 The Overall Flow of ISODATA 42
4.3 The Flow Chart of ISODATA 43
4.4 The Overall Flow of FCM 45
4.5 The Flow Chart of FCM 46
4.6 GUI for ISODATA testing 48
4.7 GUI for FCM testing 48
4.8 Code to read RGB image 50
4.9 Codes to convert RGB image to L*a*b image 50 4.10 Codes to convert data into ‘double’ format 50
4.11 Codes to reshape data 50
4.12 Codes for FCM to train data 51
4.13 Codes for FCM to train data 51
4.18 Codes for display FCM segmentation 53 4.19 Codes for display ISODATA segmentation 53
4.20 MSE Main Function 54
5.1 Preprocessing Flow 58
5.2 Reshape data(X), mean and standard deviation of
X 58
5.3 Preprocessing test output image. (a) Original RGB
image, (b) L*a*b image 59
5.4 Preprocessing test output image 59
5.5 ISODATA Classified Image 60
5.6 Segmented ISODATA Image. (a) Objects in cluster 1, (b) Objects in cluster 2, (c) Objects in cluster 3, (d) Objects in cluster 4, (e) Objects in
cluster 5 61
5.7 FCM Classified Image 62
5.8 Segmented FCM Image. (a) Objects in cluster 1, (b) Objects in cluster 2, (c) Objects in cluster 3, (d)
Objects in cluster 4, (e) Objects in cluster 5 63 5.9 The Flow of Decision Test for ISODATA and
FCM. 64
5.10 The Flow of Final Output Testing 69 5.11 Final Classified Images. (a) ISODATA Classified
LIST OF ABBREVIATIONS
TERMS DESCRIPTIONS
FCM Fuzzy c-Means
ISODATA Iterative Self-Organizing Data Analysis Technique Algorithm MSE Mean Square Error
RP Research Problem
CHAPTER I
INTRODUCTION
and by performing some algorithms or operations after converting the image into form of digital (Hossain, 2012). It was an assignment of signal in which the input image can be in form of photo or video frame and produce an output that full with characteristics that related to the input image (Hossain, 2012). Image processing can be divided into several parts which include image classification, image compression, image segmentation, image restoration and so on. However, this project will be covered on image classification.
Image classification is the process of extracting differentiated classes or themes from raw remotely sensed data. The main or objectives of the classification process is to categorize all pixels in an image with amount of digital data into several spectral classes, or themes with similar spectral attributes and then each spectral class is assigned to an information class (Caprioli et al., 2003).
Normally, multispectral data are used to perform the classification and, indeed, the spectral pattern present within the data for each pixel is used as the numerical basis for categorization (Lillesand and Kiefer, 1994). Categorization of image pixels is based on their digital number or gray values in one or more spectral bands.
As humans expert with satellite image based on visual perception that provide surroundings information but as sensors, it provide visible range of electromagnetic energy which are greatly limited sensitivity to humans eyes and it is able to form a lasting record of what human view, therefore a lot of methods been developed to increase the ability to see and record the physical properties of land cover (Tur et al., 2001).
used to train an algorithm of image classification. After trained, the algorithm can be applied to all of image and finally the image that is classified is gained (Kamaruzaman et al., 2009). Supervised classification was divided into several techniques which were Minimum Distance to Mean, Maximum Likelihood, Mahalanobis, Stepwise Linear, Suits’ Maximum Relative and Back Propagation.
For unsupervised image classification, it does not require prior knowledge about the land cover and the image is automatically classified into spectral classes based on natural groupings found into the data (Caprioli et al., 2003). It was divided into several techniques which were Iterative Self-Organizing Data Analysis Technique Algorithm (ISODATA), K-Means, Fuzzy C Means, Simple One-Pass Clustering, Minimum Distribution Angle, Self-Organization, and Adaptive Resonance.
A pixel in satellite image might represent a mixture of class covers, variability of within-class or other complex surface cover patterns. The overlapping pixel cannot be correctly described by one class due to the image spatial resolution (pixel size). The mixed pixel (overlapping pixel) may influenced the accuracy of the classification or misclassification even though a good training area been selected (Mohd Othman et al., 2012).
According to (Ozesmi et al., 2002), the problem of overlapping pixels is dealing with fuzzy classification. In supervised classification, mixed pixels typically generate misclassification while the mixed pixels in unsupervised classification are dealing by using mixed labels because the information can be extracted without using the traditional per-pixel classifier (Mohd Othman et al., 2012).
information that required us to reveal. Sometimes we have no prior knowledge about the land cover and it is not easy to recognize or identify the object or pixels inside the image that needed. In order to make the image easy to classified, recognized and identified without prior knowledge, the unsupervised image classification is applied. However, there are a lot of techniques under image classification and each produce different result. Therefore, it was required to find out which technique is more suitable. The Research Problem (RP) is summarized into Table 1.1 as below:
Table 1.1: Summary of Problem Statements RP Research Problem
RP1 Too many techniques can be applied to image classification. RP2 Lack of understanding how unsupervised techniques process.
RP3 Lack of image understanding and recognition of an object or pixel which represent information in the image.
Based on the research problems in Table1.1, three research questions are conducted and the explanation for each of the Research Problems is explained as below:
RP1: Too many techniques can be applied to image classification.
This research problem is due to a lot of techniques that can be applied in image classification and may no prior knowledge about the techniques and have to make a decision to select suitable techniques to classify the satellite image
RP2: Lack of understanding how unsupervised techniques process.
RP3: Lack of image understanding and recognition of an object or pixel which represent information in the image.
This research problem is because of each pixel in an image can be a mixed pixel and unmixed pixel. In unmixed pixel, the data or information in an image can be easily be identified but in mixed pixels, there may contain two different pixels inside one pixel, therefore it is hardly to be classified.
1.3 Research Questions
Based on the problem statement that been stated in Table 1.1, the research question was identified. The research questions were summarizing and stated in Table 1.2.
Table 1.2: Summary of Research Questions RP RQ Research Questions
RP1 RQ1 Which image classification techniques been selected to classify the satellite image?
RP2 RQ2 How unsupervised image classification techniques function? RP3 RQ3 What is the meaning or information of the group of the pixels in an
image that produced by the techniques represent?
From Table 1.2, the explanation for each of the Research Questions is constructed and described as follow:
RQ1: Which image classification techniques been selected to classify the satellite image?
unsupervised technique performed in different ways to classify an image.
RQ3: What is the meaning or information of the group of the pixels in an image that produced by the techniques represent?
This research question is stated in order to understand and recognize the groups of pixels that been classified and the pixels that bring out the meaningful information to the image.
1.4 Objective
The appropriate research objectives are constructed based on the research problems and research questions objectives that were mentioned before. The summary of the research objectives were shown in Table 1.3.
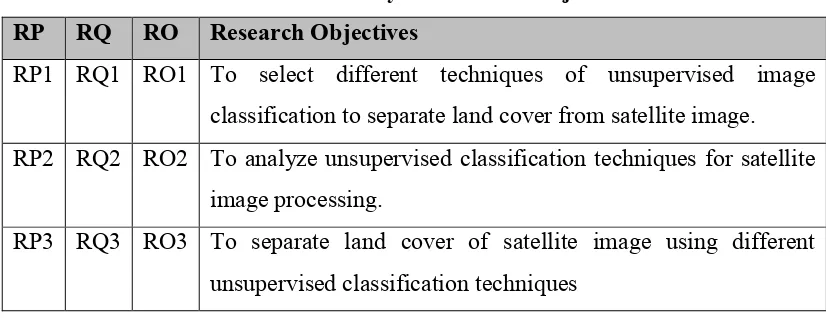
Table 1.3: Summary of Research Objectives RP RQ RO Research Objectives
RP1 RQ1 RO1 To select different techniques of unsupervised image classification to separate land cover from satellite image. RP2 RQ2 RO2 To analyze unsupervised classification techniques for satellite
image processing.
RP3 RQ3 RO3 To separate land cover of satellite image using different unsupervised classification techniques
RO1: To select different techniques of unsupervised image classification to separate land cover from satellite image.
In order to classify the pixels of an image into meaningful data, first need to identify the image classification techniques. Since do not have the prior knowledge of land cover, unsupervised classification techniques are more suitable to be selected. The unsupervised classification techniques that been chosen were ISODATA and Fuzzy C-Means.
RO2: To analyze unsupervised classification techniques for satellite image processing.
Each unsupervised techniques have their own procedure and function, therefore need to analyze the procedure of each technique to classify the pixels into meaningful class.
RO3: To separate land cover of satellite image using different unsupervised classification techniques
Based on the analysis, each data in an image will be separate into different clusters and the output will be produce.
1.5 Scope
spectral classes based on identification of natural groupings found in the data. The procedure of classifying the satellite image using ISODATA and Fuzzy C Mean were shown in this project and the thematic classes been produced. At the end of this project, the resulted of image classification using these two techniques were analyzed and compared. Finally, each percentage of the generated clusters will be calculated.
1.7 Expected Result
By the end of this project, the expected results must achieve the goals of this project:
i. The procedure of each unsupervised image classification techniques that performed to classify the satellite images is shown.
ii. The objects or pixel in an image can be distinguished and identified easily. iii. The thematic image is identified and shown.
1.8 Report Organization
In this project, the report organization included six main chapters. Each of the main chapters will describe the main task or procedure in order to perform this project.
scope was focus on the domain of the project which was ISODATA and Fuzzy C Means. Apart from that, the expected result is the part that stated the goals of the objective and must be achieved at the end of the project. Finally was the report organization which was carried out to assure the report was organizing in a systematic manner.
In Chapter II: Literature Review, the related work, analysis of current problem and justification, and proposed solution for the project were discussed and described in this chapter. The related work was the research on the basic concepts of the project domain. After that, current problems in the current situation of image classification were analyzed and discussed. In order to overcome those problems, the proposed solutions were proposed.
In Chapter III: Methodology, the topics included project methodology, project schedules and milestones were discussed. The project methodology shows the overall of the project flows and the main five steps flows were discussed in this chapter. For the project schedules and milestone, it was a topic that shows the person that included in this project and how to organize the time and activities in order to perform in a timely manner.
In Chapter IV: Implementation, the two main topics were discussed: project requirement and the algorithms of the unsupervised classification techniques. In project requirement, it was divided into two sub topics which were software requirement and hardware requirement while for algorithms of the unsupervised classification techniques, it was discussed the algorithms and the different processing flows of the classification techniques and the steps to implement in this project were discussed in this chapter.