Excitation Wave Propagation as a Possible Mechanism for Signal
Transmission in Pancreatic Islets of Langerhans
Oleg V. Aslanidi,* Oleg A. Mornev,† Ole Skyggebjerg,‡Per Arkhammar,§ Ole Thastrup,§Mads P. Sørensen,¶ Peter L. Christiansen,¶Knut Conradsen,¶and Alwyn C. Scott¶
*Institute of Cell Biophysics RAS and†Institute of Theoretical and Experimental Biophysics RAS, Pushchino, Moscow Region, 142290 Russia; and‡Department of Cell Biology, Novo Nordisk A/S, DK-2820 Gentofte,§BioImage A/S, DK-2860 Søborg, and¶Department of Mathematical Modelling, The Technical University of Denmark, DK-2800 Lyngby, Denmark
ABSTRACT In response to glucose application,b-cells forming pancreatic islets of Langerhans start bursting oscillations of the membrane potential and intracellular calcium concentration, inducing insulin secretion by the cells. Until recently, it has been assumed that the bursting activity ofb-cells in a single islet of Langerhans is synchronized across the whole islet due to coupling between the cells. However, time delays of several seconds in the activity of distant cells are usually observed in the islets of Langerhans, indicating that electrical/calcium wave propagation through the islets can occur. This work presents both experimental and theoretical evidence for wave propagation in the islets of Langerhans. Experiments with Fura-2 fluorescence monitoring of spatiotemporal calcium dynamics in the islets have clearly shown such wave propagation. Furthermore, numerical simulations of the model describing a cluster of electrically coupledb-cells have supported our view that the experimentally observed calcium waves are due to electric pulses propagating through the cluster. This point of view is also supported by independent experimental results. Based on the model equations, an approximate analytical expression for the wave velocity is introduced, indicating which parameters can alter the velocity. We point to the possible role of the observed waves as signals controlling the insulin secretion inside the islets of Langerhans, in particular, in the regions that cannot be reached by any external stimuli such as high glucose concentration outside the islets.
INTRODUCTION
Nonlinear processes of generation and propagation of exci-tation pulses play a key role in controlling various systems of a living organism. Examples are the directed flows of electric nerve pulses providing consistent exchange and processing of information in neural networks, waves of intracellular calcium concentration participating in many cellular signaling events, and electric excitation waves in the heart, the propagation of which induces the influx of Ca21
ions into cardiac cells and a following cascade of biochemical reactions leading to heart contractions.
The latter example illustrates the connection between electrical processes at cell membranes with biochemical reactions flowing within the cells. Another example of such a connection is insulin secretion by pancreaticb-cells. The secretion process is induced by Ca21ions flowing into the cells upon generation of electric pulses, action potentials (APs), at the cell membranes (Ashcroft and Rorsman, 1989; Hellman et al., 1994; Henquin et al., 1998). The form of these APs differs from those in the nervous system and in the heart. The AP’s plateau in theb-cells is not smooth, but is characterized by rapid oscillations of the electric poten-tial, known as bursts (Atwater et al., 1978; Satin and
Smolen, 1994; Sherman, 1997). Bursts are generated in b-cells periodically in response to the increase of glucose concentration in the external medium. They initiate pulsatile insulin signals responsible for utilization of glucose by the target tissues (e.g., liver and muscles), thus maintaining the normal blood glucose concentration. Disturbances in the periodic performance of b-cells lead to increasing blood glucose concentration and development of the metabolism derangement known as diabetes mellitus (see Tornheim, 1997).
In the pancreas,b-cells are organized in clusters contain-ing several thousand cells connected through gap junctions (Meda et al., 1984; Perez-Armendariz et al., 1991; Andreu et al., 1997). Such clusters, called the islets of Langerhans, hence, represent a functional syncytium of interconnected b-cells (Meissner, 1976; Bonner-Weir et al., 1989; Valde-olmillos et al., 1996). Because b-cells are excitable (e.g., electrically), the islets of Langerhans can be interpreted in terms of the theory of nonlinear systems as excitable media (see Tyson and Keener, 1988; Holden et al., 1991; Scott, 1999).
Until recently, the bursting activity ofb-cells in a single islet appearing as periodic AP generation (and correspond-ing oscillations of intracellular calcium concentration) has been assumed synchronized due to the electric coupling between the cells (Meda et al., 1984; Eddlestone et al., 1984; Santos et al., 1991; Bergsten et al., 1994; Valdeol-millos et al., 1996). This empirical proposition was based on the fact that the experimentally observed time delayDt'
1 s between the emergence of similar bursts at opposite sides of the islet is an order of magnitude less than the
Received for publication 13 September 2000 and in final form 8 June 2000.
Address reprint requests to Dr. Mads P. Sørensen, The Technical Univer-sity of Denmark, Department of Mathematical Modelling, Bldg. 321, DK-2800 Lyngby, Denmark. Tel.: 45-4525-3094; Fax: 45-4593-1235; E-mail: [email protected].
period of burstingT'10 s, which gives a small value for the relative desynchronizationDt/T '0.1.
However, it is known that the small desynchronization can also be implemented in the case when activity of an excitable medium is sustained not by quasi-periodic firing, but due to periodic propagation of excitation waves through the medium (see, e.g., Bonke et el., 1987; Holden et al., 1991; Scott, 1999). The heart is a common example of such a medium.
The functioning of the heart is essentially related to periodic AP propagation from atria to ventricles, which provides the correct sequence of contractions of these cham-bers. The velocity of AP propagation through the heart tissues has the characteristic value ofv51 m/s (see Bonke et al., 1987; Zipes and Jalife, 1994); hence the time delayDt
upon AP propagation along the tissue with the characteristic linear dimensionsL5 10 cm isDt5 L/v50.1 s. Taking into account that the period of AP generation in the heart is aboutT51 s, one can obtain the same valueDt/T50.1 for the relative desynchronization as in the case of the islets of Langerhans.
The example considered shows that the time delays in bursting activity, observed in the islets of Langerhans, can be explained by AP propagation through cells of the islet. Recently, several authors (Palti et al., 1996; Cao et al., 1997; Bertuzzi et al., 1999) have pointed to the possibility of wave-like activity in the islets.
This work presents both experimental and theoretical evidence for propagation of electric and/or calcium waves in the islets of Langerhans. First, experimental results on monitoring the calcium dynamics in cultured clusters of b-cells are described. These experiments reveal asynchro-nous spatiotemporal calcium oscillation reflecting wave ac-tivity in the clusters. Then numerical simulations of an up-to-date model of electrical/calcium dynamics in coupled b-cells are performed to support the view that the wave propagation mechanism is apparently based on the AP prop-agation to which calcium influx into the cells is connected. Based on the model equations, an approximate analytical expression for the wave velocity is introduced, suggesting which parameters can alter the velocity. The paper con-cludes with a discussion of the possible implications of the obtained results and the possible role of the observed waves as signals controlling the insulin secretion inside the islets of Langerhans, in the regions that cannot be reached by any external stimuli such as high glucose concentration outside of the islet.
MATERIALS AND METHODS Preparation and solutions
Pancreatic islets were isolated from NMRI mice by standard collagenase digestion, as previously described (Lernmark, 1974). Once isolated, islets were individually transferred into chambers of LabTek eight-well glass coverslips coated with extracellular matrix (ECM). ECM presents a
mix-ture of adhesion compounds produced by bovine corneal endothelial cells, which, when coated on the coverslips, improves the ability of the islet cells to attach and spread into a flattened structure. Details of the ECM prepa-ration procedure, as well as a justification of the culture method with regard to functionality of the islets, are described elsewhere (Arkhammar et al., 1998). In particular, the culturing conditions are shown to prolong the survival of cells, so that no necrotic zones are formed in the islets even after several weeks of culturing. The experiments were performed with islets cultured on ECM for 1–2 weeks in 400 ml of RPMI 1640 medium supplemented with 11 mM glucose and 10% fetal calf serum (FCS).
The extracellular solution used in the experiments was a modified Krebs-Ringer buffer, KRW buffer, containing (in mM): 140 NaCl, 3.6 KCl, 0.5 NaH2PO4, 0.5 MgSO4, 2.0 NaHCO3, 1.5 CaCl2, 10 HEPES, 3 glucose,
pH 7.4. For the experiments, the islets were incubated in this KRW buffer in the presence of 1mM final concentration of Fura-2 acetoxy-methylester (Molecular Probes, Eugene, OR). The incubation time was 30 min at 37°C. Note that both before and after the incubation the islets were washed three times with KRW. Finally, the islets were allowed to equilibrate for 5 min in 400ml of KRW buffer.
To start the activity inb-cells during the experiment, 10 mM glucose was gently administered. Half of the KRW buffer (200ml) was removed from the chamber and mixed with the glucose, and then the mixture was carefully added back.
Fluorescent imaging
For recording and visualization of the calcium activity in islets, we used an inverted epifluorescent microscope (Diaphot 300, Nikon, Copenhagen, Denmark) equipped with a computer-controlled xenon-lamp-based mono-chromator (TILL Photonics, Planegg, Germany), capable of exciting in a range from 250 to 600 nm, 12-nm bandwidth. The emitted light passed through a 400-nm dichroic mirror and was filtered at 510 nm. The fluo-rescence images were collected with a cooled two-generation intensified video CCD camera, model CXTI (Photonics Science, Robertsbridge, UK). The images were grabbed and transferred digitally to the memory of a computer using a Raptor frame grabber. The computer, a Micron Mille-nium, Pentium 133 MHz, 128 MB RAM, controlled the monochromator via a National Instruments data acquisition I/O ISA board (NI-16). The image acquisition was performed at the rate of one image per second.
Calcium concentration was measured by the ratioR5I340/I380, where
I340is the fluorescence intensity from calcium-bound Fura-2 observed at
the excitation wavelength 340 nm, andI380is the fluorescence intensity of
free Fura-2 observed at the excitation wavelength 380 nm. As fluorescence is dependent on concentration of the Fura-2, using such a ratio eliminates problems with uneven loading and difference in concentration of Fura-2 within a cell or islet.
A coverslip chamber with the islet, placed on the microscope stage, was surrounded by a Nikon incubator box, thermostatically controlled and kept at 37°C by a Nikon incubation warmer model ITC-32. The recording was performed from the bottom surface of the glass coverslip, so that a spatially two-dimensional picture in the base cross section of a flattened islet was observed.
Mathematical model
follows:
HereViis the transmembrane electric potential of theith cell in a linear
chain consisting ofN11 cells,Cis the membrane capacity, andtis time. The parametergcis the conductance of intercellular connections via gap
junctions, andIionis the total transmembrane current.Isis a slow current
responsible for the depolarization of the membrane and for generation of the AP’s active phase (plateau).ICaandIKare voltage-dependent inward
calcium and outward potassium currents, respectively, whose interaction is responsible for the fast oscillations during the active phase.IK(ATP)is the
ATP-regulated outward potassium current that is increased at low ATP/ glucose concentrations and decreased at high ATP/glucose concentrations, thus describing external control of the electrical activity by glucose me-tabolism.IK2Cais the outward calcium-activated potassium current, which
is thought to participate in termination of the plateau and repolarization, but does not contribute much in the particular model used here.ICRACis the
calcium-release-activated current, whose conductance is increased as the calcium stores in the endoplasmic reticulum (ER) empty.zWiis the vector of
the dynamic variables participating in expressions for various ionic cur-rents.nis a fast gating variable of activation of the potassium currentIK
and s is a slow gating variable of activation of the currentIs. Caiis the
intracellular calcium concentration activating the currentIK2Ca, and Caeris
the calcium concentration in the ER calcium stores on which the current
ICRACis dependent.
The equation for intracellular calcium dynamics is as follows:
dCai
dt 5f~aICa~V!2kcCai!1~Jout2Jin!. (3)
In this description the intracellular calcium concentration Caiis altered by
three processes: the calcium influx with the electric currentICa(ais a
factor to convert current to concentration changes), active pumping of calcium from the cellskcCai, and the calcium fluxesJoutandJinflowing out
of and into the calcium stores in the endoplasmic reticulum. Herefis the fraction of free intracellular calcium.
Other equations for the dynamic variables and full expressions for all ionic currents are presented in Appendix A. All parameters of the described model were set to the standard values (Sherman, 1997), which are also listed in Appendix A. For the coupling conductance we chose the value
gc5100 pS, which is consistent with the range of values found
experi-mentally by Perez-Armendariz et al. (1991) and used by Sherman and Rinzel (1991) to model synchronization phenomena in small clusters of stochastically firingb-cells.
The linear cluster of connected excitable cells, described by Eqs. 1, is expected to display collective behavior similar to that observed in reaction-diffusion systems (Zykov, 1987; Holden et al., 1991; Winslow et al., 1993). Indeed, by transition to a continuum limit Eqs. 1 can be rewritten as the following reaction-diffusion equation (see Appendix B) describing a con-tinuous excitable medium formed by connectedb-cells:
V
b-cell, andxis the spatial coordinate along the medium related to the cell numberiin Eqs. 1 asx5iDx, whereL5NDxis the length of the medium. By definition, the voltage V(t, x) 5 V(t, iDx) 5 Vi(t) and zW(t, x) 5
z
W(t,iDx)5zWi(t).
Under appropriate initial and boundary conditions, the latter system is expected to describe nonlinear wave propagation in a one-dimensional excitable medium formed by linearly connectedb-cells. Both the ordinary Eqs. 1 and the initial boundary value problem for the partial differential Eq. 4 can be integrated numerically, the forward finite difference scheme for the latter being similar to the spatially discrete system (Eqs. 1) (see Zykov, 1987). From here on, we will use the discrete Eqs. 1 for the numerical simulations and Eq. 4 for the qualitative estimations for wave solutions of the reaction-diffusion system.
RESULTS Experiments
In this section the experimental results concerning wave-like activity in the islets of Langerhans are described. First, published data giving evidence for wave propagation phe-nomena in the islets is considered, and then our own exper-iments carried out directly to show the wave propagation in cultured clusters ofb-cells are presented.
We shall first address the question whether electric/cal-cium oscillations in islets of Langerhans are synchronous or asynchronous. In several papers, oscillations in islets have been reported to be synchronous throughout the islet, mainly due to observations of the similar shape and fre-quency of the oscillations at different sites of the islet (Meda et al., 1984; Eddlestone et al., 1984; Santos et al., 1991; Valdeolmillos et al., 1996). However, none of these works stated that the oscillations occur simultaneously, i.e., with the same phase. On the other hand, all authors reported that by increasing the distance between two recorded cells, an increasing phase shift (equivalent to time delay) in their activity had been observed, for the distance of;100mm, with the time delay being usually 1–2 s. The same value of the time delayDt51 s was observed by Palti et al. (1996) who recorded electric potential oscillations in two cells 100 mm apart; only the latter authors concluded that electrical activity had propagated through the islet as an excitation wave with the velocityv5 100mm/s.
Although perfect synchrony was reported in many works on imaging the Ca21
dynamics in islets ofb-cells (Bergsten et al., 1994; Gilon and Henquin, 1995; Henquin et al., 1998), time resolution here generally exceeded several sec-onds, which was not enough to resolve small time delays. Paradoxically, Santos at al. (1991) and Gylfe et al. (1991) also reported no asynchrony, although when improving the time resolution by reducing sampling rate the authors ob-served phase lags of 1–2 s in oscillations at different regions of the islet. Only recently were calcium waves in the islets of Langerhans documented (Cao et al., 1997; Bertuzzi et al., 1996, 1999).
although almost no one has to date paid due attention to this fact. The main purpose of this section is to present direct evidence for wave propagation in pancreatic islets of Lang-erhans from experiments with cultured islets using fluores-cence video-microscopy methods. Let us proceed to the description of the experimental results.
In Fig. 1, typical patterns of activity recorded from a cultured islet of b-cells after glucose application is pre-sented. In the figure we can see a calcium wave, which initially emerges at the right edge of the islet and then travels leftward, ending at the right-bottom edge. Such waves have been observed in 85% of the approximately 100 conducted experiments (in the rest of the experiments islets exhibited uniform oscillations), the activity generally emerging at the islet periphery. The latter fact can be explained simply by the fact that glucose, which starts bursting oscillations in b-cells (see Atwater et al., 1978; Ashcroft and Rorsman, 1989; Hellman et al., 1994), first penetrates the islet from the external medium at the edges. Note that the picture shown in Fig. 1 is repeated in time periodically; we see in the experiments not single waves, but waves periodically emitted from the oscillating edge cells. Such periodic wave activity was observed during the whole time of the experiments (30 min).
Note also that the observed wave pattern is asymmetric; waves emerge not all along the periphery, but at distinct sites of the islet edge, which can be explained by non-uniform distribution of cell parameters in the islet, e.g., by the existence of cells with low glucose response threshold.
Heterogeneity of the glucose response threshold can also explain emergence of waves from the inner regions of the islet, observed in some experiments. Similar observation was made by Meda et al. (1984), who showed that oscilla-tions in the inner cells are leading with respect to those at the edge (however, here it could be due to the perifusion procedure).
We should point to the difference between the conditions of our experiments and those experiments reported in other studies. Namely, the external Ca21 concentration was 1.5 mM in our experiments, whereas in most studies of the oscillations in the islets of Langerhans the value 2.5 mM was used. It would appear that this lower Ca21 concentra-tion favors wave generaconcentra-tion in our experiments, as Palti et al. (1996) also used a lower external calcium concentration to observe wave-like activity. Anyway, the value 1.5 mM is closer to the physiological range of external Ca21 concen-trations than 2.5 mM, which can be used as an argument corroborating our conclusions. It is also important to note that this difference in the experimental conditions should be kept in mind when comparing our results with the results reported in the literature.
We measure the velocity of the observed waves by the time delayDtin the onset of activity at various locations of the islet, e.g., between the edge point where the wave initially started and the opposite edge point where it finally decayed (see Fig. 2A). In Fig. 2Btime courses of the ratio
R(see Materials and Methods) recorded for two such points are presented, clearly showing a time delay Dt 5 5 s
FIGURE 1 Spatiotemporal calcium dynamics in the base cross section of a cultured islet of Langerhans. Images are acquired from Fura-2 experiments at 380-nm wavelength excitation with a time lag of 1 s, which corresponds to the time internal between frames. First derivatives of the original images are shown to elucidate the temporal intensity changes. White color corresponds to high intercellular Ca21concentration. A calcium wave
between them. Taking into account that the distance L
between the recorded points is 220 mm, we get the wave propagation velocity in this experiment v 5 L/Dt 5 220 mm/5 s544mm/s. In other experiments the velocity values range from 30 to 100mm/s, the velocity increases with time, presumably reflecting an increase of the glucose concentra-tion inside the islets due to the glucose diffusion from the external solution (see below). These observations agree with the results of independent experiments with electric potential recordings at different sites of the islets (Eddle-stone et al., 1984; Palti et al., 1996).
Note that Ca21
signals are not likely to propagate through non-b-cells in the islets of Langerhans. Resolving the whole spatiotemporal picture we see wave propagating from re-gion 1 to rere-gion 2 in Fig. 2, the activity involving all cells in the cluster. It is known thatb-cells form up to 80% of the islets, so that there are very few non-b-cells inside; besides, the non-b-cells are not generally connected to each other. Hence, non-b-cells in the islet could not form a pathway in the islet capable of conducting the waves to the distance of
200mm. Second, the non-b-cells are known to exhibit totally asynchronous oscillations (Nadal et al., 1999), whereas in our experiments oscillations at the edge regions 1 and 2 have similar frequency and shape, and only a persistent phase shift between the oscillations is observed, corresponding to the time of wave propagation through the islet.
Thus, calcium activity in the islets of Langerhans is essentially asynchronous, appearing as periodic waves propagating from the islet edges. However, the mechanism of the propagation remains unclear. One can suppose such calcium waves to be connected to propagation of electric pulses, because 1) the use of simultaneous recordings of intracellular calcium and membrane potential shows that the calcium dynamics inb-cells is synchronized with the burst-ing electrical activity (Santos et al., 1991), and 2) electrical current flowing between cells through gap junctions repre-sent the most common way for wave propagation. Indeed, blocking the gap junction by application of 100 mM gly-cyrrhetinic acid (GA) almost always totally eliminates wave propagation in our experiments (Skyggebjerg, 1999), indi-cating the importance of the electrical coupling between the b-cells; however, the latter result should be treated care-fully, because GA is not only a specific inhibitor of gap junctions, but also affects the activity of single cells as well (Jonkers et al., 1999). Thus we carry out numerical simu-lations of electrical and calcium activity in a cluster of coupledb-cells, reported in the next section.
Numerical simulations
Before describing the simulations, note first that although the experimental patterns presented in the previous section are two-dimensional, we use a one-dimensional model, be-cause description of a plane wave in two dimensions coin-cides with that of a one-dimensional propagating pulse (see e.g., Scott, 1999). We realize that experimental wave fronts are not actually planes, but they do not have a unique curvature that can be accounted for in the model. The fronts usually have both concave and convex regions and on average can be approximately considered as planes. Be-sides, we simulate only single waves instead of repetitive waves observed in the experiments, assuming that the pe-riodic waves are identical to each other.
As expected, numerical simulations of the model (Eqs. 1–3) showed propagation of nonlinear waves through the b-cell cluster (Fig. 3). In Fig. 3,AandB, spatial profiles of a propagating AP and the corresponding profiles of calcium concentration Cai are presented, respectively. The latter
shows wave-like activity, calcium waves being due to the calcium influx with the currentICa during the AP plateau.
Such waves are analogous to those in the heart, where AP propagation also involves Ca21
influx into cardiac cells. These cannot propagate independently of electrical pulses, in contrast to calcium waves observed in various types of cells, where propagation is defined only by processes of FIGURE 2 Time delay in activity of two edge regions of a cultured islet
intracellular calcium/inositol-3-phosphate diffusion and ac-tivated calcium efflux off ER calcium stores (Dupont and Goldbeter, 1994; Clapham, 1995). In our opinion, calcium waves reported in the previous section should be waves of the first type, i.e., connected to AP propagation, and not purely calcium waves, because intracellular calcium
dynamics inb-cells are known to be synchronized with the electric potential changes (Santos et al., 1991).
One way to compare waves observed experimentally with those obtained in numerical simulations is to measure their respective propagation velocities. If the velocityvof elec-tric/calcium waves in simulations demonstrates values close to the experimental range v 5 30 –100 mm/s, this would suggest that calcium waves seen in experiments are, actu-ally, due to Ca21
influx reflecting AP propagation. Before describing the wave velocity measurements, note that in Fig. 3 we can observe two kinds of waves, propa-gation of a distinct nonlinear wave front and complex dy-namics of low-amplitude phase waves (see Holden et al., 1991) behind it, reflecting fast oscillations at the pulse plateau. Here we shall concentrate on the wave front prop-agation, resolvable in real experiments.
As in the experiments, we measure here the front velocity
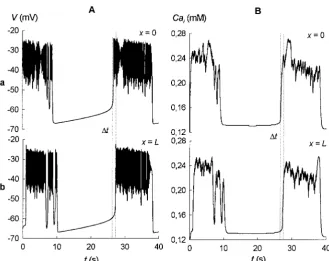
vby the time delay between emergence of electric/calcium activity at opposite sides of the cluster ofb-cells:v5L/Dt, whereLis the size of the cluster and Dtis the time delay (see Fig. 4). At the standard set of the model parameter values used by Sherman (1997) we obtain the time delay
Dt51 s in activity between the spatial pointsx50 andx5
L (cells with numbers i 5 0 and i 5 N) in the cluster of length L 5 200 mm, giving the velocity value v 5 200 mm/s. This value is greater than the experimentally ob-served values of 30 –100mm/s, which can be explained as follows.
Above it was indicated that the external control of the electrical activity of b-cells by glucose metabolism is ac-FIGURE 3 Wave propagation in the model of coupled b-cells (Eqs.
1–3). Propagating AP with complex phase dynamics at the plateau (A) evokes calcium influx into the cells appearing as a propagating calcium wave (B). Spatial profiles of the membrane electric potential iV (A) and intracellular calcium concentration Cai(B) at subsequent time momentst5
100, 200, . . . 5000 ms are shown.g#K(ATP)5140 pS andgc5100 pS.
FIGURE 4 Time delays in activity of two edge cells of a linear chain of coupledb-cells (described by Eqs. 1–3). Time courses of the membrane potentialV(A) and the intracel-lular calcium concentration Cai(B) are
pre-sented. Top figures correspond to the first cell in the chain ofLlength (x50); bottom figures correspond to the last cell (x5L). The time delayDt51 s in activity of the cells is indicated by vertical dotted lines.
g#K(ATP)5120 pS,gc5100 pS, andL5
counted for in the model by including the currentIK(ATP)5
g#K(ATP)(V2VK);g#K(ATP)is the conductance of the current
andVKis the potassium equilibrium potential. The
conduc-tance g#K(ATP) is high in the absence of glucose and
de-creases when the glucose is added and ATP concentration is raised due to the glucose metabolism (Detimary et al., 1998). Sherman (1997) used for this conductance the value
gK(ATP)5120 pS providing burst generation by the model
and, thus, corresponding to the situation when glucose is present. It is known, however, that glucose penetrates into the islets of Langerhans slowly, initially being high only at the edge of the islet (Bertram and Pernarowski, 1998). Thus, inner regions of the islet are not reached by glucose for a long time and here the conductance g#K(ATP) should be
relatively high. If we increase the value ofg#K(ATP)in our
simulations from the standard value 120 pS to the value 140 pS we observe that the dynamics of the modeledb-cells is no longer oscillatory but becomes excitable; all cells have a steady resting state but can be excited and generate single bursts in response to external stimuli (e.g., current injec-tion). Such dynamics should be natural forb-cells located inside the islets of Langerhans and not reached by glucose. If we now simulate wave propagation atg#K(ATP)5 140
pS, we observe that the propagation velocity is decreased to the valuev590mm/s, which is already within the exper-imental range. A further increase of g#K(ATP) to 150 pS
decreases the propagation velocity down to 20 mm/s. We can plot the dependence of the velocity on the parameter
g#K(ATP) and see most values giving velocities comparable
with the experimental ones (Fig. 5 A). Thus, coincidence between propagation velocities of calcium waves, observed experimentally, and simulated APs supports our view that waves in the islets of Langerhans are electric in nature.
Note that the propagation velocity in the reaction-diffu-sion systems (Eq. 4) should depend on the diffureaction-diffu-sion coef-ficient D 5 gcDx
2
/C. Thus, another parameter essentially influencing the value of the velocity in Eqs. 1 is the cou-pling conductance gc. Dependence of the velocity on this
parameter is known and can be analytically expressed as
v5const1=D5const1=gc(see e.g., Frank-Kamenetsky,
1967), so that knowing the velocity v(gc
(1)) for the chosen
value of gc (1)
we can calculate analytically the velocity for any other valuegc(2)asv(gc(2))5 =gc(2)/gc(1)v(gc(1)). In Fig. 5
several curves corresponding to various values of gc are
presented, illustrating that a decrease of gc leads to an
associated decrease of the velocityv. For instance, we can keep the parameterg#K(ATP)at the standard value 120 pS and
decrease the wave propagation velocity to the value of 90 mm/s just by decreasing the gap junction conductance from 100 to 20 pS. Note here that glucose is known to influence the gap junction conductance; in particular, the conductance is lower in the absence of glucose (Eddlestone et al., 1984; Michaels et al., 1987; Gylfe et al., 1991), justifying a decrease of the parametergcin our numerical simulations.
The answer to the question why increasing of the param-eterg#K(ATP)leads to decreasing wave propagation velocity
is not so obvious and is discussed in the next section.
Wave velocity formula
In this section, we present an analytical expression allowing estimation of the velocity of stationary moving APs, using a kinetic function of the reaction-diffusion equation describ-ing its propagatdescrib-ing wave front. Before proceeddescrib-ing to the implementation of the expression for the wave velocity, note that the reaction-diffusion system (Eqs. 2– 4) is too complicated to be used for analytical estimations; thus, we need to make some simplification. Following Sherman (1997), we will exclude the two additive currentsIK2Caand
ICRAC, which depend on the calcium concentrations Caiand
Caer, respectively, from the total ionic current Iion in the
expression Eq. 2. As the result of such simplification,Iionis
no longer dependent on the variables Caiand Caer, and the
vector of kinetic variables zW takes the form of a two-component vectorzW5(n,s). The reaction-diffusion system (Eqs. 2– 4) hereby becomes a generic three-variable model (the variables areV,n, ands, the equations for Caiand Caer
FIGURE 5 Dependencies of the wave propagation velocity v on the parametersg#K(ATP)andgc, obtained in numerical simulations of the model
(Eqs. 1–3) (A) and analytically using the formula (Eq. 7) (B).gc5100, 75,
being decoupled), which is representative of a great variety ofb-cell models developed since the original work of Chay and Keizer (1983).
As numerical simulations show, the simplifications made do not greatly affect the velocity of the wave propagation described by Eqs. 2– 4. This is not surprising because the currents neglected are switched on after the wave front is generated. Thus, we shall use the simplified three-variable model for the analytical estimation of the propagation ve-locity of waves described by the full system (Eqs. 2– 4).
Now we proceed to qualitative reasoning. It is clear that the velocity of a nonlinear pulse propagation is defined by the velocity of its front. Thus, for measuring the pulse velocity we can reduce the description of the pulse to the description of its front only. Such reduction is based on the fact that the variablenis fast and the variablesis slow in comparison with the rate of the electric potential changes at the wave front. Although the electric potentialVat the wave front is changing, the value of the variablenis close, at each moment of time, to the stationary valuen`(V), whereas the value of the variable sremains close to the initial resting values0. This fact allows great simplification of the
math-ematical description of the wave-front motion. At the time scale of the front the variablesnandsin Eqs. 2– 4 can be replaced withn`(V) ands0, respectively, and Eq. 4 takes the
form of a scalar nonlinear diffusion equation:
V
t 5D
2V
x21F~V!; (5)
F~V!52$g#Cam`~V!~V2VCa!1g#Kn`~V!~V2VK!
1g#ss0~V2VK!1g#K(ATP)~V2VK!%/C, (6)
which describes the dynamics of the front of the AP asymp-totically. Expressions for the functionsm`(V) andn`(V) are presented in Appendix A. Note that the procedure of setting some kinetic variables to their stationary values is not unusual and has been successfully applied for qualitative estimations of dynamic properties of the nerve axon (Scott, 1975) and b-cell (Chay and Keizer, 1983; Rinzel, 1985; Sherman, 1997) models.
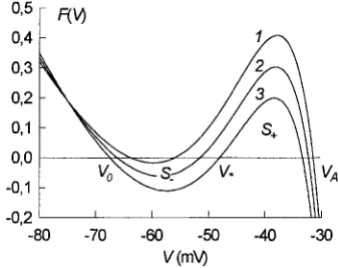
The basic properties of Eq. 5 are well known (see, e.g., Scott, 1999). They are governed by the kinetic function
F(V), which in our case depends on the parameterg#K(ATP).
A family of the functional dependencies F(V) plotted for several values of the parameterg#K(ATP)is presented in Fig.
6. It can be seen that such functions have the form of N-shaped curves with three zero-crossings, typical for bi-stable excitable media with two bi-stable steady states. In our case these states are defined by coordinates of the left (V0)
and the right (VA) zero-crossings of the kinetic function
F(V), respectively, the valueV0corresponding to the resting
potential ofb-cells and the valueVAcorresponding to the
maximum of the electric potential at the wave front. The stateV* corresponding to the third zero-crossing is unstable
and can be considered as a threshold. In the framework of the reduced description (Eqs. 5 and 6), stationary propaga-tion of APs along a one-dimensional chain of b-cells pre-sents a depolarization front, switching the cells from the resting state V0 to the excited one with potentialVA.
De-pendence of the potential Von xandt at the front propa-gating along thexaxis with a constant velocityvis given by the solutionV(x2vt) of Eq. 5, the form of this solution and the velocity valuevbeing uniquely defined by the kinetic functionF(V). Thus, shift of the function by increasing the parameterg#K(ATP), seen in Fig. 6, should change the
prop-agation velocity in a distinct way.
To support the latter statement, we should know the analytical expression connecting the propagation velocityv
with the functionF(V). The exact expressions for the ve-locity and the front profileV(x 2 vt) are known only for some special nonlinear functions F(V) (see Scott, 1975, 1999; Tyson and Keener, 1988). However, using local vari-ational principles developed recently for a broad class of nonlinear dissipative systems (see Mornev, 1998) allows us to obtain approximated expressions for the wave velocityv
for any given N-shaped function F(V). The expression for the front propagation velocity is as follows (Mornev, 1998):
v51.5
Î
D 2^P&1DSDS
~VA2V0!
, (7)
where^P&andDSare defined by the formulas
^P&52 1
VA2V0
E
V0VA
E
V0V
F~V9!dV9dV
and (8)
DS5
E
V0
VA
F~V!dV.
FIGURE 6 Kinetic function of Eq. 4. Graphs of the functionF(V) are presented for different values of the parameterg#K(ATP).g#K(ATP)5120, 135,
and 150 pS (curves 1, 2, and 3, respectively). S2( andS1are the areas
Note that to achieve better correspondence with the results from the numerical simulations a factor 1.5 is introduced in Eq. 7, which is absent in the original paper (Mornev, 1998). Introduction of this factor is not artificial because Eq. 7 was obtained using a variational method giving an approxima-tion with an accuracy up to a constant factor of order unity. The parameterDSin Eqs. 7 and 8 has a simple geometrical meaning. From Eq. 8 we see that it equals the difference
DS5S12S2, (9)
where S2 5 u*V0 V*
F(V)dVu 5 2(*V 0 V*
F(V)dV and S1 5
*V 0
VAF(V)dVare the absolute values of the areas bounded in Fig. 6 by the curve F(V) and the segments (V0, V*) and
(V*,VA), respectively.
The following remark allows us to get an intuitive un-derstanding of the interrelation between the velocityvand the conductance g#K(ATP). If the kinetic function F(V) has
such a form thatS1.S2(see curve 1 in Fig. 6), then the difference (Eq. 9) is positive, and the solution V(x 2 vt) describes a wave front propagating along the spatialxaxis with finite positive velocityv. Now, if the function F(V), presented in Fig. 6 by curve 1, is shifted down to more negative values (see curves 1–3 in Fig. 6), then the valueS1 will be decreased, and the valueS2will be increased, both diminishing the differenceDS5S12S2. The valueDS5 0 corresponds to blocking the wave-front propagation be-cause in this case the velocity vvanishes. Decreasing DS
down to zero leads to an associated decrease in the front velocityvaccording to Eq. 7. Finally, note that the down-shift of the functionF(V) (see Fig. 6), leading to a decrease of the valueDSand the wave-front velocityv, results from increasing the parameterg#K(ATP). Indeed, such an operation
leads to an increase of the positive term IK(ATP) 5
g#K(ATP)(V2VK) participating in the expression Eq. 6 with
the minus sign (of course, the current IK(ATP) is positive
because we consider only the rangeV.V0.VK). Besides,
the downshift of theF(V) leads to an increase of the value
VA 2 V0 (Fig. 6), which also decreases the propagation
velocity according to Eq. 7. That explains the dependence of the velocityv, defined by Eq. 7, on the parameterg#K(ATP),
answering the question stated at the end of the previous section.
Note that the expression Eq. 7 also accounts for the known dependence of the propagation velocity on=D' =gc. In Fig. 5 B several curves are plotted, showing the
dependencies of the velocity v on the parameter g#K(ATP),
calculated numerically with the formula Eq. 7 for different values ofgc. One can see that the curves are quantitatively
similar to that calculated in our simulations and shown in Fig. 5A.
Both parameters considered here, which influence the wave propagation velocity v, are known to be naturally dependent on glucose. In particular, at low glucose concen-tration the value ofgcis decreased (Michaels et al., 1987;
Gylfe et al., 1991) and the value of g#K(ATP) is increased
(Detimary et al., 1998), both factors decreasing the wave velocity. This influence of glucose on the wave velocities (or time delays) observed in the islets of Langerhans has long been known. At low glucose concentration inside the islets, right after the glucose administration, the velocity is low (the time delay is several seconds), whereas long-lasting equilibration with glucose increases the velocity (Eddlestone et al., 1984; Palti et al., 1996). However, the exact character of the velocity dependence on glucose is not established and should be the subject for further experimental research.
DISCUSSION
The main purpose of this paper has been to point out the possibility of wave propagation in pancreatic islets of Lang-erhans. Experiments with fluorescent monitoring of calcium dynamics in the islets clearly show such wave propagation. Additional numerical simulations of the model describing a cluster of electrically coupled cells support our view that the experimentally observed calcium waves are due to the elec-tric pulse propagation through the cluster. The view is also supported by independent experimental results (Eddlestone et al., 1984; Santos et al., 1991; Palti et al., 1996; Cao et al., 1997; Bertuzzi et al., 1999).
Propagation mechanisms
Electrical coupling has long been considered as the most likely mechanism of coordination of the b-cells in the pancreatic islets (Meissner, 1976; Sherman and Rinzel, 1991; Valdeolmillos et al., 1996). It was shown, however, that the electrical and calcium signals cannot be transmitted between the cells by passive diffusion (Eddlestone et al., 1984; Meda et al., 1986). Local injections of external cur-rents in a silent islet had decayed within a few cell diameters (;30mm), whereas synchrony in frequency had been dem-onstrated between bursting cells up to 400mm apart. In this situation, amplification and transmission of electric signals between neighboring cells by nonlinear waves seems to be a plausible mechanism.
However, the mechanism of wave propagation is not likely to be unique. On one hand, there is strong evidence that electrical and calcium oscillations in the islets of Lang-erhans are synchronized to each other (Santos et al., 1991; Henquin et al., 1998), supporting our point of view that calcium waves are due to the Ca21
influx upon AP propa-gation through the islet. Upon such propapropa-gation electrical current is transmitted between the cells through conductive gap junctions.
pathways for wave propagation exist in the islets: an AP-propagation-based mechanism, dependent on the presence of gap junctions betweenb-cells and another one based on the spread of some diffusible intercellular mediators. The most likely candidates for the mediators are Ca21itself and inositol-3-phosphate (IP3).
Propagation of purely calcium waves, based on the dif-fusion of Ca21and IP3and activated release of Ca
21 from intracellular stores is well known for various cell types (see Dupont and Goldbeter, 1994; Clapham, 1995). Such a mechanism was likely observed by Cao et al. (1997) who studied calcium wave propagation in islets of Langerhans with defective gap junctions. They showed that inhibiting the IP3effects on intracellular stores (either by blocking the
IP3receptor or by depleting intracellular calcium stores by
addition of thapsigargin) stopped the propagation. The au-thors concluded that the calcium waves in their experiment propagated through the cells by an IP3-dependent
mecha-nism, whereas they were transmitted between the cells by ATP secretion acting on purinergic receptors. Interestingly, when b-cells were transfected with the gap junction protein con-nexin43 (and, thus, the gap junction connections were re-stored), AP-dependent, but IP3-independent waves could now be observed. It is likely that both types of waves, electrically induced and purely calcium, can emerge in the islet, likewise in the heart where both AP-connected (see, e.g., Zipes and Jalife, 1994) and calcium waves (Dupont and Goldbeter, 1994) are common. We have investigated only one possibility, whereas another is a matter for future research.
There are indications for the presence of a third mecha-nism. To show calcium wave propagation in uncoupled b-cells, Bertuzzi et al. (1999) used glycyrrhetinic acid as the gap junction inhibitor. This resulted in disappearance of fast (presumably AP-mediated) waves, propagating with the ve-locity of;50mm/s. Instead, slow waves emerged propa-gating at 10mm/s. The latter waves are unlikely to be IP3
driven, because addition of thapsigargin did not stop the propagation. Thus, another mechanism in addition to those indicated above should be involved here.
Another mediator of the depolarization spread in excitable tissues can be extracellular K1ions (see Tuckwell and Miura, 1978; Spira et al., 1984). The corresponding mechanism is the following. If one cell in the tissue is excited and, hence, depolarized, the repolarizing potassium current starts to flow out of the cells leading to accumulation of K1 ions in the extracellular space. As a result, the potassium equilibrium potential of neighboring cells is decreased, which initiates depolarization of these cells and, in turn, outflow of K1ions into the extracellular space. Note that extracellular potassium diffusion has already been considered as a mechanism for coordination ofb-cells without gap junction coupling (Perez-Armendariz et al., 1985; Stokes and Rinzel, 1993).
In summary, more than one mechanism for wave propa-gation in the islets of Langerhans can and does probably exist. A variety of such mechanisms shows only that waves in the
islets of Langerhans are not unusual and should be accounted for to understand the coordination mechanisms in the islets.
Glucose effects
Because glucose is the most important initiator of the burst-ing activity in the islets of Langerhans, it should influence the wave propagation regimes as well. Indeed, the basic assumption in our simulations of the wave velocity was that the glucose concentration is low inside the islet. The as-sumption is supported by simulation results of Bertram and Pernarowski (1998), who studied a realistic model of glu-cose diffusion into the islets of Langerhans. Their main result is the following: it can take tens of minutes for glucose to diffuse from the external media into the inner central regions of the islet and start electric activity here. Such a slow rate of glucose penetration is explained by the fact that the glucose does not simply diffuse into the islet but also is consumed by those islet cells that are close to the edge.
In several experimental works heterogeneity of glucose distribution in the islets was also shown (see, e.g., Pipeleers et al., 1994). In contrast, Bennett et al. (1996) have shown that glucose-induced NAD(P)H fluorescence signals equil-ibrate in the islet in less than 1 min. However, these results do not contradict the results of simulations of the glucose diffusion model by Bertram and Pernarowski (1998). Re-sults reported in the work (Bennett et al., 1996; see Fig. 3) concern small islets of radius 60mm; besides, the NAD(P)H fluorescence is measured not at the islet center but at the optical cross section 40mm inside the islet. Assuming that most the dramatic changes of the glucose concentration occur close to the edge (within the region of ;50 mm depth), it is not surprising that Bennett et al. (1996) ob-served a fast NAD(P)H glucose response in this region. In fact, Bertram and Pernarowski (1998) have shown that their model applied for the same geometry (islet radius 60mm, the glucose concentration measured 40mm from the edge) allows simulation of the experiments on NAD(P)H fluores-cence: within such geometry the glucose concentration reaches the 5-mm threshold for the metabolism activation in the islet in less than 1 min. However, if one preserves values for all the model parameters, increasing only the islet radius up to 200 mm, the glucose is not equilibrated in the islet before 10 min. Note also that Bennett et al. (1996) studied glucose diffusion into intact islets of Langerhans, where the substance can diffuse not only in the extracellular space but through the blood vessels as well.
and hence a higher value ofg#K(ATP)and comparatively low
wave propagation velocity. The results of Bertram and Pernarowski therefore not only support our assumption of a low glucose concentration inside the islets of Langerhans but also show that in response to an increase in extracellular glucose the bursting activity of theb-cells in vitro can start only in peripheral regions, whereas the inner regions will stay silent for a long time. During this time, a mechanism for transmission of signals from the external medium into the center of the islets, faster than glucose diffusion, is needed. Wave propagation seems to be a fair candidate.
Oscillations or waves?
In most works, both experimental and theoretical, oscilla-tions in the islets of Langerhans are reported to be synchro-nous. Our results on the regimes of wave propagation in the islet do not refute this conclusion, indicating only the pos-sibility of alternative behavior. Here we discuss conditions defining the choice between the oscillatory and the wave dynamics in the islets of Langerhans.
The choice between conditions for synchronous oscilla-tions and excitation wave propagation could be defined by the degree of glucose effect on the islet. Islets with all cells equally effected by high glucose concentration should ex-hibit almost synchronous oscillations. In the islets with non-uniform glucose distribution, waves are likely to be emitted from bursting cells to the silent, but excitable, regions. Thus, in vivo, when the islets are penetrated by blood vessels supplying them with glucose, synchronous oscillations should be dominant, whereas in vitro, in partic-ular upon static incubation, when glucose is diffusing slowly into the islet from the edges, waves should start from the islet periphery and propagate inside. However, after long-term incubation with glucose, oscillations in the islets in vitro can also become synchronous (see Eddlestone et al., 1984), when glucose is equilibrated inside the islets.
Note also that there is a discrepancy in using the term synchronous in most experimental works: oscillations at dif-ferent sites of the islets are reported as synchronous if they have the same frequency, even if they have slightly different phases (e.g., if there is a time lag of;1 s). From this point of view, periodic waves propagating through the islet in our study also provide a synchronous regime, because oscillation at each of the two sites of the islet have the same frequency, corre-sponding to the frequency of wave emission from the edge. Only by resolving the whole spatiotemporal picture (which is not done in most of the experiments) can one see that the activity in the islet is, actually, asynchronous, which is due to wave propagation through the islet.
Speaking about the numerical simulations, we should stress that generally the dynamics of activity in the islets of Langerhans is not likely to be excitable rather than oscilla-tory, as observed in some of our simulations. Once again, we indicate only the possibility of the existence of the
excitable regime along with the oscillatory one, the differ-ence between them being defined by the absdiffer-ence/presdiffer-ence of the stimulating glucose concentration. In the simulations we observed single excitation waves assuming that the glucose concentration is low throughout the islet. If we account for the glucose effects by connecting our model with the glucose diffusion model of Bertram and Per-narowski (1998), then the non-uniform glucose distribution in the islet provides a natural way of emergence of periodic waves from the edges, where the glucose penetrates the islet. Hence, the cells inside the islet are still excitable like in our present simulations, but the whole islet oscillates with the frequency of the wave emission from the edges (the results hold for the three-dimensional geometry as well). These results will be published elsewhere.
Note that our present model is very similar to that used by Sherman and Rinzel (1991) for study of the noise-induced asynchrony in the islets. The major difference is how the activity was started. In that work (Sherman and Rinzel, 1991), bursting oscillations in b-cells were initiated by intrinsic noise, resulting in all the cells starting the oscilla-tory activity. In our work, we set the initial conditions in all the inner cells, corresponding to the resting steady state, and applied an external perturbation (thus, simulating the acti-vating glucose effect) at the edge of the islet. This resulted in initiation of the bursting activity at the islet periphery only; afterwards the activity propagated into the inner re-gion forming a wave. If we consider the model of Sherman and Rinzel (1991) with the initial conditions set similarly to that in our study, the models can also exhibit wave propa-gation regimes. Note that wave-like activity was actually observed by the authors of the cited work.
In summary, there is no advantage in interpretation of the islets as excitable rather than oscillatory. Both wave prop-agation and oscillatory regimes can be expected in the islets of Langerhans; moreover, from our point of view the oscil-latory regime should be dominant, occurring in most of the natural situations.
Wave velocity
We can estimate wave velocities observed in independent experiments within the islets Langerhans by dividing the distance between regions from which the activity was re-corded to the observed time delays. The works on the electric potential recordings give either 25 mm/s (Eddle-stone et al., 1984) or 100 mm/s (Palti et al., 1996); in experiments on calcium imaging, the velocities 60 –120 mm/s (Santos et al., 1991) or 10 –50mm/s (Bertuzzi et al., 1999) were observed. The results are in perfect agreement with our own experimental estimates of the velocity: 30 – 100mm/s in various experiments.
particular, as the numerical simulations reveal, wave prop-agation with the velocities comparable to experimental val-ues can occur provided the glucose/ATP concentration is low inside the islet and, hence,IK(ATP)current is activated.
This repolarizing current drives the transmembrane poten-tial to its resting value, decreases excitability of theb-cells, therefore decreasing the wave propagation velocity. The latter statement can be formulated more rigorously: decreas-ing the excitability in terms of a reaction-diffusion model means downshift of its kinetic function (Eq. 6), resulting in a decrease of the integral (Eq. 8), which, in turn, leads to a decrease of the propagation velocity according to the for-mula Eq. 7. Thus, to decrease the velocity in the sifor-mulations we increased the conductanceg#K(ATP)(Eq. 6).
Note that along with the parameter g#K(ATP) the wave
velocity is dependent on several other parameters, which can be seen from Eq. 6. Although the model parameters are fixed, the initial values0is chosen arbitrarily and can affect
the wave velocity. However, changes of the velocity due to variation ofs0can always be compensated by corresponding
variation of the parameterg#K(ATP), which also follows from
Eq. 6, and can be confirmed by numerical simulations. In particular, if we change s0in Eq. 6 to the new value s0
(1),
we can always choose the new valuegK(ATP)
(1) 5
gK(ATP)1
g#s(s0 2 s0
(1)), such that the function Eq. 6 is preserved
unchanged. Now, to get the velocity dependence on the K-ATP conductance for the new initial values0
(1), we should
the shift will constitute 40 pS; the latter value should be added to the values at the abscissa axis in Fig. 5. Thus, we get a new dependence of the velocity on the K-ATP conductance for the new initial value ofs. It does not differ from the old one in any respect, except of the scale at the abscissa axis.
We can also sets0to a steady-state value of the variable
sfor the given value ofg#K(ATP):s05s`(V0;g#K(ATP)). In this
case, if we preserve all the parameter values as indicated in Appendix A, we can get, e.g., forV05 267 mV,g#K(ATP)5
185 pS, the velocityvof ;70mm/s.
The more realistic method of simulation is to include description of the non-uniform glucose dynamics (Bertram and Pernarowski, 1998) in the model, providing a natural way of emergence of waves emitted periodically from the islet edges. In this case we should introduce the dependence ofg#K(ATP)on the glucose concentration in order to connect
the electrical and the glucose models. Such dependence can be chosen quite realistically and at the same time appropri-ate to provide acceptable wave velocities for the repetitive waves. These results will be published elsewhere.
Note that the variableshas no obvious physical meaning, and it is not clear what initial value should be used for it and to what physiological situation it would correspond. Be-cause the changes ofs0can be compensated by appropriate
changes ofg#K(ATP), it seems reasonable to fix s0at some
value and vary the physical parameterg#K(ATP).
In summary, we realize that wave velocities provided by the model generally tend to be higher than that observed experimentally, but we try to find ways of controlling the velocity by the model parameters having physical and physi-ological meaning. Such parameters areg#K(ATP)andgc, and we
demonstrate the way in which they can decrease the velocity. Of course, the velocity can be altered by some other parame-ters as well, and we should keep this possibility in mind.
Perspectives
In conclusion, we outline the possible physiological role of wave propagation in the islets of Langerhans and perspec-tives of their investigation.
Islets of Langerhans are known to be heterogeneous in sense of theb-cells having various glucose-response thresh-olds (Pipeleers et al., 1994; Gilon and Henquin, 1995). Therefore, after raising the glucose level, all the cells cannot start bursting activity and insulin secretion at the same time. Thus, the possible physiological role of waves in the living islets is obvious: at the initial stages of theb-cell response to glucose stimulation, such waves can provide an optimal way for transmission of electrical/calcium signals for insu-lin secretion from the bursting cells to the silent ones, initiating the secretion process in regions lacking glucose and not yet active. Note that it was proposed a long time ago that the overall activity in the islets can be governed by some pacemaker cells located close to blood capillaries supplying the islets with glucose (Meissner, 1976). In this context it can also be speculated that defects of gap junc-tions are known to lead to a decrease in insulin release by islets of Langerhans (Pipeleers et al., 1982; Vozzi et al., 1995), but we cannot be sure that this is due to blocking of electrical signals inside the islets and not to any other reason, e.g., lack of synchronization of stochastic activity in coupled cells (Sherman and Rinzel, 1991).
In summary, our results reveal the existence and a possible mechanism of wave propagation emerging upon glucose treat-ment of the islets of Langerhans during in vitro experitreat-ments. Whether or not the same behavior takes place in vivo is arguable, because glucose in this case can be transported into the islets not only by simple diffusion, but also through blood vessels penetrating the islets. However, our results show that the mechanism supporting wave propagation exists in the islets of Langerhans, capable of activating silentb-cells that cannot immediately be reached by glucose. Thus, we point to the existence of a previously unrecognized mechanism for signal transmission in the islets, which can also play a role in initia-tion of the insulin secreinitia-tion process.
APPENDIX A
Given here is a full description of all ionic currents and fluxes used in Eqs. 1–3 together with the parameter values.
Ionic currents
Transition to the continuous model
Before performing the transition to the continuum limit of the spatially discrete Eqs. 1, note that the coupling conductivitygcmay be related to the
diffusion coefficientDby the expressionD5gcDx
2/C, whereDxis the
characteristic spatial dimension, i.e., the diameter of ab-cell. To proceed to the continuum limit, we letVi(t) 5V(t, iDx) 5V(t,x) in the first
equation in Eqs. 1, so that, e.g.,Vi11(t)5V(t, x1 Dx) 5V(t,x) 1
(V/x)Dx1(2V/x2)Dx21. . . . Substituting the respective expressions
forVi21,Vi, andVi11and the valuegc/C5D/Dx
2into the first equation of
Eqs. 1 and taking the limitDx30, we convert from the discrete operator
D(Vi111Vi2122Vi)/Dx
2to the Laplacian operatorD2V/x2describing
the diffusion phenomena. Thus, in the continuum limit we obtain the reaction-diffusion Eq. 4.
To solve Eq. 4 we must set appropriate boundary conditions. A natural choice is the zero-flux conditions:
V~t, 0!/x5 V~t,L!/x50,
which are similar to the latter two equations in Eqs. 1. For example, in the discrete situation at the boundaryx50 corresponding to the cell with numberi50, we can formally rewrite the first of Eqs. 1 asCdV0/dt5
gc(V211V122V0)2Iion, where, by definition,V21(t)5V(t,2Dx)5
V(t, 0)2V(0,t)/xDx1. . . . The conditionV(t, 0)/x50 gives us
V21(t)5V(t, 0)5V0(t), which in turn transforms to the equation forV0
in the system of Eqs. 1.
The initial conditions for the wave propagation should be set in Eqs. 1 and 4 as a step of electric potential near one of the boundaries (see, e.g., Aslanidi and Mornev, 1997):V0(0)5V1(0)5 240 mV,Vi(0)5V05 265
mV for 2#i#N; Cai(0)50.1mM, Caer(0)510mM,n(0)50.0001,
s(0)5s050.4 for all cells (if it is not particularly stated in the text,V05 265 mV,s050.4). In the numerical simulations we used the forward
explicit method with the spatial stepDx510mm (which corresponds to the size of ab-cell) and the time stepDt50.05 ms.
Science, the Danish Research Academy and DTU. We thank the Danish Research Council for financial support through contract 9313393 (super-computing projects).
REFERENCES
Andreu, E., B. Soria, and J. V. Sanchez-Andres. 1997. Oscillation of gap junction electrical coupling in the mouse pancreatic islets of Langerhans.
J. Physiol. (Lond.).498:753–761.
Arkhammar, P., B. R. Terry, H. Kofod, and O. Thastrup. 1998. Pancreatic islets cultured on extracellular matrix: an excellent preparation for microfluorometry.Methods Cell Sci.18:1–14.
Ashcroft, F. M., and P. Rorsman. 1989. Electrophysiology of the pancreatic
b-cells.Prog. Biophys. Mol. Biol.54:87–143.
Aslanidi, O. V., and O. V. Mornev. 1997. Can colliding nerve pulses be reflected?JETP Lett.65:579 –585.
Atwater, I., B. Ribalet, and E. Rojas. 1978. Cyclic changes in potential and resistance of the b-cell membrane induced by glucose in islets of Langerhans from mouse.J. Physiol. (Lond.).278:117–139.
Bennett, B. D., T. L. Jetton, G. T. Ying, M. A. Magnuson, and D. W. Piston. 1996. Quantitative subcellular imaging of glucose metabolism within intact pancreatic islets.J. Biol. Chem.271:3647–3651. Bergsten, P., E. Grapengiesser, E. Gylfe, M. A. Tengholm, and B.
Hell-man. 1994. Synchronous oscillations of cytoplasmic Ca21and insulin
release in glucose-stimulated pancreatic islets. J. Biol. Chem. 269: 8749 – 8753.
Bertram, R., and M. Pernarowski. 1998. Glucose diffusion in pancreatic islets of Langerhans.Biophys. J.74:1722–1731.
Bertuzzi, F., A. M. Davalli, R. Nano, C. Socci, F. Codazzi, R. Fesce, V. Di Carlo, G. Pozza, and F. Grohovaz. 1999. Mechanisms of coordination of Ca21signals in pancreatic islet cells.Diabetes.. 48:1971–1978.
Bertuzzi, F., D. Zacchetti, C. Berra, C. Socci, G. Pozza, A. E. Pontiroli, and F. Grohovaz. 1996. Intercellular Ca21waves sustain coordinate insulin
secretion in pig islets of Langerhans.FEBS Lett. 379:21–25.
Bonke, F. J., C. J. Kirhhof, M. A. Allessie, and A. L. Wit. 1987. Impulse propagation from the SA-node to the ventricles. Experimentia. 43: 1044 –1049.
Bonner-Weir, S., D. Deery, J. L. Leahy, and G. C. Weir. 1989. Compen-satory growth of pancreaticb-cells in adult rats after short-term glucose infusion.Diabetes. 38:49 –53.
Cao, D., G. Lin, E. M. Westphale, E. C. Beyer, and T. H. Steinberg. 1997. Mechanisms for the coordination of intercellular calcium signaling in insulin-secreting cells.J. Cell Sci.110:497–504.
Chay, T. R., and Keizer J. 1983. Minimal model for membrane oscillations in the pancreaticb-cells.Biophys. J.42:181–190.
Clapham, D. E. 1995. Calcium signaling. Cell 80:259 –268.
Detimary, P., P. Gilon, and J. C. Henquin. 1998. Interplay between cyto-plasmic Ca21and the ATP/ADP ratio: a feedback control mechanism in
mouse pancreatic islets.Biochem. J.333:269 –274.
Dupont, G., and A. Goldbeter. 1994. Properties of intracellular Ca21waves
generated by a model based on Ca21-induced Ca21release.Biophys. J.
67:2191–2204.
Eddlestone, G. T., A. Goncalves, J. A. Bangham, and E. Rojas. 1984. Electrical coupling between cells in islets of Langerhans from mouse.
J. Membr. Biol. 77:1–14.
Frank-Kamenetsky, D. A. 1967. Diffusion and Heat Transfer in Chemical Kinetics. Nauka, Moscow (in Russian).
Gilon, P., and J. C. Henquin. 1995. Distinct effects of glucose on the synchronous oscillations of insulin release and cytoplasmic Ca21
con-centration measured simultaneously in single mouse islets. Endocrinol-ogy.136:5725–5730.
Gylfe, E., E. Grapengiesser, and B. Hellman. 1991. Propagation of cyto-plasmic Ca21-oscillations in clusters of pancreaticb-cells exposed to
glucose.Cell Calcium.12:229 –240.
Hellman, B., E. Gylfe, P. Bergsten, E. Grapengiesser, P. E. Lund, A. Berts, A. Tengholm, D. G. Pipeleers, and Z. Ling. 1994. Glucose induces oscillatory Ca21 signaling and insulin release in human pancreatic
b-cells.Diabetologia.2:S11–S20.
Henquin, J. C., J. C. Jonas, and P. Gilon. 1998. Functional significance of Ca21-oscillations in pancreaticb-cells.Diabetes Metab.24:30 –36.
Holden, A. V., M. Markus, and H. G. Othmer (editors). 1991. Nonlinear Wave Processes in Excitable Media. Plenum Press, New York. Jonkers, F. C., J. C. Jonas, P. Gilon, and J. C. Henquin. 1999. Influence of
cell number on the characteristics and synchrony of Ca21oscillations in
clusters of mouse pancreatic islet cells. J. Physiol. (Lond.). 520: 839 – 849.
Lernmark, A. 1974. The preparation of, and studies on, free cell suspen-sions from mouse pancreatic islets.Diabetologia.10:431– 438. Meda, P., I. Atwater, A. Goncalves, A. Bangham, L. Orci, and E. Rojas.
1984. The topography of electrical synchrony amongb-cells in the mouse islets of Langerhans.Q. J. Exp. Physiol.69:719 –735. Meda, P., R. M. Santos, and I. Atwater. 1986. Direct identification of
electrophysiologically monitored cells within intact mouse islets of Langerhans.Diabetes.35:232–236.
Meissner, H. P. 1976. Electrophysiological evidence for coupling between
b-cells of pancreatic islets.Nature.262:502–504.
Michaels, R. L., R. L. Sorenson, J. A. Parsons, and J. D. Sheridan. 1987. Prolactin enhances cell-to-cell communication amongb-cells in pancre-atic islets.Diabetes.36:1098 –1103.
Mornev, O. A. 1998. Modification of the Biot method on the basis of the principle of minimum dissipation (with an application to the problem of propagation of nonlinear concentration waves in an autocatalytic medium).Russian J. Phys. Chem.72:112–118.
Nadal, A., I. Quesada, and B. Soria. 1999. Homologous and heterologous asynchronicity between identified alpha-, beta- and delta-cells within intact islets of Langerhans in the mouse.J. Physiol. (Lond.).517:85–93. Palti, Y., G. B. David, E. Lachov, Y. H. Mida, and R. Schatzberger. 1996. Islets of Langerhans generate wavelike electric activity modulated by glucose concentration.Diabetes.45:595– 601.
Perez-Armendariz, M., E. Rojas, and I. Atwater. 1985. Glucose-induced oscillatory changes in extracellular ionized potassium concentration in mouse islets of Langerhans.Biophys. J.48:741–749.
Perez-Armendariz, M., C. Roy, D. C. Spray, and M. V. Bennett. 1991. Biophysical properties of gap junctions between freshly dispersed pairs of mouse pancreaticb-cells.Biophys. J.59:76 –92.
Pipeleers, D. G., P. A. I’nt Veld, E. Maes, and M. Van der Winkel. 1982. Glucose-induced insulin release depends on functional cooperation be-tween islet cells.Proc. Natl. Acad. Sci. U.S.A.79:7322–7325. Pipeleers, D. G., R. Kiekens, Z. Ling, A. Wilikens, and F. Schuit. 1994.
Physiologic relevance of heterogeneity in the pancreaticb-cell popula-tion.Diabetologia.37, S57–S64.
Rinzel, J. 1984. Bursting oscillations in an excitable membrane model.In
Ordinary and Partial Differential Equations, Lecture Notes in Mathe-matics, Vol. 1151. B. D. Sleeman and R. J. Jarvis, editors. Springer, New York. 304 –316.
Santos, R. M., L. M. Rosario, A. Nadal, J. Garcia-Sancho, B. Soria, and M. Valdeolmillos. 1991. Widespread synchronous [Ca21]
ioscillations due
to bursting electrical activity in single pancreatic islets.Pflugers Arch.
418:417– 422.
Satin, L. S., and P. Smolen. 1994. Electrical bursting inb-cells of the pancreatic islets of Langerhans.Endocrine.2:677– 687.
Scott, A. C. 1975. The electrophysics of a nerve fiber.Rev. Mod. Phys.
47:487–533.
Scott, A. C. 1999. Nonlinear Science: Emergence and Dynamics of Co-herent Structures. Oxford University Press, Oxford.
Sherman, A. 1997. Calcium and membrane potential oscillations in pan-creaticb-cells. InCase Studies in Mathematical Modeling: Ecology, Physiology, and Cell Biology. H. G. Othmer, F. R. Adler, M. A. Lewis, and J. C. Dallon, editors. Prentice-Hall, New York. 199 –217. Sherman, A., and J. Rinzel. 1991. Model for synchronization of pancreatic