PAWEES 2012
International Confere ce on
"C al enges of Water
zyxwvutsrqponmlkjihgfedcbaZYXWVUTSRQPONMLKJIHGFEDCBA
&
Environmental Management
in Monsoon Asia"
27-29 November 2012
Royal Irrigation Department (Pakkred),
Thailand
C O N T A C T IN F O R M A T IO N A N D D E T A IL S :
F o r U S -re la te d q u e s tio n s , p le a s e c o n ta c t:
tsrqponmlkjihgfedcbaZYXWVUTSRQPONMLKJIHGFEDCBA
Contact Person:
D r. S u c h a rit K o o n ta n a k u lv o n gWater Resources System Research Unit
Room 203, Bldg. 2 Faculty of Engineering,
Chulalongkorn University, Bangkok
Tel: +66-2-218-6426, +66-81-646-9750
Fax: +66-2-218-6425
Email: [email protected]
F o r m o re d e ta ile d in fo rm a tio n y o u a re m o re th a n w e lc o m e to v is it o u r w e b s ite :
http://project-wre.eng.chula.ac.th/watercu
ONMLKJIHGFEDCBA
e n g lC o
c
O rg a n iz in g In s titu te s :
tsrqponmlkjihgfedcbaZYXWVUTSRQPONMLKJIHGFEDCBA
International Society of Paddy
and Water Environment
Engineering (PAWEES)
Faculty of Engineering,
Chulalongkorn
University (CU),
Thailand
Faculty of Engineering at
Kamphaengsaen,
Kasetsart University (KU),
Thailand
Royal Irrigation Department (RID),
Thailand
Irrigation Engineering Alumni
Association
under H.M.
The King's
Patronage (lEA),
Thailand
A d v is o ry C o m m itte e
tsrqponmlkjihgfedcbaZYXWVUTSRQPONMLKJIHGFEDCBA
1.
Mr. Lertviroj
Kowattana
2. Or Pirom
Kamol-ratanakul,
MD
3. Mr. Vudtechai Kapilakanchana
4. Dr. Tai-cheol
Kim
5
Or. Yohei
Sato
6. Or. Hiroyuki
Konuma
7. Or. Sho
Shiozawa
8. Or. Sun-joo
Kim
9. Mr. Wei-Fuu
Yang
S c ie n tific C o m m itte e
10. Or. Bancha
Kwanyuen
11. Dr. Ekasit
Kositsakulchai
12. Dr. Masaru
Mizoguchi
13. Or. Yoshiyuki
Shinogi
14. Or. Nobumasa Hatcho
15. Dr. Yutaka
Matsuno
16. Dr. Seong Joon
Kim
17. Dr. Sang Min
KIM
18. Or. Fi-John
Chang
19. Or. Ke-Sheng Cheng
20. Dr. Sucharit
Koontanakulvong
21. Dr. Chaiyuth
Sukhsri
22. Dr. Aksara
Putthividhya
23. Dr. Somchai
Donjadee
24. Or. Chirakarn Sirivitmitrie
25. Or. Pongsathorn Sopaphun
26. Or. Wisuwat
Taesombat
27. Mr. Santi
Thongphamnak
28. Dr. Varawoot
Vudhivanich
29. Dr. Watchara
Suidee
O rg a n iz in g C o m m itte e
30. Or. Bonsoom
31. Dr. Sucharit
32. Mr. Va-Son
33. Or. Thanet
34. Or. Bancha
35. Or. Ekasit
36. Or. Yutaka
37. Miss Mada
Lerdhirunwong
Koontanakulvong
Boonkird
Aksorn
Kwanyuen
Kositsakulchai
Matsuno
laumsupanimit
Royal Irrigation Department
Chulalongkorn University
Kasetsart University
PAWEES
PAWEES
FAO
JSIDRE, Japan
KSAE, Korea
TAES, Taiwan
Kasetsart Uuniversity
Kasetsart Uuniversity
University of Tokyo, Japan
Kyusyu University, Japan
Kinki University, Japan
PAWEES, Kinki University.Japan
Konkuk University, Korea
Gyeongsang NationalUniversity,Korea
National Taiwan University.Taiwan
National Taiwan University.Taiwan
Chulalongkorn University
Chulalongkorn University
Chulalongkorn University
Kasetsart University
Kasetsart University
Kasetsart University
Kasetsart University
Kasetsart University
Kasetsart University
Royal Irrigation Department
Chulalongkorn University
Chulalongkorn University
Royal Irrigation Department
Royal Irrigation Department
Kasetsart Uuniversity
Kasetsart Uuniversity
PAWEES Kinki University.Japan
Chulalongkorn University
C O
T E
T S
tsrqponmlkjihgfedcbaZYXWVUTSRQPONMLKJIHGFEDCBA
WELCOME ADDRESS
111
CONFERENCE ORGANIZING INSTITUTES
IV
CONTENTS
VI
AIMS AND SCOPE
1
PROGRAMME
2
FEATURED SPEECH
Participatory management
for irrigation
projects
Va-son Boonkird
6
Radioactive contamination
of paddy soil and its transfer to rice in fukushima
Sho Shiozawa
7
Farmers' responses to climate change adaptation
in irrigation
project (Thailand
case study)
Assoc. Prof. Chaiyuth Suksri.
8
ABSTRACT
SESSION A Climate Change and Uncertainty
PAPER ID: 000
A review of land-use change scenarios by new climate change scenarios in Korea
10
PAPER ID: 008
Simulation of GHG emission from paddy by DNDC model for climate change impact in Korea .... 11
PAPER ID: 025
Coping with uncertainties in climate change by stochastic storm rainfall simulation
12
PAPER ID: 032
The study on parameter sensitivity analysis of the Denitrification-Decomposition
(DNDC) model
13
PAPER ID: 046
Climate change impact assessment in Sukhothai Province: intercomparisqn between three Global
Climate Models
:
14
PAPER ID: 049
Probability based assessment of Climate Change Impact on Irrigation Systems in Upper Chao
Phraya Basin
15
PAPER ID: 051
Assessment of water supply capacity of agricultural irrigation facilities using MODSIM-DSS
Coupled with SWAT
16
PAPER ID: 052
Assessment
of Climate
Change
Impact on Multi-purpose
Dam based on RCP emission
scenarios
Using SWAT model
17
PAPER ID: 057
Mitigation method of irrigation
systems
against
climate
change
in the Chao Phraya
Basin,
Thailand
zyxwvutsrqponmlkjihgfedcbaZYXWVUTSRQPONMLKJIHGFEDCBA
18
PAPER ID: 075
Analysis Framework
for Water
Resource
Policy Decision-Making
under
Effects of Climate Change
19
SESSION
8
Participatory
Management
for Irrigation
Projects
PAPER ID: 005
Relationship between
irrigation
water management
by farmers'
group and the levy system
21
PAPER ID: 033
Duration of irrigation vulnerabilities
according
to agricultural
water supply
and demand
22
PAPER ID: 044
Assessment
of farmer participation
in irrigation
management
for
paddy irrigation development
in Myanmar
23
PAPER ID: 045
Impact of participatory
approaches
on irrigation
development
and management
for Communal
Irrigation System (CIS): Case studies
in three upland provinces
of north, Philippines
24
PAPER ID: 071
Investigation of paddy field irrigation
activities
by farmers
aiming for
demand-oriented
irrigation
service
25
SESSION C Emerging
Technologies
in Water
Management
PAPER ID: 003
Dam management
at Drought
in dry season
paddy irrigation,
Case study of Mae Suai Dam ...
27
PAPER ID: 012
Assessing flood damages
of rice in the Chao Phraya
Delta, using
MODIS satellite imageries
28
PAPER ID: 015
Optimizing non-flooded
irrigation
regime
under system
of rice intensification
crop management
using Genetic Algorithms
29
PAPER ID: 018
Investigating the interactive
recharge
mechanisms
between
surface
water and groundwater
over
the Jhuoshuei River Basin in Central Taiwan
30
PAPER ID: 020
jlrAls: Agent-Based
Modeling
for Simulating
Irrigation Water
Use in Paddy
Land
31
PAPER ID:
zyxwvutsrqponmlkjihgfedcbaZYXWVUTSRQPONMLKJIHGFEDCBA
023
A bayesian uncertainty
analysis
of the modelled
surface-
and ground-water
flows in an agricultural
watershed. ..
.. . .. .
32
PAPER ID:
024
A study on drainage
efficiency
of shortcut
canal project in the Lower The chin River.
33
PAPER ID:
031
Drought response
by farmers
after decreasing
water supply
34
PAPER ID:
036
Development
of automated
irrigation
system for food production
land
35
PAPER ID:
047
Satellite Data Application
for flood simulation
36
PAPER ID:
048
Statistical forecasting
of rainfall with ENSO index in the Chao Phraya
River Basin in Thailand ..37
PAPER ID: 055
Est mation of Streamflow
by SWAT Model in Sedone
River Basin, LAO PDR
'38
PAPER ID: 059
Yoshino and Nan River basins development
and management
comparative
study
39
PAPER ID:
061
System of Environmental-Economic
Accounting
for water in case of Thailand
.40
PAPER ID:
062
Ap lication of Input-Output
Table for future water resources
management
under policy and climate
ch nqe in Thailand:
Rayong Province
Case study
41
PA
ER ID:
063
Wc
er Footprint of Bioethanol
Production
in Thailand
.42
PA
ER ID:
073
Ot..
si Real-time monitoring
system for Informing
the Optimum
Planting
and Harvesting
Dates of
Ca sava in Rain-fed
Upper Paddy Field in Northeast
Thailand
.43
pp
ER ID:
077
Re ional difference
in the citizen's
consciousness
of water resources
:
.44
SE
SION
0
Environmental
Sustainability
in Paddy
Irrigation
and Drainage
PAPER ID:
001
Car asian experience
be transferred
to Africa?
-Lessons
learned from drafting
a rice production
me ual in Africa
.45
PA
ER ID:
002
Wa 'r quality constituents
export from paddy field in Southern
Korea
.46
PAl ER ID:
004
Ml
.
regression
analysis
of water quality characteristics
in lowland
paddy fields
.47
PAPER ID:
zyxwvutsrqponmlkjihgfedcbaZYXWVUTSRQPONMLKJIHGFEDCBA
006
Evalcation of field measurements
and estimated
rice crop water requirements
.48
PAPER ID:
007
Effect of rice straw mat mulch and soil amendments
on runoff under
laboratory rainfall simulations
.49
PAPER ID:
009
Runoff and NPS pollution
discharge
characteristics
from sloping
upland fields in Korea
16
50
PAPER ID:
011
Aqrlcuitura:
infrastructure
database
establishment
for vulnerability
assessment
according
to climate
chan e in Korea
51
PAPE RID:
013
Genr ic diversities
and population
structures
of small freshwater
fishes in
Mekong River basin
52
PAP[R
ID:
014
Char cteristics of drainage
water quality and loading from paddy field under cyclic irrigation
and its
mancqement
options
53
PAP
RID:
017
Estin ating regional total phosphate
concentration
in a river basin through
the NARX network ...
54
PAP
RID:
021
Deve
opment of the world atlas of irrigated
agriculture
for sustainability
science
55
PAP
RID:
022
Influ
ntial
factors in determining
the timing of transplanting
lowland
rice:
case study in Lao PDR
56
PAP
RID:
027
Hab
t potential maps of three frog species
for paddy field areas of
the
I'ddle
Sakura River basin, Japan
57
PAP
RID:
040
Cha --nges in the decontamination
of radioactive
cesium
of Fukushima:
a rural planning
pers ective
58
PAF
RID: 058
Soil
acro Nutrient (N, P, K) during Growth
Stages
under Conventional
and SRI
(Sy_m
of Rice Intensification)
Practices
in Tropical
Soil.
59
PA
RID:
069
A
si
lyon the reason why the reported
yields of the System
of
Rice ntensification
(SRI) are so widespread
60
PA
RID:
072
Mal
xing and Analyzing
of Soil Water
Pollutant
Loads in Greenhouse
61
IN O F A U T H O S 6 2
tsrqponmlkjihgfedcbaZYXWVUTSRQPONMLKJIHGFEDCBA
R Y
L IR R IG A T IO D E P A R T M E N T (P A K K R E D ) M A P 6 3PA\\ EES 2012 International Conference
he lenges . Water
tsrqponmlkjihgfedcbaZYXWVUTSRQPONMLKJIHGFEDCBA
&Envrronmental Management In Monsoon ASIa '7-2'-1 member 20 2. ThailandOptimizing
on-flooded Irrigation Regime under System of Rice
Intensification Crop Management
using Genetic Algorithms
Chusnul Arif. Budi Indra Setiawan, Masaru Mizoguchi
and Ryoichi Doi
Abstract: In this study, an optimal non-flooded
Irrigation regime that maximizes both the yield and
water productivity of System of Rice Intensification
(SRI) crop management was simulated by genetic
algorithms (GAs) model. Here, the field was classified
into wet
ONMLKJIHGFEDCBA
( \ \ I ) . medium ( M ) and dry (D) conditions ineach growth stage, namely initial, crop development,
mid-season and late season stages according to the soil
moisture level. The simulation was performed based on
the identification process according to the empirical data
during three cropping seasons. As the results, the
optimal combination was 0.622 (W), 0.563 (W), 0.522
(M), and 0.350 crnvcrrr' (D) for initial, crop
development, mid-season and late season growth stages,
respectively. The wet conditions in the initial and crop
development growth stages should be achieved to
provide enough water for the plant to develop root, stem
and tiller in the vegetative stage, and then the field can
be drained into medium condition with the irrigation
threshold of field capacity to avoid spikelet fertility in
mid-season stage and finally, let the field dry to save
more water in the late season stage. By this scenario, it
was simulated that the yield can be increased up to
6.33% and water productivity up to 25.09% with saving
water up to 12.71%compared to the empirical data.
Keywords: system of rice intensification (SRI),
non-flooded irrigation, crop productivity, water productivity,
genetic algorithms.
Chusnul Arif «(8])
Department of Civil and Environmental Engineering,
Bogor Agricultural University (IPB), Bogor, Indonesia
Department of Global Agricultural Sciences, the
University of Tokyo, Japan
Phone: (62)-251-8627225, (81 )-3-5841-1606
Fax: (62)-251-8627225, (81 )-3-5841-1606
Email: [email protected]@ipb.ac.id
Budi Indra Setiawan
Department of Civil and Environmental Engineering,
Bogor Agricultural University (IPB). Bogor, Indonesia
Email: [email protected]
Masaru Mizoguchi and Ryoichi Ooi
Department of Global Agricultural Sciences, the
University of Tokyo, Japan Email: [email protected];
Introduction
Recently, the scarcities of water resources and
competition for their use have made water saving the
main challenge in maintaining the sustainability of rice
farming. Therefore, water saving technology becomes
one of the priorities in rice research (Barker et al. 2000).
From the previous findings, rice is highly possible
produced under water saving technology with System of
Rice Intensification (SRI) crop management in which
continuous flooded irrigation is not essential anymore to
gain high yield and biomass production (Zhao • al.
201I; Sato et al.201I;Lin et al. 201I).
SRI is well-known as a set crop management practices
for raising the productivity of irrigated rice by changing
the management of plants, soil, water and nutrients.
Although some critics were dismissed to the SRI
(Sinclair and Cassman 2004; Sheehy et al. 2004;
Oobermann 2004), however, its benefits have been
validated in 42 countries of Asia, Africa and Latin
America (Uphoff et al. 2011). In the SRI paddy field,
non-flooded irrigation is applied in which the field is
allowed dry during particular time instead of keeping
them continuously flooded, a practice called alternate
wetting and drying irrigation (AWOl) (Van der Hoek et
al. 2001).
Many experiments have been conducted by comparing
continuous flooded and non-flooded irrigations under
SRI crop management (Choi et al. 2012; Zhao et al.
2011; Sato et al. 2011; Hameed et al. 2011; Barison and
Uphoff 2011; Chapagain and Yamaji 2010). Water
productivity can be raised by saving water significantly,
as reported in studies that provide data for different
countries, e.g., 28% in Japan (Chapagain and Yamaji
2010),40% in Eastern Indonesia (Sato et al. 2011), and
38.5% in Iraq (Hameed et al. 2011). Also by SRI crop
management, the land productivity raised more than
double in Madagascar (Barison and Uphoff 2011), 78%
in Eastern Indonesia (Sato et al. 2011), 65% in
Afghanistan (Thomas and Ramzi 2011), 42% in Iraq
(Hameed et al. 2011), and 11.3% in China (Lin et al.
2011). However, the optimal wet and dry levels
(represented by soil moisture) in each growth stage is
still unclear because there is lack information study on
optimizing water irrigation regime under SRI crop
management. Thus, the current study was undertaken to
find optimal soil moisture level in each growth stage to
maximize both land and water productivity during
P \ \\ Ef S 2012 International Conference
( tal enges of \\ ater
tsrqponmlkjihgfedcbaZYXWVUTSRQPONMLKJIHGFEDCBA
&Environmental Management In Monsoon ASia'7-11) ver-ber 2012 Thailand
In the irrigation planning model, it has always been a difficult problem to find optimal or near optimal solutions with traditionally dynamic optimizations method because of multi-factors, uncertainty and non-lmearity in the model (Zhang et al. 2008). Also, traditional optimizations have limitations in finding global optimization results for a complex irrigation planning problem because they search from point to point (Kuo et al. 2000). Thus, genetic algorithms (GAs) model proposes global optimization search with many remarkable characteristic by searching the entire population instead of moving from one point to the next as the traditional methods (Kuo et al. 2000).
GAs model has ability to rapidly search a global optimal value of a complex objective function using a multi-point search procedure involving crossover and mutation processes (Goldberg 1989). GAs model differs from traditional optimization and other search procedures in the following ways: (l) GAs works with a coding of the parameter set, not the parameters themselves, (2) GAs searches from population of points, not single point, (3) GAs uses objective function information, not derivatives or other auxiliary knowledge, and (4) GAs uses probabilistic transition rules, not deterministic rules (Goldberg 1989). GAs model has been applied to several irrigation planning applications (Zhang et al. 2008; Ward law and Bhaktikul 2004; Raju and Kumar 2004; Kuo et al. 2000). However, optimizing non-flooded irrigation regime by finding optimal soil moisture in each growth stage has not yet been achieved particularly under SRI crop management.
Therefore, the objective of current study was to find optimal soil moisture level in each growth stage of paddy rice under SRI crop management using GAs model to maximize both land and water productivity.
Materials and Methods
Field Experiments
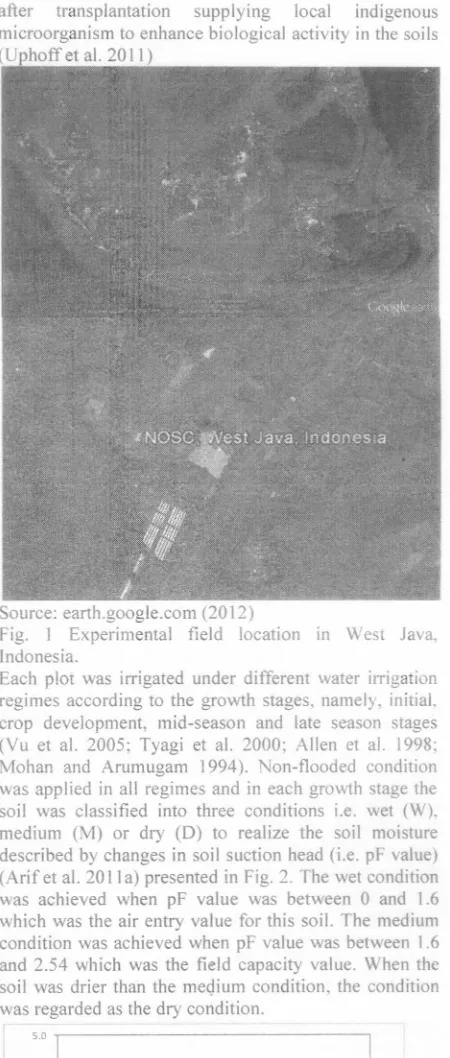
[image:11.563.278.503.109.638.2]The optimization process was carried based the field experiment in the experimental paddy field in the Nagrak Organics SRI Center (NOSC), Sukabumi, West Java, Indonesia located at 06°50'43" S and 106°48'20" E, at an altitude of 536 m above mean sea level (Fig. 1) during three cropping seasons (Table 1).
Table I. Cultivation period of each cropping season Period Planting date Harvesting dale Season First
Second Third
14 October 20I0 20 August 2011 22 March 2012
8 February 20I I
15 December 2011 5July2012
Wet Dry- Wet Wet- Dry
There were four plots and each plot was planted with the variety of rice
tOryza
ONMLKJIHGFEDCBA
s a l i v a L), Sintanur using the following SRI crop management: single planting of young seedlings spaced at 30 cm x 30 cm, applying an organic fertilizer at 1 kg/m ' in the land preparation, but no chemical fertilizer. The weeding was performed every 10 days in the period between 10 and 40 daysafter transplantation supplying local indigenous microorganism to enhance biological activity in the soils (Uphoff et al. 2011)
Source: earth.google.com (2012)
Fig. I Experimental field location 111 West Java. Indonesia.
Each plot was irrigated under different water irrigation regimes according to the growth stages, namely, initial, crop development, mid-season and late season stages (Vu et al. 2005; Tyagi et al. 2000; Alien et al. 1998; Mohan and Arumugam 1994). Non-flooded condition was applied in all regimes and in each growth stage the soil was classified into three conditions i.e. wet (W), medium (M) or dry (D) to realize the soil moisture described by changes in soil suction head (i.e. pF value) (Arif et al. 2011 a) presented in Fig. 2. The wet condition was achieved when pF value was between 0 and 1.6 which was the air entry value for this soil. The medium condition was achieved when pF value was between 1.6 and 2.54 which was the field capacity value. When the soil was drier than the medium condition, the condition was regarded as the dry condition.
5.0
4.0
3.0
u,
Cl, 20
LO
LO
Volumetric water content(cm'jcm')
L_
_
_
[image:11.563.279.504.623.734.2]P'\ WEES 2012 International Conference
l 'iallcngcs of Water
tsrqponmlkjihgfedcbaZYXWVUTSRQPONMLKJIHGFEDCBA
&Env ronmental Management in Monsoon ASIa 27-29 lovernber 2012 fhailandoil moisture and meteorological data consisting of air
temperat re, wind speed, relative humidity, solar
radiation and precipitation were collected by a quasi real
tin-e monitoring system (Arif et al. 20 I1 b). Here,
meteorological data were used to calculate reference
evapotranspiration (ETo) based on the FAO
Penman-Monteith model (Alien et al 1998). Then, using
monitoring data. total irrigation, crop evapotranspiration
were estimated b) Excel Solver (Arif et al. 2012a).
Modeling Approach
Identification procedure
To determine optimal soil moisture level in each growth
stage to maximize yield and water productivity, the
relationship between their values and the yield as well as
water productivity should be identified firstly based on
empirical data. Since there was no mathematical model
between them, identification process was carried out
gradually and its procedure as follow:
I. Yield as function of plant height and tiller
numbers/hill
The yield has positive correlation to plant growth
represented by plant height and tiller numbers/hill.
Therefore, we used multiple linear regressions to show
the correlation between the yield and plant height as
well as tiller numbers.hill, The basic formula was given
as follow:
Y=aPH+bTH+e
(I)Where Y is yield (ton/ha), PH is plant height (cm), TH
is tiller numbers/hill, a, b, c are coefficients of plant
height, tiller numbers/hill and the intercept, respectively.
Plant height and tiller numbers/hill were measured
manually every 5 days and we used their average values
in the end of mid-season stage when maturity time was
started to show their correlation to the yield (Alien et al.
1998). Here, all coefficients in equation I were
determined empirically according field experiments by
multiple linear regressions.
2. Plant height and tiller numbers/hill as function of
soil moisture
Plant height and tiller numbers/hill are affected by soil
condition represented by the soil moisture level in each
growth stage. In fact, it is difficult to identify the
relationship between soil moisture and plant growth by
mathematical model because it is characterized by
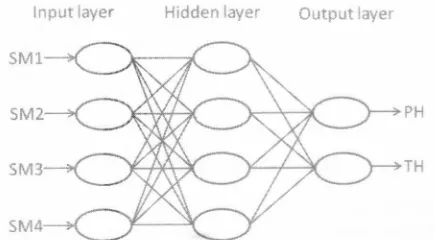
non-linearity. Thus, we implemented neural networks model
to show its correlation since neural networks model
deals with complex system such as in agricultural
system (Hashimoto 1997). The model consisted three
layers, i.e. input, hidden and output layers. Soil moisture
in the initial (SM 1), crop development (SM2),
mid-season (SM3) and late mid-season (SM4) were used as in the
inputs, while plant height (PH) and tiller numbers/hill
(TH) as the outputs (Fig.3).
3. Water productivity with respect total water input
Since we focused to find the minimum water input as
much as possible, thus we defined water productivity
with respect total water input (Bouman et al. 2005) with
the following equation:
Wp=
y
ONMLKJIHGFEDCBA
L ( !
+P)
Where I is total irrigation (mm) that affected by the soil
moisture level in each growth stage, P is precipitation
(mm) and WP is water productivity (g grain/kg water).
Input layer Hidden layer Output layer
(2)
SMl
TH
5M2
PH
5M3
5M4
Fig. 3 Structure of neural networks model to identify
plant height and tiller numberslhill as affected b) soil
moisture.
Optimization procedure
The objective function can be described as:
F(SM 1,SM2,SM2,SM4)=
dY +eWP
(3)Maximize F(SMI ,SM2,SM3,SM4)
Subject to:
0.586~SMI~0.622(ern3fern3)
(4)0.563 ~ SM2 ~ 0.593 (cm
3
/cm ')
(5)0.455 ~ SM3 ~ 0.522 (cm 3/cm ')
(6)0.350 ~ SM4 ~ 0.505 (cm i/cm ")
(7)Where d and e are weights for the yield (Y) and water
productivity (WP) and their values were 0.6 and 0.4,
respectively. Since both Y and WP have different unit,
thus their values were normalized using their maximum
and minimum values based on empirical data. Here,
GAs model searched optimal combination of SM I,
SM2, SM3, and SM4 with their interval (minimum and
maximum soil moisture in each growth stage) according
experiment data to maximize the objective function by
multi-point searching procedure.
In order to employ GAs model, some parameters such as
individual, population, fitness function and operators of
GAs should be defined firstly as follows:
I. Definition of individual
An individual represented a candidate for the
optimal solution that consisting of particular values
SM I, SM2, SM3 and SM4. Meanwhile a set
individual was called population. An individual was
coded as six-bit binary strings as illustrated as
follow:
Individual = SMI, SM2, SM3, SM4
=
000101, 001000, 001100, 100001 [image:12.561.279.496.202.322.2]PA\\ EES 2012 International Conference
Cha enge of Water
tsrqponmlkjihgfedcbaZYXWVUTSRQPONMLKJIHGFEDCBA
&Em ironmental Management In Monsoon Asia :7-29 ove+ber 2012 Thailand0.598, 0.567, 0.468, 0.431 (decimal values in cm'zcrrr')
2 Fitness function
Fitness function is an indicator to show the quality of an individual. All individuals in a population were evaluated based on their performances in which the higher fitness function, the better ability to survive In this problem, fitness function was given same as an objective function (equation 3). 3. Operators of GAs model
The main operators were crossover and mutation. Crossover combined features from two individuals based on crossover rate (Pc). It is operated by swapping corresponding component in the binary strings represented an individual. Mutation inverted one or more bit binary string (also called gene) in
each indiv idual from 0 to 1 or 1 to 0 based on
mutation rate (Pm). Here, Pc and Pm were 60% and 5%, respectively.
K=O
Initial population No New population ote:GN =generation numbers; 200
Fig. 4 Searching procedure of GAs model in the current study.
We adopted the searching procedure as developed previously (Suhardiyanto et al. 2009) and could be further explained as follow:
I. An initial population consisting of ten individuals were generated randomly as the first generation 2. Fitness function was calculated to show the
performance of each individual
3. The performance of each individual was evaluated by sorting maximum to minimum fitness value. Here, 60% of all individuals with the highest performance were selected to next step, another fitness values were eliminated
4. Crossover and mutation operations were applied to the selected individual based on Pc and Pm rates
5. Then, new population was created. Here, 60% of selected individuals previous generation were compared to the new population. We implemented the elitist strategy to find global optimum by sorting the fitness value and then selected ten individuals with highest performance as the next generation. 6. Steps 2 to 5 were repeated until the required
generation numbers achieved. The optimal values were given as an individual with highest fitness when the result was convergent
We developed both neural networks and GAs models in Microsoft Excel 2007 with Visual Basic Application with our own codes.
Results and Discussions
Correlation between plant growth, yield and soil
moisture
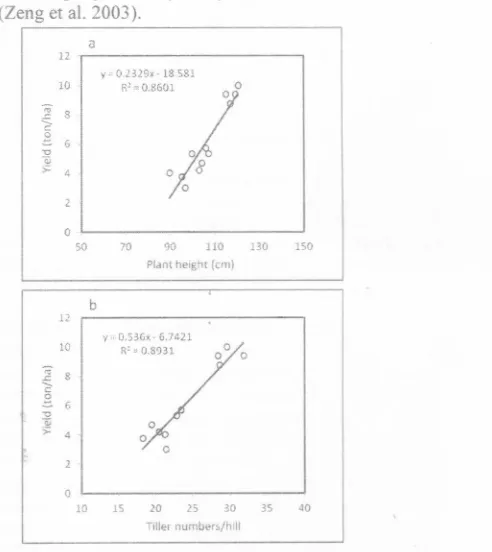
Based on empirical data, it was cleared observed that both plant height and tiller numbers/hill have positive correlation to the yield with R2 of 0.86 and 0.89, respectively (Fig.5). These results were consistent with previous findings that higher plant height with more tiller numbers/hill promoted more yield and vice versa (Kumar et al. 2012; Zeng et al. 2003). Therefore, the correlation between the yield and both plant height and tiller numbers/hill can be presented well by multiple linear regressions with R2 of 0.94 (Fig.6). Commonly
the yield of rice is highly dependent upon the number of fertile tiller numbers/hill, thus more tiller numbers/hill have high probability to produce more fertile tiller (Zeng et al. 2003).
a 12 v 02329)1-18531 10
""'WI
'"
s'>
~
6 "0 -.; ;;: 4 2 050 70 90 110 130 ISO
Plant height [crnl
b
12
y 0.536,· 6.7421
10
"'/
'"
8""
c.g
6 -o -.; >: 4 1 010 IS 20 25 30 3S 40
[image:13.563.279.525.445.721.2]Tiller numb ers/hdl
Fig. 5 Correlation between plant height, tiller
PA \\ EES 2012 International Conference
Cha.lenges of Water
tsrqponmlkjihgfedcbaZYXWVUTSRQPONMLKJIHGFEDCBA
&Environmental Management In Monsoon ASIa 27-2'1. ovember 2012 Thailand12
--; y a.107PH t0 323TH - 13.03
10 R- 0.9355 0
c
g
8 '0 -a:; s, '0 6'"
to
e:
4 :;; w 2 00 4 6 8 10 12
Observed yield(ton/ha)
Fig. 6 Multiple linear regression plant height and tiller numbers/hill on the yield.
The yield also has positive correlation to the crop evapotranspiration (ET) with R~ of 0.94 as presented in Fig. 7. It was indicated that higher crop evapotranspiration promoted more evaporation process from the soil and transpiration process from the plant, thus more yield was achieved as well as biomass production (Shih 1987). The linear correlation between crop evapotranspiration and the yield is not only found for paddy rice (Shih et al. 1983), but also other crops such as corn (Ko and Piccinni 2009), cotton and wheat (Jalota et al. 2006). Therefore, crop evapotranspiration is usually used to estimate the yield (Shih 1987).
12.0 10.0
~
8.0?
,g, 6.0 '0 Qj > 40 20 00 310Y=0.l2ET -33.9
R'=0.94
•
• Ydata-Ymodel
350 360 370
320 330 340
Crop evaporranspuatioo (mm)
Fig. 7 Correlation between yield and crop evapotranspiration.
Crop evapotranspiration is vital for irrigation scheduling and water resource allocation, management and planning (Jensen et al. 1990). Also, it is a main component of water consumption in paddy fields, thus its rate is depend on water availability in the field represented by soil moisture. In other words, plant growth and the yield were clearly affected by soil moisture level in each growth stage (Arif et al. 2012b; Anbumozhi et al. 1998). However, there is no mathematical model was found showed the relation between soil moisture level in each growth stage and plant growth as well as the yield.
Here, we used neural networks model to estimate plant growth represented by plant height and tiller
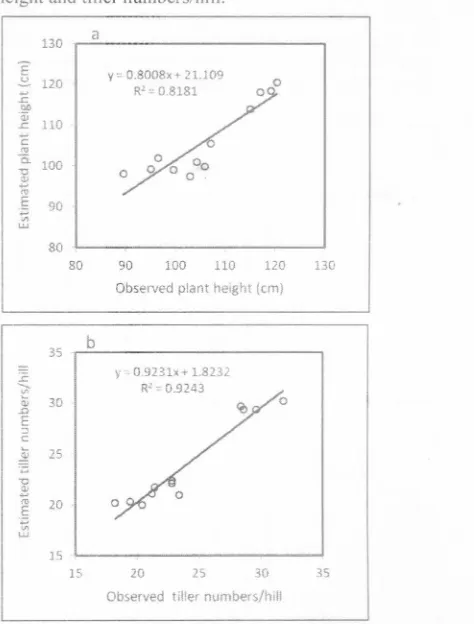
numbers/hill as affected by soil moisture level in each growth stage. Fig. 8 shows the comparisons between observed and estimated values of both plant height and tiller numbers/hill by neural networks model. It can be seen that the estimated values were closely related to the observed values with R2 of 0.82 and 0.92 for estimation of plant height and tiller numbers/hill, respectively. This means that more than 80% of observed values can be explained linearly by neural networks model. Therefore, the results suggest that a reliable simulation model by neural networks could be obtained to estimate plant height and tiller numbers/hill.
a 130
E
~
120~
00 ijj 110 s: C'"
Ci 100 '0 B'"
~
90 w 80 80y=0.8008x+21.109 R' 0.8181 o
o
90 100 110 120
Observed plant height (cm)
130
35 35 b
i: Y 0.9231>+1.8232 '?;;- R'=0.9243
Q:; 30 .D E :J C
~
25 '0 Bro 20 E~
w 1515 20 25
o
30
Observed tiller numbers/hill
Fig. 8 Observed and estimated plant growth as affected soil moisture level by neural networks model: a) Observed vs estimated plant height, b) Observed vs estimated tiller numbers/hill.
Optimal soil moisture levels
by
GeneticAlgorithms
Fig. 9 shows the evolution curves of fitness values (equation 3) between their maximum, average and minimum values in each generation. All of values increased sharply from the first to the tenth generation, and then increased gradually until the fortieth generation. After the fortieth generation, the all fitness values were convergent until the end of generation and their values were 0.68. This means that global maximum value was obtained because all of maximum, average and minimum values were same.
[image:14.563.280.517.237.549.2]PA" EES 2012 International Conference
Challenges of Water
tsrqponmlkjihgfedcbaZYXWVUTSRQPONMLKJIHGFEDCBA
&Environmental Management m Monsoon Asia 27-29 November 2012, Thailandpresented in Fig. 9. SM I and S'vI2 were convergent faster than others growth stages in which their values
we-e reached before the tenth generation. Meanwhile, SM3 was convergent latest in the fortieth generation, thus fitness value was also convergent started at this moment (Fig. 9). This means that the optimal soil moisture level in each growth stage that maximizes the yield and water productivity was obtained from the model simulation based on the GAs procedure shown in Fig. 4 after the fortieth generation.
70
r---,
./
',5
ONMLKJIHGFEDCBA
, " ,I/ "
,
.,
,
.60,
,I f ' i' -r 5'. i, ",
,
0.500 '0 20
- - - Mlllfitne:S5
'0 40 50 so 70 80 ?O 100
General 0" numbers
Fig. 9 Evolution curves in searching for a maximal value of itness function.
0700
r---,
...•.
.
.
.
---
,---!'il~
c.seo 0.300 '---' -..
,,
• M •~. ~•••••••••••• _••••••• ~ ••••__ •• ••••••••••••• _
N W ~ ~ m m m % ~
ene at on"U'TI~'S
Fig. I0 Evolution curves in searching the optimal values of soil moisture in each growth stage.
Table 2 shows the optimal soil moisture level in each growth stage obtained from the GAs simulation, while Fig. II shows the optimal output simulated by GAs model. Four irrigation regimes with some combinations of soil moisture level from the field measurements are also represented in the table with the same precipitation during cropping season as the comparison. The optimal combination of soil moisture level in each growth stage obtained in this study was 0.622 (wet), 0.563 (wet), 0.522 (medium), and 0.350 crrr'zcrn:' (dry) for initial, crop development, mid-season and late season growth stages, respectively. By this scenario, it was simulated that the yield can be increased up to 6.33% and water productivity up to 25.09% with saving water up to 12.71% compared to the first regime (as base line). From this simulation, it can be concluded that during the first to the second stages keeping the field in the wet condition is important to fulfill plant water requirement.
In the SRI, avoid continuous flooding is one of the their elements because rice plants cannot grow best under hypoxic soil conditions, thus plants should be given just enough water at saturated condition to meet their requirement for root, stem and tiller development (Uphoff et al. 2011). Then, the field can be drained into medium condition in the third stage when plants focusing on reproductive stage (flowering and panicle development). The medium condition with the threshold of irrigation was reduced to the field capacity (pF 2.54) is important in developing aerobic condition to avoid spikelet sterility particularly around flowering time (Bouman et al. 2005). Finally, the field should be drained into dry condition in the last stage to save the water input as reported previous studies (Uphoff et al. 2011; Doorenbos and Kassam 1979; Zawawi et al. 2010). a 12.0 10.0
'"
-E. 8.0 c:~
6.0 '0 Oi ;;: 4.0 2.0 0.0 10.63 10.00--r- 9.38 9.38
r- 8.75
-
r-Regime 1 r-Regime 2 Regime 3 Regime 4 Optimal
Regime b 14 1.2
~
~
10 JP 0.8 ? ;;;O D 06 : E c, 0.4
~
0.2 0.0 125112 1.11 1.14
r--
--
102----
[]VJitttrproducttvitv 1& grain!kRwater]
Regime 1 Regimt> 2 Regime 3 R(>gIl'fH:04 Optmal RegIme
Fig. II Optimal the yield and water productivity simulated by GAs model and their comparison to the empirical data.
Table Z Optimal soil moisture level in eacbg;ro\'\th stagf' andits ccmpansce to the empmcal data
Field :Ex.pmrnenrs GAs optmuzer
Regime Regsne Regime Regime (Jptm,.,
Components 1 1 3 4 Regone Ccndmon
Soil moisture {cm3!cm3)
lrutial (SM 1) 0.622 C 602 0.611 0586 O.6:!2 W<t
Crop development (SM.:!) 059" 058; 0.593 0'63 0.563 Wet
Mid- se ason(SM3) 0.522 oJgS 04-1 0455 o5~~ Mednan
Late st:a..son{S_M4) o50~ CAOI 0.~j6 0350 0350 Dry
Yield (ton ha) 1000 938 S -5 938 1063
Tctalcrigaricn (mm) 343 295 305
--,
:99Tot alpreciprtation (mm) 551 551 551 ~51 551
Water prcducrrviry(g gram
kg+waterj 112 1.11 102 114 11~
P.c\
w
tsrqponmlkjihgfedcbaZYXWVUTSRQPONMLKJIHGFEDCBA
EES 2012 International Conference Challenges of Water&Environmental Management in Monsoon Asia 27-29 November 2012 ThailandConclusions
In this study, optimal combination of soil moisture level
in each growth stage that maximizes both the yield and
water productivity of SRI crop management was
simulated by GAs model. The simulation was performed
based on the identification process according to the
empirical data during three cropping seasons. As the
results the optimal combination was 0.622 (wet), 0.563
• 3 1
(wet), 0.522 (medium), and 0.350 cm /cm (dry) for
initial. crop development. mid-season and late season
growth stages, respectively. The wet conditions in the
initial and crop development growth stages should be
achieved to provide enough water for vegetative
development, and then the field can be drained with the
irrigation threshold of field capacity to avoid spikelet
fertility in mid-season stage and finally, let the field d~y
to save more water in the late season stage. By this
scenario it was simulated that the yield can be increased
up to 6.33% and water productivity up to 25.09% ~ith
saving water up to 12.71% compared to the first regime
(as base line).
Acknowledgments
We are grateful to the Directorate of Higher Educatio?,
Ministry of National Education, Republic of Indonesia
for generous financial support .through gr~nt. of
International Research Collaboration and Scientific
Publication and the Japan Society for the Promotion of
Science. Also. the study was partially supported by
GRE E (Green Network of Excellence) of MEXT in
Japan.
References
Alien RG, Pareira LS, Raes D, Smith M (1998) Crop
Evapotranspiration Guidelines for computing
crop water requirements. FAO - Food and
Agriculture Organization of the United
Nations, Rome
Anbumozhi Y, Yamaji E, Tabuchi T (1998) Rice crop
growth and yield as influenced by changes in
ponding water depth, water regime and
fertigation level. Agr Water Manage 37
(3):241-253
ArifC, Mizoguchi M, Setiawan BI, Doi R (201Ia)
Water Management Evaluation of Alternate
Wetting and Drying Irrigation in Paddy Fields
by Considering Monitored Soil Moisture. Paper
presented at the Soil Moisture Workshop 2011,
Tokyo, 22 December
ArifC, Setiawan BI. Mizoguchi M, Doi R (20 12a)
Estimation of Water Balance Components in
Paddy Fields under Non-Flooded Irrigation
Regimes by using Excel Solver. Journal of
Agronomy II (2):53-59.
doi:1 0.3923/ja.20 12.53.59
ArifC. Setiawan BI, Mizoguchi M, Doi R, Saptomo SK,
Ardiansyah., Ito T (20 11 b) Field etwork
System to Monitor Paddy Fields in the System
of Rice Intensification in Indonesia. Paper
presented at the CIGR 20 I1 conference on
Sustainable Bioproduction, Tokyo, 19-23
September
ArifC, Setiawan BI, Sofiyuddin HA, MartiefLM.
Mizoguchi M, Doi R (20 12b) Estimating Crop
Coefficient in Intermittent Irrigation Paddy
Fields Using Excel Solver. Rice Science 19
(2): 143-152. doi: 10.10 16/s
1672-6308( I2)60033-x
Barison J, UphoffN (2011) Rice yield and its relation to
root growth and nutrient-use efficiency under
SRI and conventional cultivation: an evaluation
in Madagascar. Paddy Water Environ 9 (I
):65-78. doi: I 0.1007/s I 0333-0 I 0-0229-z
Barker R, Dawe D, Tuong TP, Bhuiyan SI, Guerra LC
(2000) The outlock for water resources in the
year 2020: challenges for research on water
management in rice production. International
Rice Commission ewsletter 49:7-21
Bouman BAM, S.Peng., Castaneda AR, Yisperas RM
(2005) Yield and water use of irrigated tropical
aerobic rice systems. Agr Water Manage
74:87-105. doi: 10. 10 I 6/j.agwat.2004. I 1.007
Chapagain T, Yamaji E (2010) The effects of irrigation
method, age of seedling and spacing on crop
performance, productivity and water-wise rice
production in Japan. Paddy Water Environ 8
(I ):81-90. doi: I 0.1007/s 10333-009-0187-5
Choi JD, Park WJ, Park KW, Lim KJ (2012) Feasibility
of SRI methods for red uction of irrigation and
NPS pollution in Korea. Paddy Water Environ
published on line by Springerlink Feb. 9.
doi:10.1007/s10333-012-0311-9
Dobermann A (2004) A critical assessment of the
system of rice intensification (SRI). Agr Syst
79 (3):261-281.
doi:10.1016/S0308-521 x(03)00087-8
Doorenbos J, Kassam AH (1979) Yield response to
water. FAO Irrigation and Drainage Paper 33.
FAO, Rome
Goldberg DE (1989) Genetic algorithms in search
optimization and machine learning.
Addison-Wesley, Reading, Massachusetts
Hameed KA, Mosa AKJ, Jaber FA (2011) Irrigation
water reduction using System of Rice
Intensification compared with conventional
cultivation methods in Iraq. Paddy Water
Environ 9 (1):121-127.
doi:10.1007/sI0333-010-0243-1
Hashimoto Y (1997) Applications of artificial neural
networks and genetic algorithms to agricultural
systems. Comput Electron Agr 18 (2-3):71-72
Jalota SK, Sood A, Chahal GBS, Choudhury BU (2?06)
Crop water productivity of cotton (Gossypium
PAWEES 2012 International Conference
Challenges of Water
tsrqponmlkjihgfedcbaZYXWVUTSRQPONMLKJIHGFEDCBA
& Environmental Management In Monsoon Asia 27-29 member 2012. Ihailandsystem as influenced by deficit irrigation, soil
texture and precipitation. Agr Water Manage
84 (1-2):137-146. doi:DOI
10.1016lj.agwat.2006.02.003
Jensen ME, Burman RD, Alien RG (1990)
Evapotranspiration and Irrigation Water
Requirements. The American Society of Civil
Engineers. ew York,
Ko J, Piccinni G (2009) Corn yield responses under crop
evapotranspiration-based irrigation
management. Agr Water Manage 96
(5):799-808. doi:DOI 10.1 016/j.agwat.2008.1 O.OlD
Kumar KYK, Yellareddygari SK, Reddy MS, Kloepper
JW, Lawrence KS, Zhou XG, Sudini H, Groth
DE. Raju SK, MillerMILLER7 ME (2012)
Efficacy of Bacillus subtilis MBI 600 Against
Sheath Blight Caused by Rhizoctonia solani
and on Growth and Yield of Rice. Rice Science
19 (1):55-63.
ONMLKJIHGFEDCBA
d o i : 1 0 . 1 0 1 6 / S 1 6 7 2-6308( 12)60021-3,
Kuo SF. Merkley GP. Liu CW (2000) Decision support
for irrigation project planning using a genetic
algorithm. Agr Water Manage 45 (3):243-266
Lin XQ, Zhu OF, Lin XJ (20 11) Effects of water
management and organic fertilization with SRI
crop practices on hybrid rice performance and
rhizosphere dynamics. Paddy Water Environ 9
(I ):33-39. doi: I 0.1 007's 10333-0 I 0-0238-y
Mohan S, Arumugam "'l(1994) Irrigation crop
coefficient for lowland rice. Irrigation and
Drainage Systems 8: 159-176.
doi: 10.10071BF00881 016
Raju KS, Kumar ON (2004) Irrigation planning using
Genetic Algorithms. Water Resour Manag 18
(2): 163-176
Sato S, Yamaji E, Kuroda T (2011) Strategies and
engineering adaptions to disseminate SRI
methods in large-scale irrigation systems in
Eastern Indonesia. Paddy Water Environ 9
(l ):79-88. doi: I 0.10 0 7 / s 10333-0 I 0-0242-2
Sheehy JE, Peng S, Dobermann A, Mitchell PL, Ferrer
A, Yang JC, Zou YB, Zhong XH, Huang JL
(2004) Fantastic yields in the system of rice
intensification: fact or fallacy? Field Crop Res
88 (1): 1-8. doi: I 0.1 01 6 / j .fcr.2003.12.006
Shih SF (1987) Using crop yield and evapotranspiration
relations for regional water requirement
estimation Water Resour Bull 23 (3):435-442.
doi:10.lllllj.1752-1688.1987.tb00821.x
Shih SF, Rahi GS, Snyder GH, Harrison DS, Smajstrla
AG (1983) Rice Yield, Biomass, and
Leaf-Area Related to Evapo- Transpiration. T Asae
26 (5):1458-1464
Sinclair TR, Cassman KG (2004) Agronomic UFOs.
Field Crop Res 88 (I ):9-10.
doi: I 0.1 01 6 / j . f c r . 2 0 0 4 . 0 1.00 I
Suhardiyanto H, Arif C, Setiawan BI (2009)
Optimization of EC Values of Nutrient
Solution for Tomato Fruits Quality in
Hydroponics System Using Artificial Neural
Network and Genetic Algorithms. ITB J Sci 41
A (I ):38-49. doi:1 0 . 5 6 1 4 / i t b j . s c i . 2 0 0 9 . 4 1 . 1 . 3
Thomas V, Ramzi AM (20 11) SRI contributions to rice
production dealing with water management
constraints in northeastern Afghanistan. Paddy
Water Environ 9 (I): I 0 I-I 09.
doi: I 0.10 0 7 / s I 0333-0 I 0-0228-0
Tyagi NK, Sharma DK, Luthra SK (2000)
Determination of evapotranspiration and crop
coefficients of rice and sunflower with
Iysimeter. Agr Water Manage 45 (I ):41-54.
doi: I 0.10 1 6 / S 0 3 7 8 - 3 7 7 4 ( 9 9 ) 0 0 0 7 1 - 2
UphoffN, Kassam A, Harwood R (2011) SRI as a
methodology for raising crop and water
productivity: productive adaptations in rice
agronomy and irrigation water management.
Paddy Water Environ 9:3-11.
doi: 10.10 0 7 / s I 0333-0 I 0-0224-4
Van der Hoek W, Sakthivadivel R, Renshaw M, Silver
JB, Birley MH, Konradsen F (200 I) Alternate
wet/dry irrigation in rice cultivation: a pratical
way to save water and control malaria and
Japanese encephalitis? Research Report 47.
International Water Management Institute,
Colombo, Sri Lanka
Vu SH, Watanabe H, Takagi K (2005) Application of
FAO-56 for evaluating evapotranspiration in
simulation of pollutant runoff from paddy rice
field in Japan. Agr Water Manage 76 (3):
195-210. doi: I 0.1 0 16/j.agwat.2005.0 1.012
Wardlaw R, Bhaktikul K (2004) Application of genetic
algorithms for irrigation water scheduling. lrrig
Drain 53 (4):397-414. doi:Doi 10.1002IIrd.121
Zawawi MAM, Mustapha S, Puasa Z (20 I 0)
Determination of water requirement in a paddy
field at seberang perak rice cultivation area.
Journal - The institution of Engineers 71
(4 ):32-41
Zeng LH, Lesch SM, Grieve CM (2003) Rice growth
and yield respond to changes in water depth
and salinity stress. Agr Water Manage 59
(I ):67-75
Zhang B, Yuan SQ, Zhang JS, Li H Study of corn
optimization irrigation model by genetic
algorithms. In: JFfP International Federation
for Information Processing, 2008. Springer, pp
121-132. doi: 10.10 0 7 / 9 7 8 - 0 - 3 8 7 - 7 7 2 5 1-6 14
Zhao LM, Wu LH, Wu MY, Li YS (2011) Nutrient
uptake and water use efficiency as affected by
modified rice cultivation methods with reduced
irrigation. Paddy Water Environ 9 (I ):25-32.