THE IMPACT OF INVESTOR SENTIMENT-BASED EQUITY MUTUAL FUND ON EXCESS RETURN AND VOLATILITY
PERIOD JANUARY 2011 – DECEMBER 2014
J. Sukmawati Sukamulja, M.M., Dr., Prof. Yessica Rehulina Sembiring
International Business Management Program Faculty of Economics University Atma Jaya Yogyakarta
Abstract
The objective of this research is to analyze the impact of investor sentiment-based equity mutual fund on excess returns and volatility in Indonesia Stock Exchange (IDX) from January 2011 to December 2014. Stationarity test of Augmented Dickey-Fuller is used as basic test for a non-stationarity of each variable used, the mean model developed by Autoregressive Moving Average (ARMA) model with using Least Square method will result of mean model will be used to get the residual value to examine the homogeneity of residual variability, and to check there is non-homogeneity variance of mean model through time series plot of the residual data, the researcher will use ARCH-Effect Test. The final step is GARCH (1,1) Model Test to indicate the behavior of time series data has inconstant residual variance from time to time and contaminated by heterokedasticity because there are error variance that depend on previous error volatility. The result of GARCH (1,1) conclude that the data used the measure excess returns significantly contains ARCH and GARCH elements. Higher volatility in the markets does seem to have a positive effect on the returns since there is significant proof of positive volatility feedback which is for excess return. It is observed that there is a strong relationship between investor sentiment and market returns. This result is according to the probability value RESID(-1)^2 and GARCH(-1) are less than 5%, which are the probability value of RESID(-1)^2 and GARCH(-1) as much as 0.0000.
INTRODUCTION
The development of capital market in addition to increasing the source of funding outside the banking community is also a potential funding for companies that need funds over the medium and long-term, while for the community the precense of capital market as an additional alternative for investing. Capital market in Indonesia run two function simultaneously, namely the economic function and finance function. Performing economic function with allocated the fund efficiently from parties who have excess funds (investors) to the company listed in the capital market (issuer). Whereas the finance function of capital market is presented by the possibility and opportunity of getting returns for investors in accordance with the character of investments that will be selected.
As one of the instruments of the economy, the stock market always affected by several events on its environment, such as events that occur due to macroeconomic policy, monetary policy, fiscal policy, and government regulation both in real and financial sector. The Indonesian Stock Exchange (IDX) witnessed solid growth over the past five years, both in terms of the number of issuers and their combined market capitalization, but it remains highly dependent on global sentiment. Its future performance will hinge on global risk appetite, but also on economic adjustments and fiscal policies at home. According to Global Business Guide Indonesia (2015), IDX listed 459 companies with a total capitalization of $414 billion (4,126.99 trillion IDR) at the end of 2012, up from 396 listings valued at $108 billion (1,076.49 trillion IDR) four years earlier. The investment grade ratings bestowed on Indonesian sovereign debt by rating agencies Fitch and Moody’s in late 2011 and early 2012 supported market sentiment. Reflecting overall healthy earnings and strong economic growth, IDX’s key gauge, the Jakarta Composite Index (JCI), more than tripled in the years 2009 through 2012 and continued to rally in early 2013.
Global investment companies, therefore, are reassessing opportunities to manage Indonesians' growing wealth. While unfavourable regulations have been cited as one of the reasons for the cautious approach foreign fund operators have been taking on the Indonesian market so far, the long-term potential appears to be immense amid rising demand from individual and institutional investors.
One type of mutual fund is a equity mutual fund. Equity funds are mutual funds that at least 80% of the portfolio is managed in stock (usually stock companies). Equity funds generally provide the potential for higher returns in the form of capital gains (the difference between buying and selling price) through the growth of stock prices and dividends. Equity funds typically usually have considerable potential for big returns can be up to 20% a year and has a large potential risks.
incorporated the existence of noise traders into equilibrium asset pricing (e.g., Black, 1986 and De Long et al., 1990), the empirical evidence for a correct proxy to quantify sentiment has not provided clear findings.
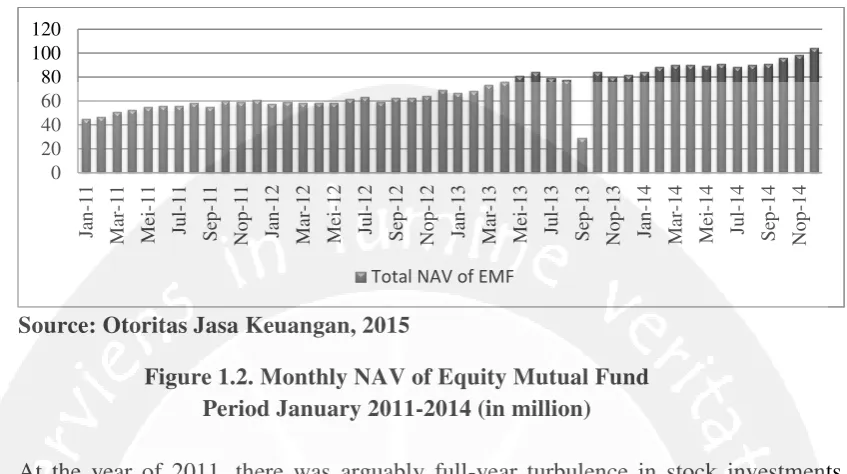
Source: Otoritas Jasa Keuangan, 2015
Figure 1.2. Monthly NAV of Equity Mutual Fund Period January 2011-2014 (in million)
At the year of 2011, there was arguably full-year turbulence in stock investments. Ranging from the price of oil in the Middle East, the U.S. rating up to economic development and European debt became a major factor of uncertainty. As a result a surge or decline in the share price of 3-4% in a day seems to be the usual views. Stock investors ' reaction also varies, there is a fixed buy and hold, there is also a cut loss while looking at the situation. This condition causes some investors are using stock mutual funds as a tool for seeking short-term profits. That means even though mutual funds are designed as a long-short-term instrument, but when the market goes down many investors will make an investment and then sell it when the market rises despite not too long ago purchased. This lesson makes investors assume when there is a downturn; it is the right time to make a purchase. It can implicate that investors still has beliefs with Indonesia condition that occur in increasing of mutual fund can affect to the development of Indonesia Capital Market.
LITERATURE REVIEW Investor Sentiment
Investor sentiment is defined as an aggregate measure of investors’ attitude toward market conditions and is generally categorized as bullish, bearish or neutral. The literature on investor sentiment generally examines investors’ perceptions and effect on the market independent of risk considerations. Often nested within literature discussing the effects of “noise traders” or irrational investors, investor sentiment studies generally either supports of refute whether non risk related measures have the ability to change some fundamental aspect of a security such as price.
Measurement of Sentiment Indicator
Several financial variables have been used to measure investor sentiment. Brown and Cliff (2004, 2005) for example, scrutinize various presumed indirect and direct indicators. For direct indicators, Lee et al. (2002) use the sentiment index provided by Investors’ Intelligence
0 20 40 60 80 100 120 Jan -1 1 Ma r-1 1 Me i-1 1 Ju l-1 1 Sep -1 1 No p -1 1 Jan -1 2 Ma r-1 2 Me i-1 2 Ju l-1 2 Sep -1 2 No p -1 2 Jan -1 3 Ma r-1 3 Me i-1 3 Ju l-1 3 Sep -1 3 No p -1 3 Jan -1 4 Ma r-1 4 Me i-1 4 Ju l-1 4 Sep -1 4 No p -1 4
of New Rochelle in New York as a proxy for investor sentiment. Investors’ Intelligence takes a poll of 135 investments advisory service every week and produces there numbers – bullish, bearish, and correction. Indirect sentiment indicators are determined by looking at objective variables that implicitly indicate investor sentiment. Although the theoretical link to investor is weaker, they circumvent the lack sample size and statistical representativeness (which and how many subject participate in surveys) of the direct measurement. In addition, measure of indirect sentiment can often be obtained at higher (e.g. daily) frequencies.
Equity Mutual Fund
According to Infovesta (Infovesta.co.id, 2015) and Investopedia (Investopedia.com, 2015), A stock fund or equity fund is a fund that invests in stocks, also called equity securities. Equity funds can be contrasted with bond funds and money funds. Fund assets are typically mainly in stock, with some amount of cash, this is generally quite small, as opposed to bonds, notes, or other securities. This may be a mutual fund or exchange-traded fund. The objective of an equity fund is long-term growth through capital gains, although historically dividends have also been an important source of total return. Specific equity funds may focus on a certain sector of the market or may be geared toward a certain level of risk.
Net Asset Value (NAV)
Chay andnTrzcinka (1999) explore the possibility that discounts reflect the rational pricing of future expected NAV performance. For a sample of 94 stock funds in the U.S. market up to December 1993, and in contrast to previous research, they find a significant and positive correlation between the premium and subsequent NAV returns at horizons up to a year. They find no such correlation in a sample of 22 bond funds. They conclude that discounts on stock funds incorporate perceptions of managers’ abilities, which under rational expectations would emerge in future NAV returns.
Where:
= Return of Equity Mutual Fund
= Net Asset Value present time
= Net Asset Value previous time
Excess Return
Excess return is the rate of return that exceeds what was expected or predicted by models like the capital asset pricing model (CAPM). To understand how it works, consider the CAPM formula (Investopedia, 2015):
r = Rf + beta * (Rm - Rf ) + excess return Where:
r = the security's or portfolio's return Rf = the risk-free rate of return
eta = the security's or portfolio's price volatility relative to the overall market Rm = the market return
Volatility
within the confidence intervals of proxy of actual volatility implying that GARCH models are not wholly inadequate measures of actual volatility.
RESEARCH METHODOLOGY
The data that used in this research is secondary data; it means that the data gathered from another party which did not directly obtain from the subject of the observation. The method that will be used in the data gathering is library research by reading some books and journals in order to deeper knowledge about the problems related to the research topic. Other sources of information to support theoretical review are also accessed and compiled from the Internet. The following lists stated the source of the secondary data used in this research:
a. The weekly return Net Asset Value on Equity Mutual Fund b. The weekly data of market index Jakarta Composite Index (JCI) c. The data of SBI to proxy the risk-free rate interest rate
Method Analysis
a. Excess Return of Jakarta Composite Index (JCI)
In this research, the formula to calculate the excess return is as follows (Chuang et al., 2010):
………...(1)
Where:
ER = Excess Return = Market Return
= The Risk-free rate
b. Market Return of Jakarta Composite Index (JCI)
The weekly return on JCI can be obtained by calculating the value of natural logarithm (ln) from the ending weekly of market index with this formula (Chuang et al., 2010):
[
]………...…(2)
Where:
= Market return
= Ending weekly market index at time t
= Ending weekly market index at time t-1
c. Investor Sentiment-Based Equity Fund (Net Asset Value/NAV)
The research uses return of Net Asset Value (NAV) from equity fund to be the measurement of investor sentiment. The formula is as follows (Samsul, 2006):
………...………..…(3)
Where:
= Return of Equity Mutual Fund
= Net Asset Value present time
= Net Asset Value previous time
d. The Model of the Research
...(4)
Where:
= The weekly return on Jakarta Composite Index (JCI)
= The risk-free rate
= the excess return
= the weekly return on Net Asset Value (NAV) Empirical Procedure and Hypothesis
a. Determine the hypothesis in this research of study The hypothesis raised in this research is as follows:
Ho = The investor sentiment-based equity mutual fund does not affect the excess return and volatility in Indonesia Stock Exchange (IDX) from the period January 2011 to December 2014.
Ha = The investor sentiment-based equity mutual fund affects the excess return and volatility in Indonesia Stock Exchange (IDX) from the period January 2011 to December 2014.
b. Determine the significant level of alpha (α)
This research study is using significant level of 5% (α=5%) c. Data Behavioral Test
a. Stationary Test
Stationary test conducted to determine whether OLS method can be used, because one of requirements of using OLS method for time series data is that data must be stationary (Gujarati, 2003). Time series data is called stationary if the mean and variance of the data are constant over time and the value of covariance between two periods only depends on the lag between those two time periods, rather than relying on real time when counted covariance (Sugiri, 2000). This research will use Unit Root Test to see the stationary of data. Degree of integration test will be used if the data is not yet stationary at the degree level (zero).
1) Unit Root Test
Unit root test is needed to see whether the data used is stationary (non-stochastic) or not stationary ((non-stochastic). Stationary data is time series data that do not contain unit roots, and vice versa.
Dickey-Fuller developed unit root test with entering autocorrelation elements in the model that is known as Augmented Dickey-Fuller (ADF) test. In practice, Augmented Dickey-Fuller (ADF) test is often used to detect whether the data is stationary or not. The formula of ADF test is as follows (Widarjono, 2005):
∑ ...(5)
d. Mean Model Analysis
Every model with a variance that is not homogenous is composed by two components, namely the mean model and variance model. The mean model is prepared based on early identification. The form of the mean model can be a regression model, autoregressive model (AR), ARMA, model, constant, and etc.
Variance model stated the relationship between error variance at time t with the large of error square at the previous time and variance error at the previous time. If the variance model only entering error square it is known as ARCH model. But, if the variance model also include error variance of the previous time, referred as GARCH model.
In this research, the mean model developed by Autoregressive Moving Average (ARMA) model with using Least Square method. The result of mean model will be used to get the residual value to examine the homogeneity of residual variability.
e. Residual Evaluation of the Mean Model
After the mean model is determined, the next step is to check whether there is non-homogeneity variance of mean model through time series plot of the residual data. a. ARCH Effect Test
To examine the ARCH effect in the model, Engle developed the test to examine heterokedasticity problems in time series data. This test is known as langrange multiplier test or ARCH LM test. The basic idea of this test is the residual variance (σ2t) not only the function of independent variable, but also depends on Residual Square of the previous period (σ2
t-1) or can be written as follows (Widarjono, 2005):
...(6)
Manually, if the probability value of Obs*R2 is less that the significant value (5%), so it means that the model contains of ARCH effect. If there are ARCH effects in the model, so the estimation performed by ARCH/GARCH model. f. GARCH (1.1) Model Test
In the research that using time series data, especially for financial market fields, usually the data has a high level of volatility and showed by the phase where the fluctuations always change quickly. The volatility data condition indicates that the behavior of time series data has inconstant residual variance from time to time and contaminated by heterokedasticity because there are error variance that depend on previous error volatility. But sometimes, error variance is not always depending on the independent variables, but also that variance will change with the time simultaneously. So, it requires a model to handle volatility data in the research model. One of the model is ARCH/GARCH model that developed by Engle (1982) and Bollerslev (1986). Engle was the first person that analyzed the heterokedasticity problems from the residual variance of time series data. According to Engle, the model that assumes the residual variance is not constant in the time series called autoregressive conditional heterokedasticity (ARCH)
...(7)
Then the ARCH model by Engle was completed by Bollerslev (1986). According to Bollerslev, error term variance is not just depending on error term in previous period, but also error term variance in previous period. This model known as generalized autoregressive conditional heterokedasticity (GARCH). In general the equalization of GARCH model with GARCH (p,q) is as follows (Widarjono, 2005):
...(8)
In the model, p indicates the element of ARCH, and q indicates the element of GARCH. As ARCH model, GARCH model also cannot be estimated with OLS, but with the maximum likelihood (MLE) method.
After LM test performed the next step is GARCH analysis of the data with performing analysis to estimate parameter of the mean model and variance model simultaneously. The next step is determined GARCH with ordo p=1 and q=1 (GARCH 1.1) and examine whether this model can lead to the conclusion that these parameters are significant at the significant level less that 5%
Null hypothesis (Ho) on GARCH (1.1) model stated that the residual variance is constant, or in other words, the residual variance is not affect by residual on previous period (ARCH elements) and residual variance on previous period (GARCH elements). If the result of GARCH 1.1 model test is Ho is not supported, it means that the model contains GARCH.
DATA ANALYSIS
Table 4.1
Descriptive Analysis of Return of Equity Mutual Fund and Excess Return
REMF ER
Mean 0.002672 0.057220 Median 0.003490 0.057440 Maximum 0.325495 0.169401 Minimum -0.244289 -0.015850 Std. Dev. 0.047547 0.026292 Skewness 1.515916 0.378494 Kurtosis 27.57642 4.741110
Jarque-Bera 5212.136 30.63821 Probability 0.000000 0.000000
Sum 0.545025 11.67295 Sum Sq. Dev. 0.458933 0.140326
Table 4.2
The Result of ADF Test on Excess Return
t-Statistic Prob.*
Augmented Dickey-Fuller test statistic -7.692067 0.0000 Test critical values: 1% level -3.462737
5% level -2.875680 10% level -2.574385
*MacKinnon (1996) one-sided p-values. (*) significant at 5% level
Source: Appendix B
Table 4.3
The Result of ADF Test on Sentiment Proxy
t-Statistic Prob.*
Augmented Dickey-Fuller test statistic -24.18183 0.0000 Test critical values: 1% level -3.462574
5% level -2.875608 10% level -2.574346
*MacKinnon (1996) one-sided p-values. (*) significant at 5% level
Source: Appendix C
Table 4.4
The Result of Mean Model Analysis
Variable Coefficient Std. Error t-Statistic Prob.
C 0.057604 0.001795 32.09440 0.0000 REMF -0.152024 0.043302 -3.510763 0.0006
Source: Appendix E
Figure 4.1
Time Series Residual Plot Data
Table 4.5 ARCH LM Test
Heteroskedasticity Test: ARCH
F-statistic 0.633380 Prob. F(1,201) 0.4271 Obs*R-squared 0.637673 Prob. Chi-Square(1) 0.4246
Source: Appendix F
Table 4.6
GARCH (1.1) Model Test
Variable Coefficient Std. Error z-Statistic Prob.
C 0.057482 0.001875 30.65965 0.0000 REMF -0.135180 0.038907 -3.474436 0.0005
Variance Equation
C 8.61E-05 5.52E-05 1.559424 0.1189 RESID(-1)^2 0.124951 0.061604 2.028297 0.0425 GARCH(-1) 0.740785 0.123607 5.993073 0.0000
Source: Appendix G -.08
-.04 .00 .04 .08 .12
-.05 .00 .05 .10 .15 .20
25 50 75 100 125 150 175 200
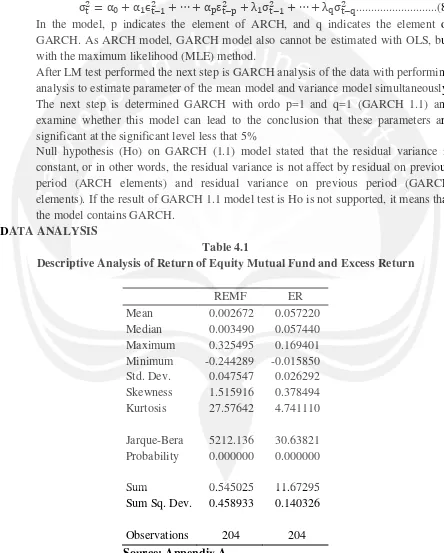
From the descriptive statistic on Table 4.1 shows that during the period of investigation which is from January 2011 to December 2014, the mean of return of equity mutual fund and excess returns are 0.2672% and 5.7220% which indicates the return of equity mutual fund and excess return in Indonesia Stock Exchange has positive average during that period. It can be seen in the following Figure 4.1 that the pattern of investor sentiment and excess returns movements during January 2011 to December 2014 mostly are above zero or on positive average. It reflects that the investor in Indonesia Stock Exchange is on bullish sentiment and almost gain excess returns during the research period.
Source: Appendix H
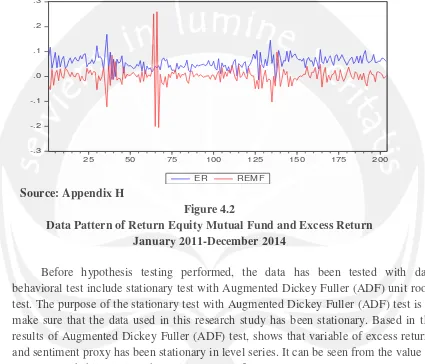
Figure 4.2
Data Pattern of Return Equity Mutual Fund and Excess Return January 2011-December 2014
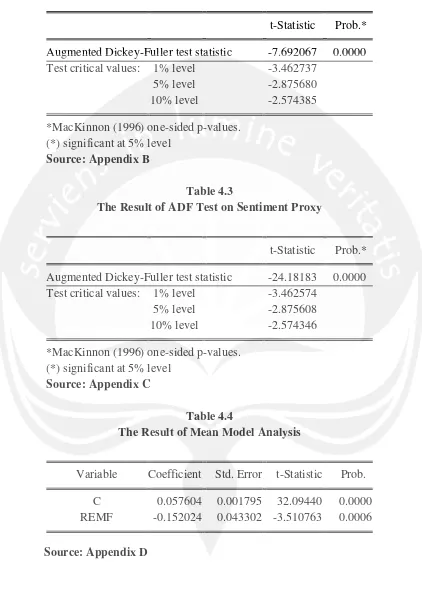
Before hypothesis testing performed, the data has been tested with data behavioral test include stationary test with Augmented Dickey Fuller (ADF) unit roots test. The purpose of the stationary test with Augmented Dickey Fuller (ADF) test is to make sure that the data used in this research study has been stationary. Based in the results of Augmented Dickey Fuller (ADF) test, shows that variable of excess returns and sentiment proxy has been stationary in level series. It can be seen from the value of ADF test probability is less than critical value of 5%.
Table 4.4 shows the result of mean model analysis. From the output of mean equation, it can be seen that the probability value of sentiment proxy (RMF) is less than 0.05, it means that the investor sentiment which measured by return of equity mutual fund is affecting the excess returns in Indonesia stock market.
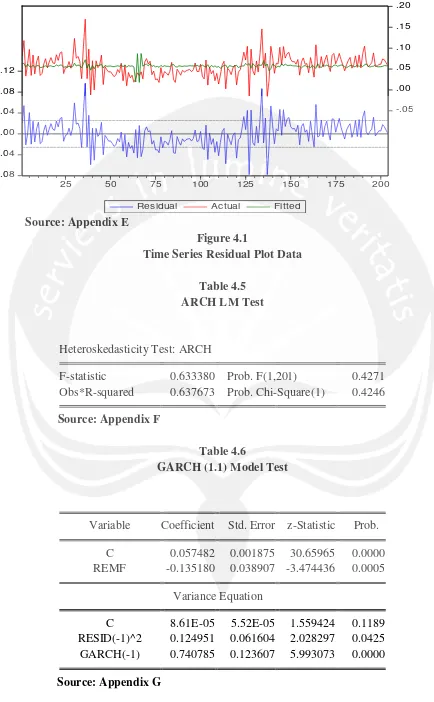
According to Figure 4.1 of time series residual plot data of mean model, it can be seen that there is non-homogeneity variance from the residual of mean model or there is heterokedasticity problems on the residual variance. It shows that the variables used in this research, which are market index and return of equity mutual fund have high volatility.
Based on LM test of the residual, the date contains heterokedasticity. It is shown in Table 4.5 of ARCH LM test that the result of LM test on lag 1 shows the probability
-.3 -.2 -.1 .0 .1 .2 .3
25 50 75 100 125 150 175 200
value of Obs*R-squared 0.4246 is greater than 0.05, and it shows that there is a problem of heterokedasticity. It indicates that the ARCH model is not appropriate model for the analysis.
For GARCH (1.1) model, the probability value RESID(-1)^2 and GARCH(-1) are less than 5%, which are the probability value of RESID(-1)^2 and GARCH(-1) as much as 0.0000. It means that the data used the measure excess returns significantly contains ARCH and GARCH elements. Higher volatility in the markets does seem to have a positive effect on the returns since there is significant proof of positive volatility feedback which is for excess return. It is observed that there is a strong relationship between investor sentiment and market returns. Higher investor sentiment has a negative effect on returns putting pressure on the prices because noise traders participate more during high sentiment periods.
It also creates conditional volatility which relates to the notion that noise traders increase risk by their own trading and are rewarded for the risk. The effect entails that when the variability in noise traders’ belief increases, this increases the volatility of the market. So, the equity mutual fund can significantly impact to the volatility of excess return.
a. Hypothesis Testing
The result of Generalized AutoRegressive Conditional Heterokedasticity (GARCH) shows that the residual variance is not constant or not consistent over time. This inconsistency also supported by the result of mean model analysis that the probability value of sentiment proxy is greater than 0.05 and it can be concluded that Ho is not supported which mean that the investor sentiment which measured by return of equity mutual fund is affecting excess return in Indonesia Stock Exchange (IDX) during research period. From the Table 4.6, both coefficient of C and RESID(-1)^2 are positive and providing “hold more” effect which relates to the hypothesis that noise traders hold proportionately more of the risky asset that the sophisticated fundamentalists, when bullish on average. Since noise traders bear more of the risk in the market, they also expect a higher return. On the other hand when average sentiment is bearish, noise traders hold less of the risky asset and therefore require a lower expected return. If this hypothesis holds, the researcher expects to see a positive relationship between excess return and investor sentiment.
In this research, the researcher found investor sentiment-based on equity mutual fund has significant impact to volatility. The volatility can be checked in the Table 4.6 which conclude positive coefficient. The result also conclude that the coefficient of GARCH(-1) is positive for conditional volatility. That provides the “create space” effect, relates to the notion that noise traders increase risk by their own trading and are rewarded for the risk. The effect entails that when the variability in noise traders’ belief increases, this increases the volatility of the market. This increased the variability in noise traders’ beliefs scares away sophisticated traders in the market and therefore increases the expected return to the noise traders.
contrary with previous research conducted by Peng et al. (2006) who found there is no impact between equity mutual fund and the excess return and volatility.
CONCLUSION AND RECOMMENDATION Conclusions
From the result of this research study on the impact of sentiment investor-based on equity mutual fund on excess return, the conclusions that can be pointed out are as follows:
1. Investor sentiment-based equity mutual fund and Excess return are stationary in level stage because the probability value is lower than 0.05. From the mean model analysis, the investor sentiment is affecting excess return and volatility because the probability of investor sentiment is less than 0.05.
2. This result does not support Ho (null hypothesis) where the investor sentiment (which is measured by return of equity mutual fund) is not affecting the excess return in Indonesia Stock Exchange (IDX), but this research study does support Ha (alternative hypothesis) where the investor sentiment affects the excess return in IDX. It means return of equity mutual fund can be used as a proxy for investor sentiment to gain excess returns. The return of equity mutual fund can provide some information about investors’ behavior.
3. This result provides “hold more” effect which relates to the hypothesis that noise traders hold proportionately more of the risky asset that the sophisticated fundamentalists, when bullish on average. Since noise traders bear more of the risk in the market, they also expect a higher return. On the other hand when average sentiment is bearish, noise traders hold less of the risky asset and therefore require a lower expected return. This result is also providing the “create space” effect, relates to the notion that noise traders increase risk by their own trading and are rewarded for the risk. The effect entails that when the variability in noise traders’ belief increases, this increases the volatility of the market.
Research Limitations
After done with analysis and interpretation, this research study has several limitations, there are:
1. The researcher only use four years as the simple data periode, which is from 2011-2014. Larger period of time will be better to get better result.
2. The forecast accuracy might be needed to be improved long-term forecast.
4. There are many indicators outside that can be used as a proxy of investor sentiment. This research only used equity mutual fund as the indicator.
Recommendation
Several things could be taken as consideration for the next research on related issues. So, the suggestions that can be gives based on the result of this research study are:
1. In this study, the researcher use equity mutual fund as a proxy for investor sentiment. For the further research can use another proxy for investor sentiment such as investor survey, investor moods, retail investor trades, mutual fund flows, dividend premium, close-end fun discount, IPO first-day returns, IPO volume, new equity issues, and insider trading.
2. For the next reseacher, hopefully can adapt another type of GARCH, such as EGARCH, ARCH-Mean, or TGARCH.
3. For the future research, better to use a longer research period, so that the result of the research will better reflect the impact of investor sentiment on excess returns. Implication for the future research study with similiar topic can be cosidered to the limitations in this research which are the additions of other investor sentiment proxy or modifications of others variables to be analyzed in the same roof. Another wider research is also possible to be conducted by using this research as a benchmark.
REFERENCES
Arik, Ali. (2011), “Modeling Market Sentiment and Conditional Distribution of Stock Index Returns under GARCH Process”, Claremont Graduate University.
AYDOĞAN B., VARDAR G., TUNÇ G. (2014), “The Interaction of Mutual Fund Flows and Stock Returns: Evidence From The Turkish Capital Market”, EGE ACADEMIC REVIEW, Cilt: 14 Sayı: 2, ss. 163-173.
Basu, S. (1977). “Investment Performance of Common Stock in Relation to their Price-EarningsRatios: A Test of Efficient Market Hypothesis.” Journal of Finance. Vol. 32, pp. 663-683
Beaumont, R., Van Daele, M., Frijns, B., Lehnert, T., Muller, A. “Investor sentiment, mutual fund flows and its impact on returns and volatility.” Managerial Finance Vol. 34 No. 11, 2008 pp. 772-785
Beer, F., Zouaoui, M. (2013), “Measuring Stock Market Investor Sentiment”. The Journal of Applied Business Research. Vol. 28, Number 1.
Bollerslev, T. and Wooldridge, J.M. (1992), “Quasi-maximum likelihood estimation and inference in dynamic models with time varying covariance”, Econometrics Review, Vol. 11, pp. 143-72.
Brown, S.J., Goetzmann, W.N., Hiraki, T., Shiraishi, N. and Watanabe, M. (2002), “Investor sentiment in Japanese and US daily mutual fund flows”. Yale ICF Working Paper No. 02-09, AFA 2003,Washington, DC Meetings.
Brown, G.W. and Cliff, M.T. (2004), “Investor sentiment and the near-term stock market.”
Journal of Empirical Finance, Vol. 11, pp. 1-27.
Brown, G.W. and Cliff, M.T. (2005), “Investor sentiment and asset valuation”, Journal of Business, Vol. 78, pp. 405-40.
Chay, J.B., and Trzcinka, C.A. (1999). “Managerial performance and the cross-sectional pricing of closed-end funds.” Journal of Financial Economics. 52: 379-408.
Chuang, W., Ouyang, L., and Lo, W., (2010). The Impact of Investor Sentiment on Excess Return: A Taiwan Stock Market Case. International Journal of Information and Management Science. Vol. 21, pp. 13-28.
De Long, J.B., Shleifer, A., Summers, L.G. and Waldman, R.J. (1990), “Noise trader risk in financial markets”, Journal of Political Economy, Vol. 98, pp. 703-38.
Elton, E.J., Gruber, M.J. and Busse, J.A. (1998), “Do investors care about sentiment?”,
Journal of Business, Vol. 71, pp. 477-500.
Engle, R.F. (1982). “Autoregressive conditional heteroscedasticity with estimates of the variance of United Kingdom inflation.”Econometrica 50(4), 987–1007
Fama, E.F. and French, K.R. (1993), “Common risk factors in the returns on bonds and stocks”, Journal of Financial Economics, Vol. 33, pp. 3-56.
Frazzini, A. and Lamont, A., O. (2008), “Dumb Money: Mutual fund flows and the cross -section of stock return”,Journal of Financial Economic. 88 (2008) 299–322
Gujarati, Damodar N. (2003). Basic Econometrics, 4th Edition. Singapore: Mc. Graw Hill.
Goetzmann, W.N., Massa, M. and Rouwenhorst, K.G. (1999), “Behavioral factors in mutual fund flows”, Yale ICFWorking Paper No. 00-14.
Jegadeesh, N. and Titman, S. (1993), “Returns to buying winners and selling losers: implications for stock market efficiency”, Journal of Finance, Vol. 48, pp. 65-91.
Jegadeesh, N. and Titman, S. (2001), “Profitability of momentum strategies: an evaluation of alternative explanations”, Journal of Finance, Vol. 56, pp. 699-720.
Kaniel, R., Saar, G. and Titman, S. (2004), “Individual investor sentiment and stock returns”,
Working Paper, Stern School of Business, New York, NY.
Kumar, L. and Lee, C.M. (2003), “Individual investor sentiment and co-movement in small stock returns”, Working Paper, Department of Economics, Cornell University, Ithaca, NY.
Lakonishok, J. Shleifer, A., and Vishny, R. (1994). “Contrarian Investment, Extrapolaration, and Risk”. Journal of Finance. Vol 49, pp. 1541-1578.
Lee, W.Y., Jiang, C.X. and Indro, D.C. (2002), “Stock market volatility, excess returns, and the role of investor sentiment”, Journal of Banking and Finance, Vol. 26, pp. 2277-99.
Lee, C.M.C., Shleifer, A. and Thaler, R.H. (1991), “Investor sentiment and the closed-end fund puzzle”, Journal of Finance, Vol. 64, pp. 75-110.
Prince, T. and Bacon, F. (2007), “Analyzing Mutual Fund Performance Against Established Performance Benchmarks: A Test of Market Efficiency”, Research in Business and Economics Journal.
Samsul, Mohammad. (2006). Pasar Modal dan Manajemen Portfolio. Penerbit Erlangga
Sayim, M., Morris D. P., Rahman, H. (2013), “The effect of US individual investor sentiment on industry-specific stock returns and volatility”, Review of Behavioral Finance, Vol. 5 No. 1, pp. 58-76.
Sekaran, Uma. (2003), Research Method for Business, A Skill Building Approach. Amerika: John Wiley and Sons.
Suad, Husnan, Enny Pudjiastuti, 1993, Dasar-dasar Teori Portofolio dan Analisis Sekuritas, Yogyakarta : AMP YKPN
Swaminathan, B. (1996), “Time-varying expected small firm returns and closed-end fund discounts”, Review of Financial Studies, Vol. 9, pp. 845-87.
Warther, Vincent A. 1995. “Aggregate Mutual Fund Flows and SecurityReturns.” JOURNAL OF FINANCIAL ECONOMICS 39: 209-35
Widarjono, Agus. (2005). Ekonometrika Pengantar dan Aplikasinya. Yogyakarta. Ekonisia.
Historical Price Composite Index (^JKSE). (2015). Retrieved May 2015, from Finance Yahoo: http://finance.yahoo.com
Indonesian Capital Markets – Local Funds in Prime Position. (2015). Retrieved May 2015, from Global Business Guide Indonesia: http://www.gbgindonesia.com
Jenis-jenis Reksadana. (2015). Retrieved May 2015, from Infovesta: http://www.infovesta.com/
Lelang Sertifikat BI. (2015). Retrieved May 2015, from Bank Indonesia: http://www.bi.go.id/
Mutual Funds: Different Types Of Funds. (2015). Retrieved May 2015, from Investopedia: http://www.investopedia.com
Overview of Indonesia's Mutual Fund Industry. (2015). Retrieved May 2015, from Global Business Guide Indonesia: http://www.gbgindonesia.com