ISSN 2040-3364
www.rsc.org/nanoscale Volume 5 | Number 8 | 21 April 2013 | Pages 3085–3528
2040-3364(2013)5:8;1-G
COMMUNICATION Petr Cigler et al.
Boosting nanodiamond l uorescence: towards development of brighter probes
Downloaded on 02/04/2013 00:40:11.
Published on 28 March 2013 on http://pubs.rsc.org | doi:10.1039/C3NR90024J
View Article Online
Polarization properties of
fl
uorescent BSA protected
Au
25nanoclusters
†
Sangram Raut,*aRahul Chib,aRyan Rich,aDmytro Shumilov,bZygmunt Gryczynskiab and Ignacy Gryczynski*ac
BSA protected gold nanoclusters (Au25) are attracting a great deal of attention due to their unique
spectroscopic properties and possible use in biophysical applications. Although there are reports on synthetic strategies, spectroscopy and applications, little is known about their polarization behavior. In this study, we synthesized the BSA protected Au25nanoclusters and studied their steady state and time
resolvedfluorescence properties including polarization behavior in different solvents: glycerol, propylene glycol and water. We demonstrated that the nanocluster absorption spectrum can be separated from the extinction spectrum by subtraction of Rayleigh scattering. The nanocluster absorption spectrum is well approximated by three Gaussian components. By a comparison of the emissions from BSA Au25clusters
and rhodamine B in water, we estimated the quantum yield of nanoclusters to be higher than 0.06. The
fluorescence lifetime of BSA Au25clusters is long and heterogeneous with an average value of 1.84ms. In
glycerol at 20C the anisotropy is high, reaching a value of 0.35. However, the excitation anisotropy
strongly depends on the excitation wavelengths indicating a significant overlap of the different transition moments. The anisotropy decay in water reveals a correlation time below 0.2ms. In propylene glycol the measured correlation time is longer and the initial anisotropy depends on the excitation wavelength. BSA Au25 clusters, due to long lifetime and high polarization, can potentially be used in studying large
macromolecules such as protein complexes with large molecular weight.
Introduction
Metal nanoclusters (Au, Ag and Cu) hold great promise in terms of biophysical applications due to their unique uorescence properties.1,2These metal nanoclusters can be used in a variety of disciplines including but not limited to catalysis, biosensing, photonics, and molecular electronics.3–6 The metallic clusters
have sizes less than 2 nm, which is comparable to the Fermi wavelength of electrons, and they bridge the gap between the behavior of metal atoms and metal nanoparticles. Owing to their small size, they do not sustain collective plasmon oscil-lations and are unable to support Surface Plasmon Resonance (SPR). Therefore their properties differ signicantly from plas-monic nanostructures. Recently nanoclusters have been synthesized with precise control over the number of atoms in
the metal core, which subsequently achieved the desired emission wavelength.7,8 Di
fferent types of capping ligands ranging from small molecules like glutathione to large molec-ular weight proteins such as BSA have been utilized to synthe-size these clusters.
Protein-stabilized Au nanoclusters (Au NCs) are receiving attention from the scientic community for their strong and tunableuorescence in the visible spectrum. Xieet al.used BSA when they introduced a facile protein directed synthesis, which was followed by many research groups for other protein–Au NC systems.9 Recently, di
fferent proteins have been used as
templates to synthesize uorescent metal nanoclusters.
Specically for Au NCs, different investigators have used BSA, HSA, lysozyme, trypsin and the ferritin family of proteins.10–13
Different ligands produce clusters with varying absorption and
emission properties due to the different number of atoms
present in the metal cluster core. There are several reports on the spectroscopic behavior of Au NCs, and some of them have been mentioned below in order to understand the mechanism of luminescence and ligand–metal core interactions.
Sakanagaet al.reported the excited energy emission bands of the Au25nanoclusters and isolated two luminescence tran-sitions, one band between 6sp states and the other excited state band between 6sp and 5d states.14 Furthermore, Jin and Wu synthesized the Au25 clusters stabilized with different ligands aCenter for Commercialization of Fluorescence Technologies, Department of Molecular
Biology and immunology, University of North Texas Health Science Center, 3500 Camp Bowie Blvd, Fort Worth, Texas, 76107, USA. E-mail: [email protected]; Ignacy. [email protected]
bDepartment of Physics, Texas Christian University, 2800 S. University Dr., Fort Worth, Texas, 76129, USA
cDepartment of Cell Biology and Anatomy, University of North Texas Health Science Center, 3500 Camp Bowie Blvd, Fort Worth, Texas, 76107, USA
†Electronic supplementary information (ESI) available. See DOI: 10.1039/c3nr34152f
Cite this:Nanoscale, 2013,5, 3441
Received 17th December 2012 Accepted 15th February 2013 DOI: 10.1039/c3nr34152f
and showed the trend of increasinguorescence intensity due to the ligand's ability to donate electron density to the Au NC surface.15Wenet al.demonstrated that BSA-protected Au
25NCs
show prompt uorescence in the nanosecond time scale and
delayed uorescence in the microsecond time scale.16 Their
ndings suggest that delayeduorescence dominates the red band due to efficient intersystem crossing owing to the very small energy gap between the singlet and the triplet states.
Moreover, another publication from Wen et al. showed that
uorescence from BSA Au25 clusters consists of two lumines-cence bands, one at 710 nm (band I) and one at 640 nm (band II).17 The temperature dependence study shows that band I originates from the metal core, whereas band II arises due to metal core–ligand interaction. These reports suggest that we do have reasonable understanding of the origin of absorption and luminescence from BSA Au25clusters.
Despite the number of publications cited above on the BSA Au25clusters ranging from synthetic strategies, spectroscopic, electronic behavior and biochemical applications, there are no reports on the polarization properties of these protein protected Au clusters. In this manuscript we have studied BSA Au25 clus-ters' steady state and time resolveduorescence and polariza-tion behavior in water, propylene glycol and glycerol. The objective of the current work is to show that BSA Au clusters show polarization behavior despite longuorescence lifetime which can be explored to our advantage in terms of developing polarization based sensing applications.
Experimental section
Synthesis of BSA Au25nanoclusters
The Au25 NCs used in this study were synthesized using an approach developed by Xieet al.9 Typically, 5 mL of 10 mM
HAuCl4was mixed with 5 mL of 50 mg mL 1BSA followed by
addition of 1 mL of 1 M NaOH and kept at 37C overnight in an incubator. The light brown solution of clusters was further dialyzed (2000 MWCO membrane) against de-ionized water for at least 12 h with periodic change of water to remove any small impurities. The dialyzed cluster solution was ltered using a 0.02mm syringelter and used for subsequent measurements.
Spectroscopic measurements
UV-Vis absorption anduorescence spectra were obtained using a Cary 50 bio UV-visible Spectrophotometer (Varian Inc.) and Cary Eclipse Spectrouorometer (Varian Inc.) respectively. All
the measurements were done in 1 cm1 cm cuvettes at room
temperature with optical density below 0.05 unless mentioned otherwise. In order to measure the quantum yield, corrected absorption spectra of BSA Au25were collected by subtracting the scattering component from BSA Au25 absorption spectra fol-lowed by measuring the integrateduorescence intensity of the
Au25 nanoclusters. A solution of rhodamine B in ethanol
(quantum yield: 0.7) was used as a reference.18The samples for anisotropy measurements were prepared using concentrated cluster stock solution in water. The amount of water in glycerol and propylene glycol was kept below 10% by volume. For steady
state emission anisotropy, the sample was excited using a 590 nm wavelength and emission was scanned from 610 nm to 800 nm using a 610 long wavelength passlter and manually operated parallel and perpendicular polarizers. For steady state excitation anisotropy, emission was observed at 700 nm and excitation was scanned from 320 nm to 620 nm, using a 320 long passlter on excitation and a 610 long passlter on the emission side. TheG
factor was measured and incorporated in the anisotropy calcu-lation using the following formula;
r¼ IVV GIVH
IVVþ2GIVH
(1)
where,Ivvis theuorescence intensity in the parallel polarizer orientation,IVHis theuorescence intensity in the perpendic-ular orientation of the polarizer and G is an instrumental correction factor. Time resolved anisotropy and uorescence lifetime was measured on a FluoTime 300uorometer (Pico-Quant, Inc.) using a Fianium laser with tunable excitation. The
uorometer is equipped with an ultrafast microchannel plate detector (MCP) from Hamamatsu, Inc. Theuorescence life-times were measured in the magic angle condition and data were analyzed using FluoFit4 program from PicoQuant, Inc (Germany) using a multi-exponentialtting model,
IðtÞ ¼X i
aie t=si (2)
where,aiis the amplitude of the decay of theithcomponent at
timetandsiis the lifetime of theithcomponent. The intensity weighted average lifetime (sAvg) was calculated using following equation:
Excitations used for time resolved anisotropy measurements were 600 nm, 550 nm and 480 nm, while emission was observed at 700 nm with vertical and horizontal polarizer position on the emission side using appropriatelters on both the excitation and emission side. Anisotropy decays were analyzed with a bi-exponentialtting model in the FluoFit4 program from Pico-Quant, Inc (Germany) using the following equation:
rðtÞ ¼X i
rie t=Fi (4)
where,riis the anisotropy of theithcomponent at timetandFi is the rotational correlation time of the ith component. The quality of thet in lifetime and anisotropy decay analysis was judged by the chi square value and by the quality and auto-correlation of the residuals. The hydrodynamic particle size of
BSA Au25 clusters was measured using a Nanotrac system
(Mircotrac, Inc., Montgomeryville, PA, USA) in water at room temperature.
Results and discussion
Absorption anduorescence measurements
BSA Au25 nanoclusters were synthesized using an established protocol and were characterized for their absorption and
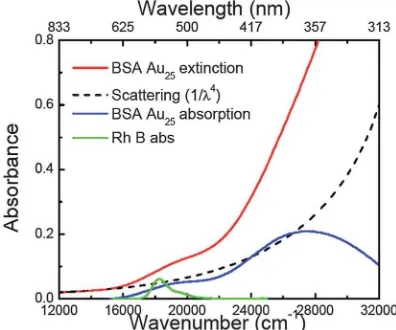
uorescence properties. In Fig. 1, the red line shows the
extinction spectrum of the synthesized BSA Au25 clusters
showing a small bump around 500 nm. Due to the particulate nature of the BSA Au25clusters, they show a distinct scattering component in their extinction spectrum.
In order to get the corrected absorbance, we measured the
extinction spectrum in the range 850–300 nm. Since the
absorption of clusters begins at about 600 nm, the spectral range 850–600 nm can be tted with the Rayleigh scattering function (1/l4) and the appropriate Rayleigh scattering
contri-bution can be subtracted at shorter wavelengths from the
extinction spectrum of BSA Au25 clusters as shown by the
dashed black line.
The blue line in Fig. 1 shows the re-convoluted absorption spectrum of BSA Au25clusters. This broad absorption spectrum
(from 600 nm to 310 nm) is composed of multiple transitions showing a peak around 360 nm and a shoulder around 500 nm. We resolved this spectrum assuming a Gaussian distribution of transitions across the absorption spectrum.
Fluorescence excitation spectra of clusters show peaks around 330 nm, 510 nm and a shoulder around 380 nm (Fig. 6). These wavelength numbers were used to assign the peak values while Gaussian approximation of the absorption spectrum.
Fig. 2 shows the BSA Au25 clusters absorption spectrum numerically decomposed to three Gaussian components that already gives a satisfactoryt to the experimental results. The signicant overlap between absorption transitionstted with the Gaussian components further supported the wavelength dependence of steady state anisotropy data, which is discussed Fig. 1 Extinction spectrum of the synthesized BSA Au25clusters (red line),
scattering function (black dashed line) extrapolated from the long wavelength spectrum of BSA Au25clusters, corrected absorption after subtracting the
scat-tering function from the extinction spectrum of BSA Au25clusters (blue line) and
rhodamine B absorption (green line).
Fig. 2 Absorption spectrum of BSA Au25approximated by three Gaussian
components. The square dotted spectrum is the best nonlinear least squarefit to the three Gaussian components. The long wavelength transition significantly overlaps with the second strong band.
Fig. 3 Emission spectra of BSA Au25and RhB in ethanol when excited using a
510 nm wavelength, scanned from 515 to 800 nm using a 515 LPfilter on the emission side. Absorption of RhB at 510 nm was adjusted to the same value as the absorption of the BSA Au25cluster sample. The quantum efficiency of BSA Au25
clusters is about 6%.
in the Steady state anisotropy measurements section. Jinet al.
have reported the presence of three well dened bands in optical absorption spectra of thiol protected Au25clusters.19
The broad absorption spectrum of BSA Au25clusters can be an indication for the presence of a size distribution that was further conrmed by measuring the hydrodynamic size using dynamic light scattering. The average particle size was found to be around 8 nm (Fig. 2) with a narrow size distribution sup-porting the possibility of the presence of at least two BSA molecules holding gold clusters together. This observation is in good agreement with the report from Purkayasthaet al.20
The emission for BSA Au25clusters has a maximum around 660 nm with a broad emission spectrum from 550 nm to 850 nm
when excited at 470 nm. Different investigators have reported different emission peaks (from 640 nm to 710 nm) despite the use of a common synthesis protocol.21–23This discrepancy may
arise due to the use of BSA from different manufacturing
sources and impurities present in it. We have observed repro-ducibility in luminescence properties of BSA Au25clusters aer repeating the synthesis protocol at least 4 times. Fig. 3 shows the emission spectra (corrected for absorbance at 515 nm) of
rhodamine B and BSA Au25 clusters to provide a visual
comparison of the quantum efficiency. The quantum yield of these clusters was found to be6%.
Furthermore, we also looked at theuorescence decay of BSA Au25 clusters as shown in Fig. 4. It showed a heterogeneous
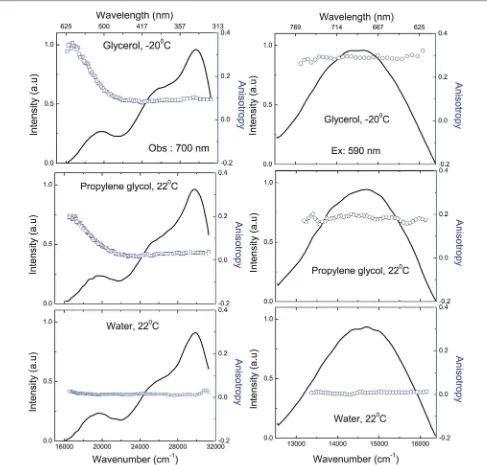
Fig. 5 Left vertical panels: excitation spectra and excitation anisotropy spectra of BSA Au25clusters in (top) glycerol, 20C (middle) propylene glycol, 22C and
(bottom) DI Water, 22C. Right vertical panels: emission spectra and emission anisotropy spectra of BSA Au
25clusters in (top) glycerol, 20C (middle) propylene glycol,
22C and (bottom) DI water, 22C.
decay which needed at least 3 exponential intensity decay components tot the data. The average lifetime was 1.84ms. We found distinct polarization behavior from these long lifetime BSA Au25clusters.
Steady state anisotropy measurements
In Fig. 5, the levertical panels show the excitation spectra and anisotropy spectra in glycerol, propylene glycol and water. In order to attain the limiting value, anisotropy was measured in glycerol at 20C. We observed that, along therst transition (over the range of 320 nm to 450 nm) anisotropy was around 0.09 in glycerol, and aer 450 nm there is a steady increase in the anisotropy to reach the limiting anisotropy of 0.35. In the case of propylene glycol it is 0.20, and 0.05 in water at 22C owing to depolarization due to a fast rotational diffusion compared to glycerol at 20 C. Anisotropy in low temperature glycerol is about 0.09 in the range of 320 nm to 450 nm which can be sup-ported by our Gaussian approximation (Fig. 2). Although we do not know the precise orientation of absorption transitions, overlap of multiple transitions in this spectral region (320 nm to 450 nm) leads to lower anisotropy values and it needs further work. As expected, the increase in anisotropy from 450 nm onwards supports our Gaussian approximation where the contribution from the 2nd Gaussian starts to decrease and anisotropy reaches the limiting value at around 580 nm where the contribution from other transitions is none or negligible.
In Fig. 5, the right side vertical panels show the emission spectra and emission anisotropy spectra of BSA Au25clusters in glycerol, propylene glycol and water using 590 nm excitation. Since we are close to the limiting anisotropy at this excitation, the emission anisotropies were found to follow similar trends as excitation and decreased with decreasing solvent viscosity. Emission anisotropy for glycerol is 0.30, for propylene glycol 0.20 and slightly over zero for water. Emission anisotropy was constant throughout the emission spectrum in all the cases.
Time resolved anisotropy measurements
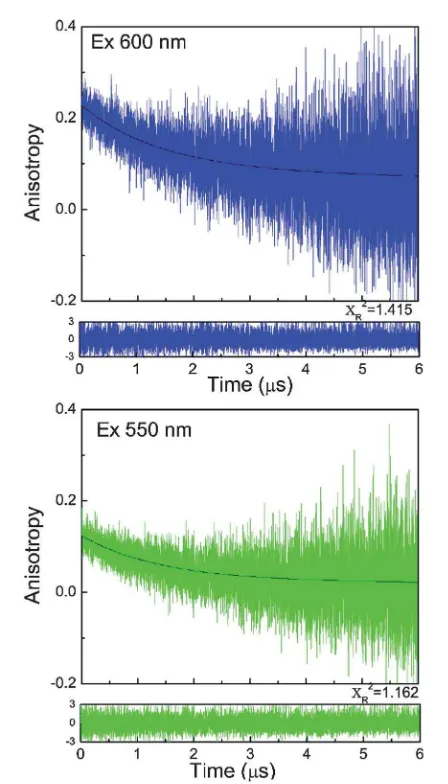
In the case of water (Fig. 6), fast motion in low viscosity solvent results in rapid anisotropy decay and faster correlation time.24 The anisotropy decays of BSA Au25clusters in propylene glycol are shown in Fig. 7. A slower motion and very slow decay in anisotropy was observed. Similar decay was observed when the same sample was excited using 550 nm wavelength while keeping the emission observation at 700 nm (Fig. 7: lower panel), however the recoveredr0value decreased signicantly.
This is in agreement with the excitation anisotropy data and shows the excitation dependence of the anisotropy. The rota-tional correlation times were the same for both the decays in propylene glycol; however there is a change in the amplitudes of the two fractions. The recovered r0 value 0.22 for propylene glycol and 0.2 for water are lower than the limiting anisotropy value (0.35) which indicates some initial anisotropy losses due to fast sub-nanosecond motions; however, dominant time dependant anisotropy changes are due to overall molecule rotations in the nanosecond range.
Fig. 6 Fluorescence anisotropy decay of BSA Au25clusters in water at 600 nm
excitation and 700 nm observation at 22C. Recovered correlation times areF1¼
0.029ms andF2¼0.195ms.
Fig. 7 Fluorescence anisotropy decays of BSA Au25clusters in propylene glycol at
22C. Upper panel: excitation at 600 nm and emission observation at 700 nm and
Conclusions
In this report we have synthesized the BSA Au25clusters using the established protocol, and we have conrmed its absorption and emission properties. The major observation of our study is the presence of polarization behavior in these long uorescence lifetime clusters. The presence of polarization properties among these clusters opens up a door to many exciting applications such as the study of large molecular weight protein complexes, which would otherwise be difficult to study due to the absence of long
uorescence lifetime probes. The presence of long lifetime and anisotropy can be explored for time-gated detection in micros-copy and imaging. Moreover it can also be applied in developing anisotropy based bio and chemical sensing applications.
Acknowledgements
This work was supported by the NIH GRANT R01EB12003. We would like to thank Dr J. Vishwanatha for permitting us to use particle size measurement instrument: Nanotrac system (Mircotrac, Inc., Montgomeryville, PA, USA).
Notes and references
1 Y. Lu and W. Chen,Chem. Soc. Rev., 2012,41, 3594–3623. 2 H. Xu and K. S. Suslick,Adv. Mater., 2010,22, 1078–1082.
3 X. X. Wang, Q. Wu, Z. Shan and Q. M. Huang, Biosens.
Bioelectron., 2011,26, 3614–3619.
4 Y. M. Fang, J. Song, J. Li, Y. W. Wang, H. H. Yang, J. J. Sun and G. N. Chen,Chem. Commun., 2011,47, 2369–2371. 5 C. V. Durgadas, C. P. Sharma and K. Sreenivasan,Analyst,
2011,136, 933–940.
6 G. Ma, A. Binder, M. Chi, C. Liu, R. Jin, D. E. Jiang, J. Fan and S. Dai,Chem. Commun., 2012, 11413–11415.
7 H. Qian, M. Zhu, Z. Wu and R. Jin,Acc. Chem. Res., 2012,45,
Biosens. Bioelectron., 2012,32, 297–299.
11 X. Le Guevel, N. Daum and M. Schneider,Nanotechnology, 2011,22, 275103.
12 T. Zhou, Y. Huang, W. Li, Z. Cai, F. Luo, C. J. Yang and X. Chen,Nanoscale, 2012,4, 5312–5315.
13 T. H. Chen and W. L. Tseng, Small, 2012, 8, 1912–
1919.
14 I. Sakanaga, M. Inada, T. Saitoh, H. Kawasaki, Y. Iwasaki, T. Yamada, I. Umezu and A. Sugimura,Appl. Phys. Express, 2011,4, 5001. P. Purkayastha,Nanoscale, 2012,4, 6018–6024.
21 C. V. Durgadas, C. P. Sharma and K. Sreenivasan,Nanoscale, 2011,3, 4780–4787.
22 A. Zhang, Y. Tu, S. Qin, Y. Li, J. Zhou, N. Chen, Q. Lu and B. Zhang,J. Colloid Interface Sci., 2012,372, 239–244. 23 X. Wu, X. He, K. Wang, C. Xie, B. Zhou and Z. Qing,
Nanoscale, 2010,2, 2244–2249.
24 C. Li, J. U. Sutter, D. J. S. Birch and Y. Chen, Fluorescence anisotropy of protein–gold nanoclusters, Nanotechnology (IEEE-NANO), 2012 12th IEEE Conference on, 2012, pp. 1–4.