DOI: 10.12928/TELKOMNIKA.v12i4.115 763
Improving the Dielectric Properties of High Density
Polyethylene by Incorporating Clay-Nanofiller
Ossama E. Gouda*1, Sohair F. Mahmoud2, Ahmed A. El-Gendy3, Ahmed S. Haiba4
1
Cairo University, Faculty of Engineering, Electrical Department Giza, Egypt, Ph./Fax:+202-35702193/35723486
2,4
National Institute of Standards (NIS), High Voltage Metrology Lab. Tersa street, El-Haram, Giza, Egypt, Ph./Fax:+202-33889760/33867451
3
National Institute of Standards (NIS), Nanotechnology and Nanometrology Lab. Tersa street, El-Haram, Giza, Egypt, Ph./Fax:+202-33889760/33867451
*Corresponding Author, e-mail: [email protected]
Abstract
Polymer nanocomposites have been used for various important industrial applications. The preparation of high density polyethylene composed with Na-montmorillonite nanofiller using melt compounding method for different concentrations of clay-nanofiller of 0%, 2%, 6%, 10%, and 15% has been successfully done. The morphology of the obtained samples was optimized and characterized by scanning electron microscope showing the formation of the polymer nanocomposites. The thermal stability and dielectric properties were measured for the prepared samples. Thermal gravimetric analysis results show that thermal stability in polymer nanocomposites is more than that in the base polymer. It has been shown that the polymer nanocomposites exhibit some very different dielectric characteristics when compared to the base polymer. The dielectric breakdown strength is enhanced by the addition of
clay-nanofiller. The dielectric constant (İr) and dissipation factor (Tan į) have been studied in the frequency
range 200 Hz to 2 MHz at room temperature indicating that enhancements have been occurred in İr and
Tan į by the addition of clay-nanofiller in the polymer material when compared with the pure material.
Keywords: polymer nanocomposites, high density polyethylene, dielectric breakdown, dielectric constant, dissipation factor.
1. Introduction
discharge resistant characteristics (with insulating fillers) were observed when compared to similar properties in traditional neat polymers [8]-[10]. These observations were mainly attributed to the unique properties of nanoparticles and the large interfacial area in polymer nanocomposites [11]-[13].
The present work focuses on the dielectric properties of PE nanocomposites. Polyethylene is one of the thermoplastic polyolefin which is traditionally one of the most widely used polymer classes with applications in structural, textile, and packaging industries, and their nanocomposites have found multiple applications for the same uses. This paper shows the preparation and characterization of high density polyethylene composed with Na-montmorillonite clay-nanofiller (HDPE/clay) with different concentrations of clay-nanofiller as 0%, 2%, 6%, 10% and 15%. Then the dielectric properties, such as dielectric constant, dissipation factor, dielectric breakdown, and insulation resistance, of the prepared samples will be discussed and compared to the base polymer material.
2. Experimental Details 2.1. Materials
HDPE with melt flow rate of 7.5 g/10min and density of 960 kg/m3 is chosen as the base polymer material for the current study. It was manufactured by the International Company for Manufacturing Plastic Products. Sodium montmorillonite clay K10 (MMT) was acquired from fluka Chemika Company. Hexadecyl Trimethyl Ammonium Bromide, modifier or surfactant material, was obtained from Merck KGaA, Darmstadt, Germany.
2.2. Modificationof Clay
The preparation of polymer/clay nanocomposites with good dispersion of clay layers within the polymer matrix is not possible by physical mixing of polymer and clay particles. It is not easy to disperse nanolayers in most polymers due to the high face to face stacking of layers in agglomerated tactoids and their intrinsic hydrophilisity which make them incompatible with hydrophobic polymers. The intrinsic incompatibility of hydrophilic clay layers with hydrophobic polymer chains prevents the dispersion of clay nanolayers within polymer matrix and causes to the weak interfacial interactions.
Modification
of clay layers with hydrophobic agents is necessary in order to render the clay layers more compatible with polymer chains, and result in a larger interlayer spacing. In addition, improving the strength of the interface between the inorganic and the polymer matrix. So, Na-MMT clay is modified with the compatiblizer of Hexadecyl Trimethyl Ammonium Bromide [14].
100g of clay was dispersed into 1000 ml of methanol solvent and placed on hot plate with magnetic stirrer to allow continuous stirring for 2hours. On the other hand, 100g of hexadecyl trimethyl ammonium bromide was dissolved in 500 ml of methanol. Then the solution was added to clay dispersion. The stirring continued for 72 hours. After that, the modified clay was filtered and collected. Finally the filtrate was dried in a vacuum oven at 70 °C for 6 hours [15].
2.3. Preparation of HDPE/Clay Composites
2.4. Characterization of HDPE/Clay
The prepared samples were characterized by the scanning electron microscope (SEM). SEM is a type of electron microscope that produces images of a sample by scanning it with a focused beam of electrons. The electrons interact with atoms in the sample, producing various signals that can be detected and that contain information about the sample's surface topography and composition. The scanning electron microscope images were carried out by using SEM, model Quanta 250 FEG (Field Emission Gun) attached with EDX unit (Energy Dispersive X-ray Analyses), with accelerating voltage 30 kV, magnification 14x up to 1000000x, and a resolution of 1nm.
Thermal stability is measured by using thermo gravimetric analysis (TGA). TGA experiments were done by a shimadzu TA-50 thermal analyzer using scanning rate of 5 °C/min under N2 with 20 ml/min flow rate, from room temperature to 600 °C.
2.5. Dielectric Properties
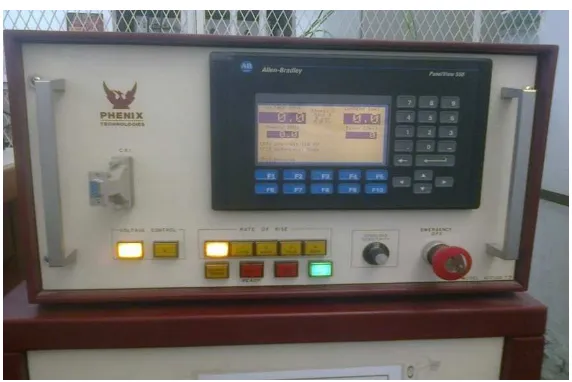
Dielectric breakdown refers to a rapid reduction in the resistance of an electrical insulator when the voltage applied across it exceeds the breakdown voltage. Dielectric breakdown measurements were performed using AC Dielectric Test Set, Figure 11. The samples were sandwiched between two electrodes and tested at room temperature under an ac voltage ramp of 750 V/Sec. The ac voltage was increased with a rate of 750 V/Sec until breakdown occurred.
Dielectric constant is called relative permittivity which is a parameter that indicates the relative charge storage capability of dielectrics in the presence of an electric field. The used instrument is an Agilent E4980A LCR meter with dielectric sample holder, Figure 10. The equivalent parallel capacitance (Cp) is measured directly by the LCR meter, then the dielectric
constant is calculated as shown below in the results section.
Dissipation factor is called loss tangent or Tan į. It represents the energy loss in the dielectrics and it is preferred to be smaller for insulation materials. It was measured directly by an Agilent E4980A LCR meter with dielectric sample holder in the frequency range 200 Hz to 2 MHz at room temperature.
Also, insulation resistance was measured directly by LCR meter at the same conditions.
3. Results and Discussion
3.1. Scanning Electron Microscopy (SEM)
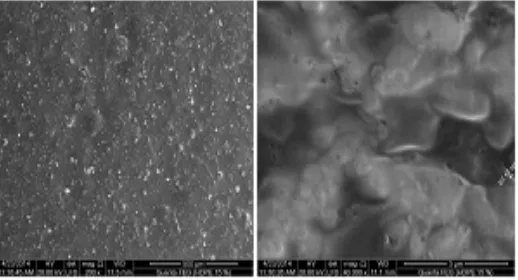
The morphology of the SEM images for HDPE with 2% clay, 6% clay, 10% clay, and 15% clay composites is shown in Figures 1-4 respectively. Each sample has two images with different magnifications. All SEM images for all samples revealed that, clay was dispersed in polymer matrix very well and there wasn’t any accumulation of clay-nanofiller in it. An important observation is that the thickness of clay content is still in nano-size range. This means that the samples were successfully prepared.
Figure 2. SEM images for HDPE 6% sample at (200x & 40000x) magnifications
Figure 3. SEM images for HDPE 10% sample at (200x & 40000x) magnifications
Figure 4. SEM images for HDPE 15% sample at (200x & 40000x) magnifications
3.2. Thermal Analysis
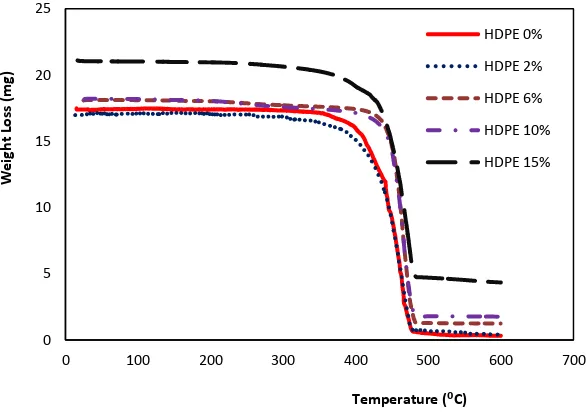
The thermal stability of the prepared samples was measured using thermo-gravimetric analyzer (TGA). In this technique, the weight loss of the material due to the formation of volatile compounds under degradation because of the heating and temperature rising is monitored. The data available from TGA is tabulated in Table 1 and graphed in Figure 5 including T10% (onset temperature), the temperature at which 10% degradation from the sample occurs,
T50%, the temperature at which 50% degradation occurs, Tmax, the temperature at which
Table 1. TGA results for HDPE and HDPE/clay composites improved the thermal stability at higher degradation temperature ranges compared to pure HDPE. The temperature of the 10% degradation of HDPE 2%, HDPE 6% and HDPE 10% has been shifted to lower temperatures relative to HDPE 0%, while the 10% degradation temperature of HDPE 15% shifted to higher temperatures compared to HDPE 0%. The 50% and maximum degradation temperatures have been shifted to higher temperatures compared to HDPE 0%. This means that, thermal stability has been occurred with increasing the concentration of MMT composed to HDPE. The residual weight of the samples at 600 °C increased with increasing the concentration of clay composed to HDPE. Thus, thermal stability of HDPE/clay has been improved compared to pure HDPE.
Figure 5. TGA curves for HDPE and HDPE/clay composites
3.3. Dielectric Properties
3.3.1. Dielectric Breakdown Strength
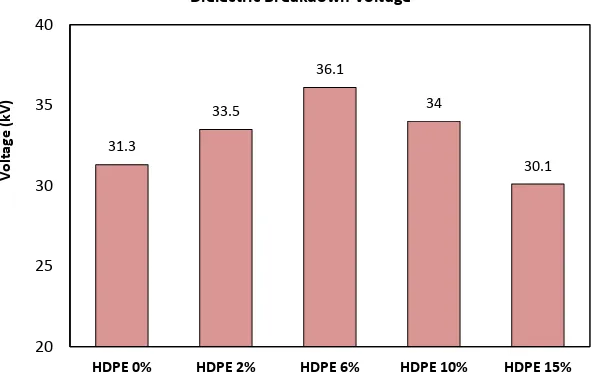
The dielectric breakdown strength of the composites is analyzed using an AC dielectric test set at room temperature. The test was repeated 5 times for each sample and the average value was recorded and plotted as shown in Figure 6.
Figure 6. Dielectric breakdown strength measurement for HDPE/clay composites
Figure 6 shows the behavior of the dielectric strength for HDPE/clay composites. Results show that the dielectric breakdown voltage increases with increasing the concentrations of clay-nanofiller to HDPE when compared to the pure material having the same dimensions until reaching to an optimum value (36.1 kV) at HDPE 6% then, the breakdown voltage starts to decrease at 10%, and 15% clay-nanofillers. Although the breakdown voltage decreases at 10% clay-nanofiller, it’s value still larger than the value of pure material. It is observed that the breakdown voltage value of the sample HDPE 15% is lower than that of pure material. As a result, the dielectric breakdown strength has been improved at all concentrations of clay-nanofiller except 15% clay concentration when compared to the unfilled material. The optimum enhancement occurred at HDPE 6%.
3.3.2. Dielectric Constant (İr)
Measured quantity was the equivalent parallel capacitance (Cp) of the samples in the
frequency range 200 Hz to 2 MHz, then the dielectric constant (İr) is calculated by the following
equations [16] and plotted as shown in Figure 7.
Cᴘ ₀ ᵣ (1)
εᵣ Cᴘ
₀ (2)
Where: ε₀ = 8.854*10-12 F/m is the permittivity of free space, (A) is the area of electrodes, and (t) is the thickness of the samples.
Figure 7 shows the variation of the dielectric constant (İr) with frequency at room
temperature for all samples. Observed differences were found in dielectric constant between pure HDPE and HDPE composites with different concentrations of clay-nanofiller. It is seen that,
İr decreases with increasing frequency for all samples. An important observation is that dielectric constant decreases considerably with the addition of clay-nanofiller up to 6% filler concentration, and then it increases at 10% and 15% filler concentrations. The value of İr at HDPE 10% is still lower than that of pure HDPE and its value at HDPE 15%, is higher than the pure material. The increasing of İr at 10% and 15% filler concentrations may be due to the
effect of İr of composites (inclusions + matrix) on the resultant permittivity [17],[18]. This means that an enhancement occurred in dielectric constant at 2%, 6%, and 10% filler concentrations.
Figure 7. Frequency dependence of dielectric constant at room temperature
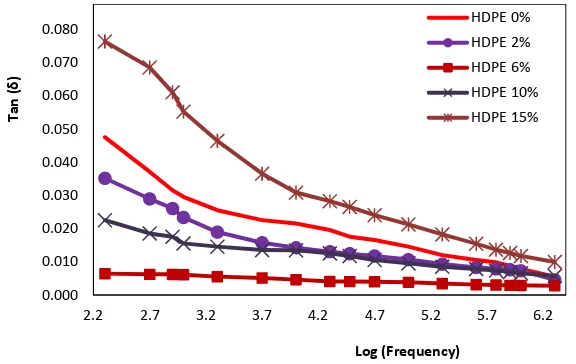
3.3.3. Dissipation Factor (Tan δ)
Figure 8 shows the variation of the dissipation factor (Tan į) with frequency at room temperature for all samples. As shown in the figure, Tan į decreases with increasing frequency for all samples. Also an important observation is that Tan į decreases with increasing the concentrations of clay-nanofiller incorporated in polymeric material up to 6% filler concentration, then it further increases at 10% and 15% filler concentrations. This may be due to the increasing of conductivity according to increasing of nano-filler concentration [17],[18]. It is seen that the values of Tan į for HDPE 10% sample are less than that of pure material. On the other hand, the values of Tan į for 15% filler concentrations are higher than that of pure material. This means that clay-nanofiller improves the dissipation factor for HDPE polymeric material.
3.3.4. Insulation Resistance (R)
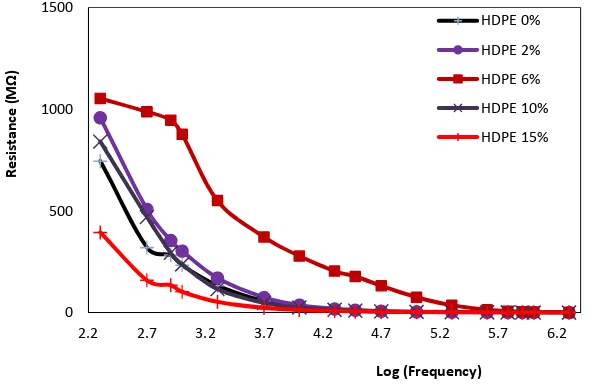
Figure 9 shows the variation of the insulation resistance (R) with frequency at room temperature for all samples. Marked differences were found in the insulation resistance between pure HDPE and HDPE composites with different concentrations of clay-nanofiller. It is seen that, the insulation decreases with increasing frequency for all samples. An important observation is that the insulation increases with the addition of clay-nanofiller up to 6% filler concentration, and then it decreases at 10% and 15% filler concentrations. Although that, the insulation resistance value at 10% filler concentrationis still higher than that of pure HDPE. On the other hand, the insulation resistance value at 15% filler concentrations is lower than that of pure sample. The decreasing of the insulation resistance at 10% filler concentration may be due to the increasing of conductivity of composites at high concentrations. This means that an enhancement occurred in the insulation resistance up to 10% filler concentration when compared to pure material.
Figure 9. The insulation resistance variation with variable frequencies at room temperature
Figures 10,11 show the instruments which used for dielectric and breakdown measurements respectively.
Figure 10. Agilent E4980A LCR meter with dielectric sample holder 0
500 1000 1500
2.2 2.7 3.2 3.7 4.2 4.7 5.2 5.7 6.2 HDPE 0%
HDPE 2%
HDPE 6%
HDPE 10%
HDPE 15%
Resistance
(M
Ω
)
Figure 11. Dielectric test set for dielectric breakdown measurement
4. Conclusion
HDPE/clay composites are prepared by melt compounding method (Master Batch method). Morphology structure of the prepared samples is investigated by SEM. SEM images show that clay content is well dispersed in the polymer matrix indicating samples are successfully prepared. Thermal stability and dielectric properties are investigated for the prepared samples. TGA results show that HDPE nanocomposites have thermal stability more than unfilled polymer material. Dielectric breakdown strength is improved by the addition of clay-nanofillers. Dielectric constant and dissipation factor are studied at room temperature in the frequency range 200 Hz to 2 MHz. The experimental results show that there is an enhancement in both İr and Tan į due to the unique behavior of clay-nanofiller when incorporated into the
polymer base matrix HDPE. Also insulation resistance has been improved by the addition of clay-nanofiller. From all results, It can be noticed that 6% filler concentration is the optimum clay content for HDPE/clay system.
References
[1] BX. Du, HJ. Liu. Effects of Atmospheric Pressure on Tracking Failure of Gamma-ray Irradiated Polymer Insulating Materials. IEEE Transactions on Dielectrics and Electrical Insulation. 2010; 17(2). [2] F. Carmona. Conducting Filled Polymers. Physica A. 1989; 157: 461-469.
[3] Y. Bai, ZY. Cheng, V. Bharti, HS. Xu, QM. Zhang. High dielectric-constant ceramic-powder polymer composites. Applied Physics Letters. 2000; 76(25): 3804-3806.
[4] MM. Ueki, M. Zanin. Influence of additives on the dielectric strength of High-density Polyethylene.
IEEE Transactions on Dielectrics and Electrical Insulation. 1999; 6(6): 876-881.
[5] PB. Messersmith, EP. Giannelis. Synthesis and Characterization of Layered Silicate-Epoxy Nanocomposites. Chemistry of Materials. 1994; 6: 1719-1725.
[6] SS. Ray, M. Okamoto. Polymer/layered silicate nanocomposites: a review from preparation to processing. Progress in Polymer Science. 2003; 28: 1539-1641.
[7] R. Gensler, P. Groppel, V. Muhrer, N. Muller. Applications of Nanoparticles in Polymers for Electronic and Electrical Engineering. Particle and Particle Systems Characterization. 2002; 19: 293-299. [8] T. Tanaka. Dielectric Nanocomposites with Insulating Properties. IEEE Transactions on Dielectrics
and Electrical Insulation. 2005; 12(5): 914-928.
[9] Y. Cao, P. C. Irwin, K. Younsi. The Future of Nanodielectrics in the Electrical Power Industry. IEEE
Transactions on Dielectrics and Electrical Insulation. 2004; 11: 797-807.
[10] T. Imai, F. Sawa, T. Ozaki, Y. Inoue, T. Shimizu, T. Tanaka. Comparison of Insulation Breakdown
Properties of Epoxy Nanocomposites under Homogeneous and Divergent Electric Fields. IEEE
Conference of Electrical Insulation and Dielectrics Phenomena (CEIDP). 2006: 306-309.
[11] TJ. Lewis. Interfaces are the Dominant Feature of Dielectrics at the Nanometric Level. IEEE
Transactions on Dielectrics and Electrical Insulation. 2004; 11: 739-753.
[13] PM. Ajayan, LS. Schadler, PV Braun. Nanocomposite Science and Technology. New York: Wiley. 2003.
[14] Xiaohui Liu, Qiuju Wu. PP/clay nanocomposites prepared by grafting-melt intercalation. Elsevier
Polymer. 2001; 42: 10013-10019.
[15] Mohamed A. Hassan, Ibrahim El-Sayed, Mohamed A. Nour, Aksam A. Mohamed. Flammability Properties of HDPE Nanocomposites Based on Modification of Na-MMT with Organo Silane and Ammonium Phosphate Mono and Di basic. Elixir Appl. Chem. 2012; 46: 8328-8333.
[16] LiLi. Dielectric properties of aged polymers and nanocomposites in Iowa. PhD Thesis. Iowa State University; Graduate Thesis. 2011.
[17] S. Singha, MJ. Thomas. Permittivity and Tan Delta Characteristics of Epoxy Nanocomposites. IEEE
Transactions on Dielectrics and Electrical Insulation. 2008; 15(1).
[18] S. Singha, MJ. Thomas. Dielectric Properties of Epoxy Nanocomposites. IEEE Transactions on