57
BAB V
PENUTUP
5.1Kesimpulan
Penelitian ini menguji pengaruh product recall terhadap citra perusahaan,
loyalitas dan niat beli ulang konsumen. Berdasarkan hasil penelitian yang telah
dijelaskan pada bab sebelumnya dapat ditarik beberapa kesimpulan. Mayoritas
responden adalah wanita yang berusia 21-25 tahun. Besar pendapatan responden
mayoritas berkisar Rp 1.100.000, - Rp 2.000.000,- per bulan. Seri iPhone yang
banyak digunakan adalah iPhone 5, dan mayoritas telah menggunakan produk
iPhone 1-2 tahun. Mayoritas responden mengetahui kasus product recall tetapi
kurang memahami jika Apple pernah melakukan product recall.
Hasil penelitian ini menunjukkan bahwa kasus product recall akan
berpengaruh secara signifikan terhadap citra perusahaan tersebut. Selanjutnya
penelitian ini juga menunjukkan bahwa citra perusahaan dari perusahaan yang
terkana permasalahan product recall berpengaruh secara signifikan terhadap
loyalitas konsumen dan niat beli ulang. Loyalitas konsumen juga akan
menentukan niat beli yang akan dilakukan oleh konsumen. Hasil penelitian ini
sesuai dengan penelitian sebelumnya oleh Souiden dan Pons (2009), Carmina dan
58
5.2 Implikasi Manajerial
Hasil penelitian menunjukkan bahwa product recall berpengaruh pada
citra perusahaan. Citra perusahaan berpengaruh pada loyalitas konsumen dan niat
beli ulang. Loyalitas berpengaruh terhadap niat beli ulang. Perusahaan harus
menciptakan citra yang baik kepada konsumen, karena citra perusahaan yang baik
merupakan kunci sukses sebuah perusahaan. Untuk meningkatkan citranya,
perusahaan dapat menggunakan strategi seperti selalu memberikan layanan yang
terbaik dan selalu menawarkan produk yang berkualitas.
Dengan dimilikinya citra yang baik, ketika suatu perusahaan mengalami
krisis seperti product recall, maka dampak yang ditimbulkan akan lebih kecil.
Seperti yang telah diketahui, pada hasil penelitian mayoritas masyarakat tidak
mengetahui permasalahan product recall yang terjadi pada iPhone, tapi begitu
ditampilkan berita mengenai product recall yang dilakukan oleh iPhone
kebanyakan dari mereka tetap akan loyal terhadap iPhone. Hal tersebut
dikarenakan Apple telah memiliki citra dan reputasi yang baik di masyarakat,
sehingga ketika diketahui Apple memiliki masalah recall, para konsumen mengira
itu bukanlah masalah yang besar karena Apple juga menawarkan penggantian
produk. Para konsumen justru menghargai langkah penarikan produk, sehingga
mereka percaya bahwa Apple peduli akan keselamatan konsumennya. Perusahaan
juga harus mempersiapkan manajemen krisis yang baik, sehingga jika suatu saat
perusahaan terkena krisis seperti product recall sudah ada strategi yang dapat
59
Loyalitas konsumen juga merupakan hal penting yang ingin dicapai
sebuah perusahaan. Karena jika seorang konsumen telah loyal terhadap suatu
merek, sangat kecil kemungkinan bagi mereka untuk berpindah terhadap merek
lain. Selain itu, loyalitas juga secara langsung berdampak positif terhadap niat
beli. Sehingga jika seseorang telah loyal terhadap suatu merek, maka di masa
mendatang dia tak akan ragu untuk membeli ulang produk tersebut.
5.3Keterbatasan Penelitian dan Saran
Dalam melakukan penelitian, penulis menyadari adanya keterbatasan
dalam penelitian ini, yaitu antara lain jumlah responden dalam penelitian ini
hanya 200, sehingga untuk penelitian selanjutnya jumlah responden bisa ditambah
agar lebih mewakiki populasi.
Penelitian dilakukan terhadap perusahaan besar dan telah memiliki citra yang
baik di masyarakat, maka dalam penelitian selanjutnya tentang product recall
dapat diteliti terhadap perusahaan yang belum terkenal atau perusahaan yang
DAFTAR PUSTAKA
Adipitaryana Diredja, R., (2012), “Pengaruh Product Recall Terhadap Reputasi
Perusahaan”, Fisip UI.
Alfindasari, D., (2014), “Validitas Dalam Penelitian Eksperimen”, diakses dari http://www.eurekapendidikan.com/2014/10/validitas-dalam-penelitian eksperimen.html pada 6 Oktober 2015
Alireza Mosavi, S., dan Mahnoosh, G., (2012), “A Survey on the Relationship Between Trust, Customer Loyalty, Commitment and Repurchase
Intention”, Alfrican Journal of Business Management, Vol.6(36) September, pp. 10089-10098
Arikunto, S., (1992), Prosedur Penelitian: Suatu Pendekatan Praktik, Cetakan ke VIII , Rineka Cipta, Jakarta.
Assael, H., (1998), Consumer behavior and marketing Action, 6th ed. Cincinnati, Ohio: South-Western.
Chea E.T., Chan, W.L., & Chieng, C.LL. (2007) The Corporate Social Responsibility of Pharmaceutical Products Recalls: An Empirical Examination of U.S. and U.K. Markets.
Chu, T.H., Lin, C.C., & Prather, L.J. (2005). An Extension of Security Price Reactions Around Product Recall Announcements. Quarterly Journal of Business & Economics, 44 (3-4), 33-47.
Dinnie, K.,Walsh, G. And Wiedmann, K.P. (2006), “How do corporate reputation and customer satisfaction impact customer defection? A study of private
energy customers in Germany”, Journal of Services Marketing, Vol. 20 No. 6, pp. 412-20.
Fandos, C., and Carlos, F., (2006), “Intrinsic and Extrinsic Quality Attributes,
Loyalty and Buying Intention: An Analysis for a PDO Product”, British Food Journal, Vol. 108 No.8 pp.646-662
Flavian, C., Guinaliu, M. & Torres, E., (2005), “The influence of corporate image on consumer trust: a comparative analysis in traditional versus internet
banking”, Internet Research, Vol. 15 No. 4, pp. 447-71.
Gürses, S., & Kılıç, K. C., (2013), “Corporate image aspect of corporate management in healthcare industry: Definition, measurement and an empirical investigation”, International Business Research, Vol. 6 No. 12.
and purchase intention”, International Journal if Organizational Innovation, Vol. 6 No. 3.
Iskandar., (2014), “Bermasalah, Charger iPhone Ditarik Dari Pasaran”, diakses
dari http://tekno.liputan6.com/read/2063189/bermasalah-charger-iphone ditarik-dari-pasaran pada tanggal 12 April 2015
Jarrell, G. and Peltzman, S. (1985), “The impact of product recalls on the wealth
of sellers”, Journal of Political Economy, Vol. 93, pp. 512-36
Jolly, D.W. and Mowen, J.C. (1984), “Product recall communications: the effects of source, media, and social responsibility information”, in Hirschman, E. and Holbrook, M. (Eds), Advances in Consumer Research, Association for Consumer Research, Provo, UT, pp. 471-5.
Jones, T.O., and Sasser, W.E., (1995), “Why satisfied customers defect”, Harvard Bus. Rev. 73(6):88-99.
Kabak, I.W. and Siomkos, G.J. (1991), “Replacement after product harm crisis”, Industrial Management, September 1.
Khan, M. S., Naumann, E. & Williams, P., (2012). “Identifying the key drivers of
customer satisfaction and repurchase intentions: an empirical investigation
of Japanese B2B services”, Journal of Consumer Satisfaction, Dissatisfaction andComplaining Behavior, 25.
Lerbin R. Aritonang R (2007), Riset Pemasaran Teori dan Praktik, Penerbit Ghalia, Bogor
Lin,C. P., Chen, S. C., Chiu, C. K., and Lee, W. Y., (2011), “Understanding Purchase Intention During Product-Harm Crises: Moderating Effects of Perceived Corporate Ability and Corporate Social Responsibility”, Journal of Business Ethics, pp. 455-471
Lin, L. Y., & Lu C. Y., (2010), “The influence of corporate image, relationship marketing, and trust on purchase intention: the moderating effect of word of mouth”, Tourism Review, Vol. 65 No. 3, pp. 16-34.
Magno, F., Fabio, C., and Alberto, M., (2010), “Exploring Customers’ Reaction to
Product Recall Messages: The Role of Responsibility, Opportunism and
Brand Reputation”, 10th Global Conference on Business & Economics, October 15-16, pp. 1-13
Mittal, V., Ross, W. Jr and Baldasare, P. (1998), “The asymmetric impact of negative and positive atrribute-level performance on overall satisfaction
and repurchase intentions”, Journal of Marketing, Vol. 62 No. 1, pp. 33 -47.
Mowen, J., Jolly, D., & Nickell, G.S. (1981). Factors influencing consumer responses to product recalls: a regression analysis approach. Advances in Consumer Research, 8 (1), 405-407.
Nguyen, N. & LeBlanc, G., (1998), “The mediating role of corporate image on
consumers’ retention decisions: an investigation in financial services”, International Journal of Bank Marketing, Vol. 16 No. 2, 00. 52-65.
Oliver, Richard L., (1999), “Whence Consumer Loyalty?”, Journal of Marketing, 63, pp. 33-44
Parerungan, Sofian., (2014), “Tanggung Jawab Pelaku Usaha Terhadap Produk Cacat”, diakses dari http://pn-bangil.go.id/data/?p=211 pada tanggal 10 April 2015.
Pavlou, P.A., (2003), “Consumer Acceptance of Electronic Commerce: Integrating Trust and Risk with the Technology Acceptance Model”, International Journal of Electronic Commerce 7 (3), 69-103
Planken, B., Dennis,V.M., Frank, V.M., (2006) “Testing the Effect of Genre
Content”, diakses dari
https://books.google.co.id/books?id=PxHkM5fyc1oC&pg=PA128&lpg= A128&dq=recall+product+to+corporate+image&source=bl&ots=pFmY YIko&sig=sNwBCCiSj_r7WJPExq1wHASKvcc&hl=id&sa=X&ved=0 B4Q6AEwADgKahUKEwif_2Zy6bIAhWDTo4KHfaoB18#v=onepage& =recall%20product%20to%20corporate%20image&f=false pada tanggal 3 Oktober 2015
Priyatno, Duwi., (2012), “Belajar Cepat Olah Data Statistik dengan SPSS”, Edisi
I, CV Andi Offset, Yogyakarta.
Santosa Purbayu Budi dan Ashari.,(2005), Analisi Statistik dengan Microsoft Excel & SPSS, Penerbit Andi, Yogyakarta
Siomkos, G.J. (1999), “On achieving exoneration after a product safety industrial
crisis”, Journal of Business & Industrial Marketing, Vol. 14 No. 1, pp. 17-29.
Souiden, N., dan Frank Pos., (2009). Product recall crisis management: the impact
on manufacturer’s image, consumer loyalty and purchase intention.
Journal of Products & Brand Management, 18 (2), 106-114.
Souiden, N., Kassim, M.N. and Hong, H.J. (2006), “The effect of corporate
branding dimensions on consumers’ product evaluation: a cross cultural
analysis”, European Journal of Marketing, Vol. 40 Nos 7/8, pp. 825-45.
Sugiyono., (2011), Metode Penelitian Pendidikan (Pendekatan Kuantitatif, Kualitatif, dan R&D), Alfabeta, Bandung
Sutojo, S., (2004), Membangun Citra Perusahaan, Cetakan I, PT. Damar Mulia Pustaka, Jakarta.
Suwartono.,(2014), Dasar-dasar Metodologi Penelitian, Edisi I, Andi Offset, Yogyakarta
Tjiptono, F., (2014), Pemasaran Jasa-Prinsip, Penerapan, dan Penelitian, Edisi I, Andi Offset, Yogyakarta
Venugopal Paludindi, Akul Soni, Rohit Tiwari, Saurabh Gupta., (2012), “Product
Recall: Effect On Brand Perception”, International Journal of Marketing and Technology, Vol.2 Issue.12, December, pp. 199-208
Weiwei, T., (2007), “Impact of corporate image and corporate reputation on customer loyalty: a review”, Management Science and Engineering, Vol. 1 No.2.
Yaseen, N., Mariam,T., Amir,G., Ayesha,A., (2011), “Impact of Brand Awareness, Perceived Quality and Customer Loyalty on Brand
Profitability and Purchase Intention: A Resellers’ View”, Interdisciplinary Journal of Contemporary Research in Business, Vol. 3 No.8, December, pp. 833-839
Yoo, B. And N. Donthu: 2001, “Developing a Scale to Measure Perceived Quality
LAMPIRAN 1
Dengan hormat,
Sehubungan dengan penelitian yang saya lakukan dalam rangka menyelesaikan
tugas akhir (skripsi) dengan topik “Pengaruh Product Recall Terhadap Citra Perusahaan,
Loyalitas dan Niat Beli Ulang Konsumen” khususnya untuk pengguna produk Apple
terkhusus iPhone.
Bersama ini saya mahasiswa Universitas Atma Jaya Yogyakarta,
Nama : Grasienda Natalia Kristiasi
NPM : 11 03 18942
Fakultas : Ekonomi
Jurusan : Manajemen
Mohon bantuan kepada Saudara untuk menjadi responden dengan mengisi kuesioner
yang terlampir berikut ini. Atas segala bentuk perhatiannya saya ucapkan terima kasih.
Hormat Saya,
KUESIONER PENELITIAN
“PENGARUH RECALL iPHONE 5 TERHADAP PERSEPSI, LOYALITAS dan NIAT
BELI ULANG KONSUMEN”
A. Identitas Responden
1. Jenis Kelamin Anda?
a. Pria
b. Wanita
2. Berapa usia Anda?
a. < 17 tahun
b. 17-20 tahun
c. 21-25 tahun
d. > 25 tahun
3. Berapa pendapatan anda tiap bulan?
a. < 1.000.000
b. 1.100.000 – 2.000.000
c. 2.100.000 – 3.000.000
d. > 3.000.000
4. Berapa lama anda menggunakan iPhone?
a. < 1 tahun
b. 1 – 2 tahun
c. 3 – 4 tahun
d. > 4 tahun
5. Seri iPhone apakah yang Anda pakai?
B. KASUS
1. Apakah anda mengetahui permasalahan recall product atau penarikan
kembali suatu produk?
a. Ya
b. Tidak
2. Apakah anda mengetahui penarikan kembali yang terjadi pada produk iPhone
5?
a. Ya
C. Pertanyaan
Berikutnya saya meminta kesediaan Saudara untuk menjawab
pertanyaan-pertanyaan berikut ini. Masing-masing daftar pertanyaan disediakan
lima (5) alternatif jawaban atas pertanyaan berikut dengan memberi tanda
centang (V) pada kolom yang sudah disediakan.
Perlu diketahui bahwa tidak ada jawaban yang benar dan tidak ada jawaban yang
salah.
1. Saya merasa penarikan produk adalah hal yang lumrah terjadi saat adanya produk cacat/ rusak
2. Saya merasa penarikan produk merupakan bentuk evaluasi perusahaan dalam rangka memastikan produknya tetap pada kualitas terbaik 3. Saya menghargai langkah penarikan
produk, sehingga saya mengetahui bahwa iPhone 5 memiliki cacat pada komponennya
4. Saya merasa Apple cepat tanggap dalam mengatasi penemuan kecacatan pada produknya
5. Saya merasa lebih aman dengan adanya penarikan produk setelah adanya penemuan cacat komponen yang berpotensi membahayakan 6. Saya tidak merasa kecewa terhadap
7. Penarikan produk justru membuat saya percaya bahwa Apple peduli akan keselamatan konsumennya. 8. Penarikan produk tidak membuat saya
jera untuk menggunakan produk Apple kembali
2. Citra Perusahaan
Pertanyaan SS S N TS STS
1. Secara umum, saya percaya Apple selalu dapat memenuhi janjinya kepada konsumen
2. Merek Apple memiik reputasi yang bagus
3. Saya percaya reputasi merek Apple lebih unggul dari pesaingnya
4. Merek Apple pantas untuk di rekomendasikan
5. Saya memiliki kesan yang baik terhadap merek Apple
6. Merek Apple mempunyai maksud yang baik dan pantas dipercaya 7. Menurut saya, secara umum merek
Apple memiliki citra yang baik
3. Repurchase Intention
Pertanyaan SS S N TS STS
4. Consumer Loyalty
Pernyataan SS S N TS STS
1. Saya berniat untuk setia terhadap merek Apple
2. Saya berniat untuk
merekomendasikan produk-produk Apple kepada orang lain
3. Di masa mendatang saya akan mendukung merek yang telah saya pilih ini
4. Saya akan tetap menjadi pelanggan dari merek yang telah saya pilih ini. 5. Saya akan terus menggunakan produk
LAMPIRAN 2
HASIL UJI VALIDITAS
1. Product Recall
Correlations
Item_1 Item_2 Item_3 Item_4 Item_5 Item_6 Item_7 Item_8 Skor_total
Item_1 Pearson
Correlation 1 .769
**
.588** .338 .322 -.199 .177 .294 .597**
Sig. (2-tailed) .000 .001 .068 .083 .291 .349 .114 .000
N 30 30 30 30 30 30 30 30 30
Item_2 Pearson
Correlation .769
** 1 .528** .380* .315 -.153 .204 .226 .611**
Sig. (2-tailed) .000 .003 .038 .090 .419 .279 .229 .000
N 30 30 30 30 30 30 30 30 30
Item_3 Pearson
Correlation .588
** .528** 1 .464** .672** .064 .151 .469** .746**
Sig. (2-tailed) .001 .003 .010 .000 .739 .427 .009 .000
N 30 30 30 30 30 30 30 30 30
Item_4 Pearson
Correlation .338 .380
* .464** 1 .417* .286 .425* .532** .770**
Sig. (2-tailed) .068 .038 .010 .022 .125 .019 .002 .000
N 30 30 30 30 30 30 30 30 30
Item_5 Pearson
Correlation .322 .315 .672
** .417* 1 .190 .398* .493** .742**
Sig. (2-tailed) .083 .090 .000 .022 .316 .029 .006 .000
N 30 30 30 30 30 30 30 30 30
Item_6 Pearson
Correlation -.199 -.153 .064 .286 .190 1 .402
* .167 .402*
Sig. (2-tailed) .291 .419 .739 .125 .316 .028 .378 .028
N 30 30 30 30 30 30 30 30 30
Item_7 Pearson
Correlation .177 .204 .151 .425
* .398* .402* 1 .136 .596**
Sig. (2-tailed) .349 .279 .427 .019 .029 .028 .475 .001
Item_8 Pearson
Correlation .294 .226 .469
**
.532** .493** .167 .136 1 .630**
Sig. (2-tailed) .114 .229 .009 .002 .006 .378 .475 .000
N 30 30 30 30 30 30 30 30 30
Skor_tot
al
Pearson
Correlation .597
**
.611** .746** .770** .742** .402* .596** .630** 1
Sig. (2-tailed) .000 .000 .000 .000 .000 .028 .001 .000
N 30 30 30 30 30 30 30 30 30
**. Correlation is significant at the 0.01 level
(2-tailed).
2. Citra Perusahaan
Correlations
Item_1 Item_2 Item_3 Item_4 Item_5 Item_6 Item_7 Skor_total
Item_1 Pearson
Correlation 1 .438
*
.656** .695** .557** .678** .494** .832**
Sig. (2-tailed) .015 .000 .000 .001 .000 .005 .000
N 30 30 30 30 30 30 30 30
Item_2 Pearson
Correlation .438
*
1 .394* .283 .295 .286 .558** .555**
Sig. (2-tailed) .015 .031 .130 .113 .125 .001 .001
N 30 30 30 30 30 30 30 30
Item_3 Pearson
Correlation .656
**
.394* 1 .846** .579** .593** .492** .860**
Sig. (2-tailed) .000 .031 .000 .001 .001 .006 .000
N 30 30 30 30 30 30 30 30
Item_4 Pearson
Correlation .695
**
.283 .846** 1 .712** .688** .581** .893**
Sig. (2-tailed) .000 .130 .000 .000 .000 .001 .000
N 30 30 30 30 30 30 30 30
Item_5 Pearson
Correlation .557
**
.295 .579** .712** 1 .756** .700** .808**
Sig. (2-tailed) .001 .113 .001 .000 .000 .000 .000
N 30 30 30 30 30 30 30 30
Item_6 Pearson
Correlation .678
**
.286 .593** .688** .756** 1 .671** .824**
Sig. (2-tailed) .000 .125 .001 .000 .000 .000 .000
N 30 30 30 30 30 30 30 30
Item_7 Pearson
Correlation .494
**
.558** .492** .581** .700** .671** 1 .764**
Sig. (2-tailed) .005 .001 .006 .001 .000 .000 .000
Skor_t
otal
Pearson
Correlation .832
**
.555** .860** .893** .808** .824** .764** 1
Sig. (2-tailed) .000 .001 .000 .000 .000 .000 .000
N 30 30 30 30 30 30 30 30
*. Correlation is significant at the 0.05 level
(2-tailed).
**. Correlation is significant at the 0.01 level
3. Loyalitas Konsumen
Correlations
Item_1 Item_2 Item_3 Item_4 Item_5 Skor_total
Item_1 Pearson Correlation 1 .666** .663** .851** .217 .875**
Sig. (2-tailed) .000 .000 .000 .249 .000
N 30 30 30 30 30 30
Item_2 Pearson Correlation .666** 1 .708** .650** .482** .847**
Sig. (2-tailed) .000 .000 .000 .007 .000
N 30 30 30 30 30 30
Item_3 Pearson Correlation .663** .708** 1 .766** .406* .870**
Sig. (2-tailed) .000 .000 .000 .026 .000
N 30 30 30 30 30 30
Item_4 Pearson Correlation .851** .650** .766** 1 .324 .915**
Sig. (2-tailed) .000 .000 .000 .081 .000
N 30 30 30 30 30 30
Item_5 Pearson Correlation .217 .482** .406* .324 1 .536**
Sig. (2-tailed) .249 .007 .026 .081 .002
N 30 30 30 30 30 30
Skor_total Pearson Correlation .875** .847** .870** .915** .536** 1
Sig. (2-tailed) .000 .000 .000 .000 .002
N 30 30 30 30 30 30
**. Correlation is significant at the 0.01 level (2-tailed).
4. Niat Beli Ulang
Correlations
Item_1 Item_2 Item_3 Item_4 Skor_total
Item_1 Pearson Correlation 1 .714** .450* .622** .854**
Sig. (2-tailed) .000 .013 .000 .000
N 30 30 30 30 30
Item_2 Pearson Correlation .714** 1 .268 .526** .727**
Sig. (2-tailed) .000 .152 .003 .000
N 30 30 30 30 30
Item_3 Pearson Correlation .450* .268 1 .474** .733**
Sig. (2-tailed) .013 .152 .008 .000
N 30 30 30 30 30
Item_4 Pearson Correlation .622** .526** .474** 1 .850**
Sig. (2-tailed) .000 .003 .008 .000
N 30 30 30 30 30
Skor_total Pearson Correlation .854** .727** .733** .850** 1
Sig. (2-tailed) .000 .000 .000 .000
N 30 30 30 30 30
**. Correlation is significant at the 0.01 level (2-tailed).
UJI RELIABILITAS
a. Listwise deletion based on all variables in the
procedure.
Reliability Statistics
Cronbach's Alpha N of Items
.780 8
Item-Total Statistics
Scale Mean if
Item Deleted
Scale Variance if
Item Deleted
Corrected
Item-Total Correlation
Cronbach's Alpha
if Item Deleted
Item_1 28.23 10.392 .483 .759
Item_2 28.23 9.840 .459 .760
Item_4 28.60 8.662 .646 .725
Item_5 28.53 9.154 .626 .731
Item_6 28.90 10.714 .175 .816
Item_7 28.47 9.913 .440 .763
Item_8 28.43 10.185 .516 .753
2. Citra Perusahaan
Scale: ALL VARIABLES
Case Processing Summary
N %
Cases Valid 30 100.0
Excludeda 0 .0
Total 30 100.0
a. Listwise deletion based on all variables in the
procedure.
Reliability Statistics
Cronbach's Alpha N of Items
Item-Total Statistics
Scale Mean if
Item Deleted
Scale Variance if
Item Deleted
Corrected
Item-Total Correlation
Cronbach's Alpha
if Item Deleted
Item_1 25.97 10.447 .745 .874
3. Loyalitas Konsumen
Scale: ALL VARIABLES
a. Listwise deletion based on all variables in the
Reliability Statistics
Scale Variance if
Item Deleted
a. Listwise deletion based on all variables in the
Reliability Statistics
Cronbach's
Alpha N of Items
.786 4
Item-Total Statistics
Scale Mean if
Item Deleted
Scale Variance if
Item Deleted
Corrected
Item-Total Correlation
Cronbach's
Alpha if Item
Deleted
Item_1 10.93 3.513 .726 .669
Item_2 10.93 4.478 .597 .755
Item_3 12.20 3.683 .481 .801
LAMPIRAN 3
Frequency Table
1. Karakter Responden Berdasarkan Jenis Kelamin
2. Karakteristik Responden Berdasarkan Usia
3. Karakteristik Responden Berdasarkan Pendapatan
4. Karakteristik Responden Berdasarkan Lama Penggunaan iPhone Jenis kel amin
82 41,0 41,0 41,0
118 59,0 59,0 100,0
200 100,0 100,0
Laki-laki Perempuan Total Valid
Frequency Percent Valid Percent
Cumulat iv e Percent
Usia
77 38,5 38,5 38,5
117 58,5 58,5 97,0
6 3,0 3,0 100,0
Frequency Percent Valid Percent
Cumulat iv e Percent
Pendapatan
16 8,0 8,0 8,0
118 59,0 59,0 67,0
54 27,0 27,0 94,0
Frequency Percent Valid Percent
Cumulat iv e Percent
Lama menggunakan iPhone
24 12,0 12,0 12,0
96 48,0 48,0 60,0
80 40,0 40,0 100,0
200 100,0 100,0
Frequency Percent Valid Percent
5. Karakteristik Responden Berdasarkan Seri iPhone yang Digunakan
6. Karakteristik Responden Berdasarkan Pemahaman Product Recall
7. Karakteristik Responden Berdasarkan Pengetahuan Tentang Recall iPhone
Frequency Percent Valid Percent
Cumulat iv e Percent
Kasus 1
81 40,5 40,5 40,5
119 59,5 59,5 100,0
200 100,0 100,0
Tidak Y a Total Valid
Frequency Percent Valid Percent
Cumulat iv e Percent
Kasus 2
125 62,5 62,5 62,5
75 37,5 37,5 100,0
200 100,0 100,0
Tidak Y a Total Valid
Frequency Percent Valid Percent
LAMPIRAN 4
ANALISIS REGRESI LINIER SEDERHANA
1. Pengaruh Product Recall terhadap Citra Perusahaan Regression
Variables Entered/Removedb
Product recalla . Enter
Model 1
Variables Entered
Variables
Remov ed Method
All requested v ariables entered. a.
Dependent Variable: Cit ra perusahaan b.
Model Summary
,523a ,273 ,270 ,44122
Model
Predictors: (Constant), Product recall a.
ANOVAb
14,498 1 14,498 74,473 ,000a
38,545 198 ,195
Squares df Mean Square F Sig.
Predictors: (Const ant), Product recall a.
Dependent Variable: Cit ra perusahaan b.
Coeffi ci entsa
2,070 ,249 8,325 ,000
,525 ,061 ,523 8,630 ,000
(Constant)
2. Pengaruh Citra Perusahaan terhadap Loyalitas Konsumen Regression
Variabl es Entered/ Removedb
Citra perusahaana . Ent er
Model 1
Variables Ent ered
Variables
Remov ed Method
All requested v ariables ent ered. a.
Dependent Variable: Consumer loy alty b.
Model Summary
,591a ,349 ,346 ,48372
Model
Predictors: (Constant), Citra perusahaan a.
ANOVAb
24,870 1 24,870 106,289 ,000a
46,330 198 ,234
Squares df Mean Square F Sig.
Predictors: (Const ant), Citra perusahaan a.
Dependent Variable: Consumer loy alty b.
Coeffici entsa
,945 ,281 3,364 ,001
,685 ,066 ,591 10,310 ,000
(Constant)
3. Pengaruh Citra Perusahaan terhadap Niat Beli Ulang Regression
Variabl es Entered/Removedb
Citra perusahaana . Enter
Model 1
Variables Entered
Variables
Remov ed Method
All requested v ariables entered. a.
Dependent Variable: Repurchase int ention b.
Model Summary
,472a ,223 ,219 ,57731
Model
Predictors: (Constant), Citra perusahaan a.
ANOVAb
18,897 1 18,897 56,699 ,000a
65,990 198 ,333
Squares df Mean Square F Sig.
Predictors: (Const ant), Citra perusahaan a.
Dependent Variable: Repurchase intent ion b.
Coeffici entsa
1,205 ,335 3,595 ,000
,597 ,079 ,472 7,530 ,000
(Constant)
4. Pengaruh Loyalitas Konsumen terhadap Niat Beli Ulang Regression
Variables Entered/Removedb
Consumer loy altya . Enter
Model 1
Variables Entered
Variables
Remov ed Method
All requested v ariables entered. a.
Dependent Variable: Repurchase intention b.
Model Summary
,663a ,439 ,436 ,49046
Model
Predictors: (Constant), Consumer loy alt y a.
ANOVAb
37,258 1 37,258 154,885 ,000a
47,629 198 ,241
Squares df Mean Square F Sig.
Predictors: (Const ant), Consumer loy alty a.
Dependent Variable: Repurchase intent ion b.
Coeffi ci entsa
,948 ,225 4,218 ,000
,723 ,058 ,663 12,445 ,000
(Constant)
LAMPIRAN 5
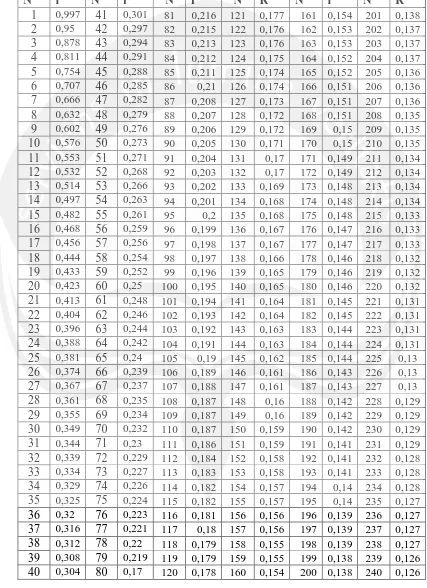
LAMPIRAN 6
Tabel R Product Moment
Sig 0,05 (two-tailed)
LAMPIRAN 7
TABEL T
Diproduksi oleh: Junaidi
Titik Persentase D istribusi t
d.f. = 1 - 200
Diproduksi oleh: Junaidi
Diproduksi oleh: Junaidi (http://junaidichaniago.wordpress.com), 2010 Page 1
Titik Persentase Distribusi t (df = 1 – 40)
Pr 0.25 0.10 0.05 0.025 0.01 0.005 0.001
df 0.50 0.20 0.10 0.050 0.02 0.010 0.002
1 1.00000 3.07768 6.31375 12.70620 31.82052 63.65674 318.30884
2 0.81650 1.88562 2.91999 4.30265 6.96456 9.92484 22.32712
Diproduksi oleh: Junaidi (http://junaidichaniago.wordpress.com), 2010 Page 2
Diproduksi oleh: Junaidi (http://junaidichaniago.wordpress.com), 2010 Page 3
Titik Persentase Distribusi t (df = 81 –120)
Pr 0.25 0.10 0.05 0.025 0.01 0.005 0.001
Diproduksi oleh: Junaidi (http://junaidichaniago.wordpress.com), 2010 Page 4
Titik Persentase Distribusi t (df = 121 –160)
Pr 0.25 0.10 0.05 0.025 0.01 0.005 0.001
Diproduksi oleh: Junaidi (http://junaidichaniago.wordpress.com), 2010 Page 5
Titik Persentase Distribusi t (df = 161 –200)
Pr 0.25 0.10 0.05 0.025 0.01 0.005 0.001