DEWI ERIKA ADRIANI
ANALYSIS OF DEVELOPMENTAL PLASTICITY OF RICE
PANICLE IN RESPONSE TO PLANT C SOURCE-SINK
BALANCE: CASE STUDY OF
QTSN
ISOLINES
GRADUATE SCHOOL
BOGOR AGRICULTURAL UNIVERSITY BOGOR
MONTPELLIER SUPAGRO
2 PLACE VIALA, 34060 MONTPELLIER CEDEX 1 FRANCE
ATTESTATION OF ORIGINALITY, PROPER CITATION
AND COPYRIGHT DELEGATION*
I declare that the PhD thesis entitled ―Analysis of Developmental Plasticity of Rice Panicle in response to plant C source-sink balance. Case study of qTSN isolines‖ is the result of my own work under the supervision of a supervisor committee and is not being concurrently submitted in candidature for any degree. All sources have been cited from published or unpublished works by other authors have acknowledged by means of text citation and complete references.
Herewith I delegate copyright of my manuscript to Bogor Agricultural University, Indonesia and Montpellier SupAgro, France.
Bogor, January 2016
RINGKASAN
Perkembangan malai padi meliputi pembentukan percabangan, elongasi cabang dan penyebaran gabah. Proses-proses penting tersebut dibentuk selama fase reproduktif, yaitu periode antara inisiasi malai dan pembungaan. Proses ini merupakan fokus utama yang sedang diteliti dan menjadi pusat perhatian para pemulia tanaman dengan tujuan untuk memperbaiki potensi hasil dengan cara memperbesar ukuran malai. perkembangan malai padi tidak hanya memiliki sumber keragaman yang besar, proses ini juga peka terhadap interaksi antara genotipe dan lingkungan. Penelitian untuk menganalisis kontrol genetik dan lingkungan terhadap morfologi tanaman telah banyak dilakukan, namun demikian plastisitas yang berhubungan dengan arsitektur malai dan ―trade-offs‖ antar karakter dalam responnya terhadap ukuran malai masih sedikit dipahami.
Penelitian ini membahas respon komponen malai padi terhadap akses tanaman terhadap cahaya yang kontras dari Near Isogenic Lines (NILs) pada kultivar IR64 dan IRRI146, pembawa QTL qTSN4 atau qTSN12 untuk ukuran malai besar beserta tetuanya. Sebelumya telah dilaporkan bahwa QTL qTSN4 (gen SPIKE) menunjukkan ukuran daun bendera yang lebih besar dan jumlah gabah per malai yang lebih banyak, dengan semacam ―trade-off‖ terrhadap jumlah malai, dan secara konsisten terkait dengan hasil gabah lebih tinggi dalam kondisi lingkungan yang menguntungkan. Meskipun QTL ini terlihat menjanjikan dalam arti dapat meningkatkan kapasitas source dan sink tanaman padi, pengaruhnya terhadap fungsi seluruh tanaman belum diteliti dan dapat membawa ke penemuan-penemuan yang relatif menarik terhadap kontrol plastisitas malai.
Tujuan penelitian ini adalah untuk menganalisis plastisitas morfologi malai padi dalam hal dimensi, jumlah gabah, jumlah cabang dan panjang cabang serta determinasinya dengan mmpertimbangkan morfogenesis dan laju pertumbuhan tanaman keseluruhan yang menghasilkan interaksi source-sink. Akses tanaman terhadap cahaya yang kontras diimplementasikan dalam penelitian ini untuk mengatur kondisi pertumbuhan yang berpengaruh kuat terhadap ukuran malai. Hal ini dilakukan melalui pemberian kondisi cahaya penuh (kontrol) dan naungan di rumah kaca yang dilakukan di Montpellier, Prancis dan perlakuan populasi tanaman yang berbeda di lapangan (kerapatan normal dan kerapatan tinggi) dan di rumah kaca (kerapatan normal dan renggang) dilakukan di IRRI, Filipina. Luaran dari penelitian ini adalah informasi yang dapat memberikan pemahaman yang lebih mendalam terhadap karakter-karakter yang membatasi produktivitas , yaitu i) variasi genetik, dan ii) plastisitas fenotipik dalam respon terhadap hubungan C source-sink tanaman.
mengindikasikan sebagai pengendali dari lebih tingginya keragaan batang utama yang terdeskripsi lebih awal.
Namun demikian, keseluruhan tampilan alel qTSN pada tingkat batang utama tidak serta merta dapat diamati pada tingkat tanaman, karena adanya pengaruh terhadap karakter morfologi tanaman lainnya, seperti trade-off antara ukuran dan jumlah malai, dan ukuran malai bukan resipien fenotifik utama dari QTL ini. Kenyataannya, variasi dalam ukuran malai tampaknya berhubungan dengan laju pertumbuhan batang sebelum pembungaan, yang menjelaskan adanya beberapa interaksi GxE terhadap ukuran malai. Sebagaimana yang dapat diamati dalam penelitian ini dan dilaporkan dalam literatur, nilai tambah qTSN juga tergantung pada praktek budidaya (radiasi matahari, ketersediaan N, kedalaman solum tanah). Dengan demikian, qTSN4 dan qTSN12 tidak berdiri sendiri sebagai sumber perbaikan potensi hasil karena interaksi GxE dan kompensasi peningkatan ukuran malai oleh plastisitas adaptif dari karakter morfologi lainnya.
SUMMARY
Rice panicle development consists of branching, branch elongation and spikelet deployment. These elemental processes are established during the reproductive phase, between panicle initiation and heading. They are actually under-going major focus as they are the center of attention of breeders who aim at improving yield potential through larger panicles. Indeed, they are source of great diversity but are also prone to Genotype x Environment interactions. Numerous studies analyzed genetic and environment control of plant morphology, however the associated plasticity of panicle architecture and trade-offs between traits in response to larger panicles are less well understood.
This study addressed the response of rice panicle components to contrasted plant access to light of near isogenic lines (NILs) of IR64 and IRRI146 backgrounds, carrying QTL qTSN4 or qTSN12 for large panicle, and their parental lines. The QTL qTSN4 (SPIKE gene) had been reported in the IRRI farm, Philippines, exhibiting larger flag leaf and greater spikelet number, with a likely trade-off on panicle number, and consistently associated with higher grain yield under favorable environments. Although this QTL seems promising in terms of increasing source and sink capacity of the rice plant, its effect on the whole plant functioning has not been investigated and should lead to interesting findings relative to the control of panicle plasticity.
The present work aimed at analyzing the plasticity of the rice panicle morphology in terms of dimension, spikelet and branch number, and branch length, and its determinants with respect of the whole plant morphogenesis and growth rate, and the resulting C source-sink interactions. In order to set up growing conditions having a strong effect on the panicle size, contrasted plant access to light was implemented through full light and shading conditions in the greenhouse in Montpellier, France, and distinct plant populations in the field (normal and high plant density) and in the greenhouse (normal plant population and isolated plants) at IRRI, Philippines. The outputs of this PhD thesis expect to provide further insights on the traits subtending i) genetic variation and , ii) phenotypic plasticity in response to plant C source-sink relationships.
The effect of qTSN on panicle size was confirmed here through higher total branch length, and branch and spikelet number. This enhancement was associated with the increase of the size of organs located at the upper positions on the stem, i.e. the area of the top three-to-four leaves but also the cross-section of the top three-to-four internodes. It was also demonstrated that, not only individual leaf area, but also the photosynthetic rate, the starch reserves and the leaf N content were higher, and the SLA lower. Interestingly, an early tiller cessation was observed before panicle initiation (PI) in the presence of QTL which was correlated with higher main stem growth rate and which is likely the driver of the higher performance of the main stem described earlier.
observed in this study and reported in the literature, the added value of qTSN also depends on the cultural practices (radiation, N supply, soil depth). Therefore, the qTSN4 and qTSN12 do not appear as a standing-alone source of yield potential improvement because of G x E interactions and compensation of the increased panicle size by the adaptive plasticity of other morphological traits.
RESUME
Le développement de la panicule de riz inclut l‘initiation des branches, leur allongement et le développement des épillets. Ces processus élémentaires ont lieu pendant la phase reproductives, entre l‘initiation paniculaire et l‘épiaison. Ils sont actuellement le centre d‘attention des programmes de sélection qui visent à augmenter le potentiel de rendement grâce à des panicules plus grosses. De fait, les caractéristiques de la panicule sont caractérisées par une large diversité phénotypique mais sont aussi sujettes aux interactions Génotype x Environnement. Bien que de nombreuses études se soient intéressées au contrôle génétique et environnemental de la morphologie de la plante, la plasticité de l‘architecture paniculaire et les compensations entre caractères en réponse à l‘accroissement de la panicule ont été peu analysées.
Cette étude a analysé la réponse des caractères décrivant la panicule à des conditions d‘accès à la lumière contrastées de lignées isogéniques (NILs) de fond génétique IR64 et IRRI146 enrichies des QTLs qTSN4 ou qTSN12 codant pour une panicule plus grosse, et de leurs lignées parentales. Le QTL qTSN4 (gène SPIKE) a été associé, au cours d‘essais à l‘IRRI, Philippines, à une feuille drapeau plus large et un nombre de grains plus important, mais aussi à une éventuelle compensation sur le nombre de panicules, pour un rendement plus élevé en conditions favorables (Fujita et al, 2012, 2013). Bien que ce QTL soit prometteur en termes d‘augmentation des capacités source et puits, son effet n‘a pas été étudié à l‘échelle de la plante entière et devrait pourtant conduire à des résultats intéressants concernant le contrôle de la plasticité de la panicule.
Ce travail vise à analyser la plasticité de la morphologie de la panicule de riz en termes de dimension, de nombre d‘épillets et de branches, et de la longueur des branches, et de ses déterminants en lien avec la morphogénèse, le taux de croissance et les interactions source:puits de la plante entière. Dans le but d‘analyser la plasticité de la panicule en réponse à l‘environnement, les plantes ont été cultivées en conditions contrastées d‘accès à la lumière soit par de l‘ombrage, en serre à Montpellier, soit par des densités de plantes différentes au champ (normales et élevées) et en serre (normales et faibles) à l‘IRRI, aux Philippines. Les sorties de ce travail visent à fournir une meilleure compréhension des caractères expliquant la diversité génétique et la plasticité phénotypique en réponse aux relations source:puits en C dans la plante.
De manière plus intégrée, la performance globale de l‘allèle qTSN à l‘échelle de la tige principale n‘a pas été confirmée de manière constante à l‘échelle de la plante entière puisque des effets sur d‘autres caractères morphologiques de la plante, comme la compensation entre la taille de la panicule et leur nombre, ont été observés et que la taille de la panicule n‘a pas été la cible phénotypique première de ce QTL. En fait, la variation de la taille de la panicule apparaît comme la conséquence du taux de croissance de la tige pendant la phase reproductive, expliquant ainsi les interactions G x E observées sur la taille de panicule. Comme montré au cours de cette étude, et publié dans la litérature, la valeur ajoutée du qTSN dépend aussi des pratiques culturales (rayonnement, fertilisation, profondeur de sol). De fait, le qTSN4 et qTSN12 n‘apparaissent pas comme une source directe d‘augmentation du potentiel de rendement car les interactions G x E et la compensation de la taille de la panicule par la plasticité d‘autres caractères morphologiques.
ANALYSIS OF DEVELOPMENTAL PLASTICITY OF RICE
PANICLE IN RESPONSE TO PLANT C SOURCE-SINK
BALANCE: CASE STUDY OF
QTSN
ISOLINES
DEWI ERIKA ADRIANI
DISSERTATION For obtaining the degree of
DOCTOR at
Study Program Agronomy and Horticulture Biologie Intégrative des Plantes
GRADUATE SCHOOL
BOGOR AGRICULTURAL UNIVERSITY BOGOR
MONTPELLIER SUPAGRO
2 PLACE VIALA, 34060 MONTPELLIER CEDEX 1 FRANCE
Examiners at close defense : 1. Dr Bruno Andrieu
INRA, Agro ParisTech, France 2. Dr Suwarno
Indonesia Rice Research Center 3. Dr Nobuya Kobayashi
Japan International Research Center for Agricultural Sciences
4. Dr Buang Abdullah
Indonesia Rice Research Center
Examiners at promotion : 1. Prof Dr Didy Sopandie
Department of Agronomy and Horticulture, Bogor Agricultural University
2. Dr Suwarno
© Bogor Agricultural University and Montpellier SupAgro,
2016
Copyright is protected by law
Citing and quoting this manuscript in part or in whole is prohibited without proper referencing. Citation is strictly limited for academic purposes, scientific research and report paper, or critical review, and inflict no intellectual property loss for Bogor Agricultural University and Montpellier SupAgro.
PREFACE
Syukur Alhamdulillahirabbilalamin, grateful to Allah Subhanahu Wa Ta `ala for His blessing so that this manuscript could be done. Research topic choosen is a promising subject for agronomy, physiology, genetics and breeding studies. As the rice panicle development is a key in yield improvement which its morphogenesis does not much addressed and thus the relationship to pre-floral stage, in particular under sub optimal conditions those mainly become a problem in paddy field in the tropics and sub tropics.
This work could not be accomplished without support from the supervisors, research team, colleagues, friends and family members. The author would like to gratitude to:
1. Prof Dr Sudirman Yahya, Dr Sudradjat, Dr Suwarto as supervisors committee from IPB for the suggestions, advices, support during a long period of PhD. 2. Dr Delphine Luquet and Dr Tanguy Lafarge as supervisors committee from
Montpellier SupAgro, for counted me in PAM (Phenotypic and Adaptation of Monocots) team, CIRAD, for the advices, assist, understanding and support during ―not easy-three years period‖ in France.
3. All jury members who evaluated and approved my manuscript. Thank you for the external examiners: Dr Suwarno, Dr Bruno Andrieu, Dr Buang Abdullah, Dr Nobuya Kobayashi and Prof Dr Didy Sopandie for the suggestions and corrections.
4. Dr Michael Dingkuhn and all phenotyping team members in CESD (Crop and Environment Science Division), IRRI, Philippines for the advices, support and courage to pass my ―collapsed-period‖ in IRRI.
5. Dr Tsutomu Ishimaru in PBGB (Plant Breeding and Genetics and Biotechnology), IRRI, who provided the seed materials for all my experiments and as collaborator in field experiment.
6. Dr Stefan Jouannic (IRD, France), Prof Dr Xinyou Yin (Wageningen University) and Dr Dominique This (Montpellier SupAgro) for advices and suggestions as thesis committee members in Montpellier SupAgro.
7. Dr Naresworo, Prof Dr Nahrowi and Dr Irwan Katili as PiC of double degree program and Dr Didier Pillot from Agreenium for help and mediation for this program since the beginning until the end of my PhD.
8. Prof Dr Munif Ghulamahdi and Dr Maya Melati as head of study program of Agronomy and Horticulture, Bogor Agricultural University and the staff. 9. Faculty of Agriculture, University of Lambung Mangkurat for
recommendation and support the PhD.
10. Directorate General of Higher Education of Indonesia, Campus France, Agreenium and CIRAD for PhD scholarships.
11. My office-mates in PAM team, who already became a ―Dr‖, Sébastien Peraudeau for help, discussion and sharing knowledge about rice; and Lisa Perrier for help and sympathy.
13. Friends: graduate students of Agronomy and Horticulture (Forsca AGH) and double degree group 2010, thank you for the support and togetherness for the first two years in IPB; Indonesian student association in Montpellier (Perhimpunan Pelajar Indonesia di Montpellier = PPIM), thank you for becoming a family, sharing the happiness and sadness as we are all away from home; around the world-friends in IRRI, thank you for the support, cheerful and discussion about lab/field work at dinner time in cafeteria. All of you had colored my days and enriched my experience in every phase of my PhD.
14. Finally my beloved husband RM Cahyo Wiryanto, my kids Annisa Yorikasyifa Maharani and M Indra Arrafi Adn, my beloved parents and all families for everlasting support, the understanding, patience and sincerity during my PhD
Hopefully this PhD work would be benefits to the science particularly in agronomy, physiology and breeding.
Bogor, January 2016
TABLE OF CONTENTS
1 INTRODUCTION 1
2 PROBLEMATIC AND STATE OF THE ART 3
Rice Development and Growth Cycle 3
Vegetative Phase 3
Reproductive Phase 4
Ripening Phase 5
Rice Panicle Development 5
Phenotypic Plasticity of Rice 6
Phenotypic Plasticity of Ppanicle Development and Architecture 7
Challenges in Breeding for Panicle Size 8
3 OBJECTIVES, OVERVIEW OF THE CHAPTERS AND THE METHODOLOGY 9 Methodological overview 10 References 13 4 RICE PANICLE PLASTICITY IN NEAR ISOGENIC LINES CARRYING A QTL FOR LARGER PANICLE IS GENOTYPE AND ENVIRONMENT DEPENDENT 17 Abstract 17
Background 17
Materials and Methods 19
Results 24
Discussion 34
Conclusion 38
References 38
Supplementary material 42
5 THE QTSN POSITIVE EFFECT ON PANICLE AND FLAG LEAF SIZE IS ASSOCIATED WITH AN EARLY DOWN-REGULATION OF TILLERING 44 Abstract 44
Introduction 44
Materials and Methods 46
Results 52
Discussion 66
Conclusion 68
References 68
Supplementary material 72
6 QTSN4 EFFECT ON FLAG LEAF SIZE, PHOTOSYNTHESIS AND PANICLE SIZE, BENEFITS TO PLANT GRAIN PRODUCTION DEPENDING ON ITS ACCESS TO LIGHT 76 Abstract 76
Introduction 76
Materials and Methods 78
Discussion 88
References 91
Supplementary material 95
7 SYNTHESIS, GENERAL DISCUSSION AND PERSPECTIVE 99
Synthesis 99
General Discussion 100
Perspectives 105
References 106
CURRICULUM VITAE 108
LIST OF TABLES
OBJECTIVES, OVERVIEW OF THE CHAPTERS AND THE METHODOLOGY
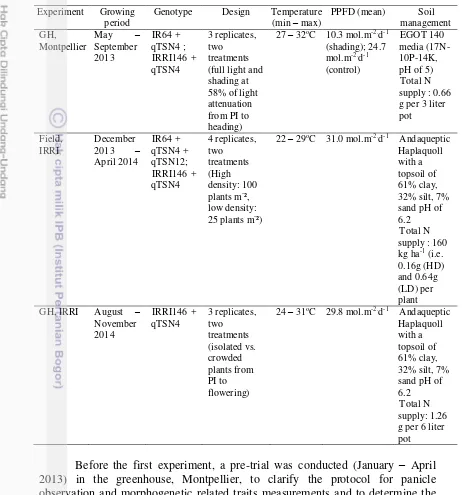
1. Environmental characteristics of three experiments in greenhouse
(GH) Montpellier, field and GH IRRI 11
RICE PANICLE PLASTICITY IN NEAR ISOGENIC LINES CARRYING A QTL FOR LARGER PANICLE IS GENOTYPE AND ENVIRONMENT DEPENDENT
1. Description of parameters with the unit of measurement 22 2. Effect of QTL (Q) and treatment (T) on single tiller of green house
experiment (mean ± standard deviation) ns, *, **, *** not significant, significantly different at 5%, 1% and 0.1% levels, respectively for
each pair of genotype (n = 5) 25
3. Effect of QTL (Q) and treatment (T) on single tiller of field experiment (mean ± standard deviation) ns, *, **, *** not significant, significantly different at 5%, 1% and 0.1% levels, respectively for
each pair of genotype (n = 4) 26
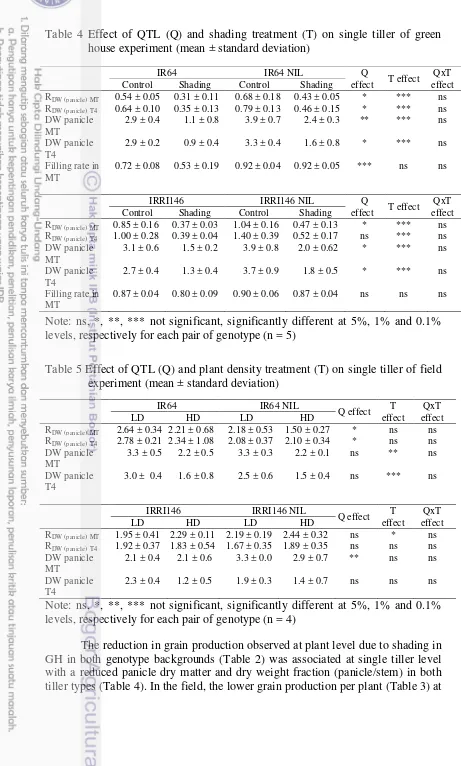
4. Effect of QTL (Q) and treatment (T) on single tiller of greenhouse experiment (mean±standard deviation) ns, *, **, *** not significant, significantly different at 5%, 1% and 0.1% levels, respectively for
each pair of genotype (n=5) 28
5. Effect of QTL (Q) and treatment (T) on single tiller of field experiment (mean ± standard deviation) ns, *, **, *** not significant, significantly different at 5%, 1% and 0.1% levels, respectively for
each pair of genotype (n = 4) 28
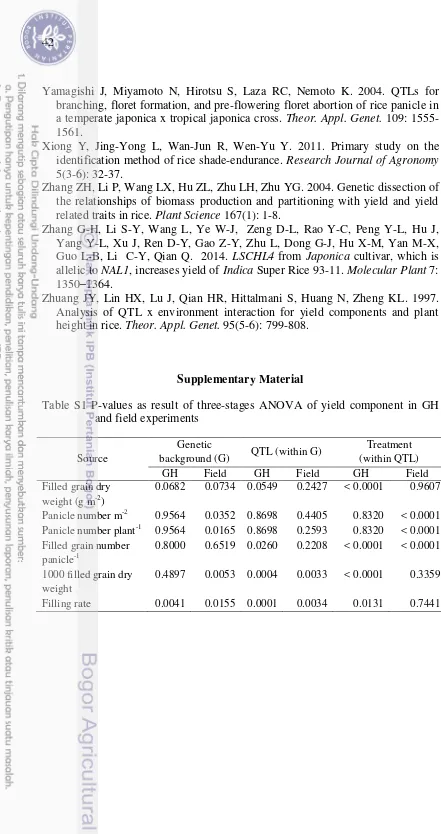
S1. P-values as result of three-stages ANOVA of yield component in GH
and field experiments 42
THE QTSN POSITIVE EFFECT ON PANICLE AND FLAG LEAF SIZE IS ASSOCIATED WITH AN EARLY DOWN-REGULATION OF TILLERING
1. Details of plant materials 47
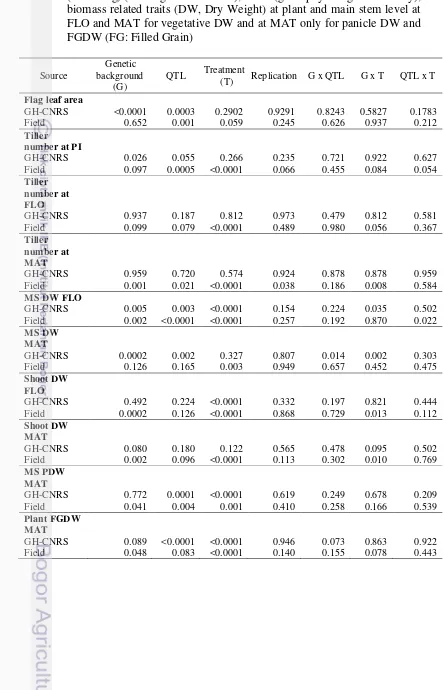
2. ANOVA of flag leaf area, tiller number at PI (Panicle Initiation), FLO (flowering) (heading in GH-CNRS), MAT (grain physiological maturity), biomass related traits (DW, Dry Weight) at plant and main stem level at FLO and MAT for vegetative DW and at MAT only for
panicle DW and FGDW (FG: Filled Grain) 53
3. Response rate of traits to QTLs introgression in each pair of isoline in a given treatment (in the field-IRRI, LD is for Low Density, HD is for high density) and genetic background (IR64 and IRRI146) (A), to low access to light in each trial (field-IRRI, GH-CNRS) (B), for each genotype (parent, NIL, NIL1). Grey columns indicate no treatment effect as shading in GH-CNRS just imposed at PI 54 QTSN4 EFFECT ON FLAG LEAF SIZE, PHOTOSYNTHESIS AND PANICLE SIZE, BENEFITS TO PLANT GRAIN PRODUCTION DEPENDING ON ITS ACCESS TO LIGHT
1. Plant material description 78
2. Description of the trials used for a multi-environment analysis of qTSN4 effect on plant grain production, flag leaf dimension and spikelet number per panicle on the mains stem 79 S1. ANOVA of flag leaf area (FLA) in GH-CNRS 2013 and field 2014 95 S2. ANOVA of flag leaf width (FLW) in GH-CNRS 2013 and field 2014 95 S3. ANOVA of spikelet number per panicle (SPN) in GH-CNRS 2013
and field 2014 96
S4. ANOVA of plant grain dry weight (PGDW) in GH-CNRS 2013 and
field 2014 96
S5. ANOVA of photosynthetic parameters (CO2 assimilation and
Vcmax) in GH-CNRS 2013 97
S6. ANOVA of SLA and N content in GH-CNRS 2013 97
S7. ANOVA of leaf and internode starch in GH-CNRS 2013 98
LIST OF FIGURES
PROBLEMATIC AND STATE OF THE ART
1. The crop cycle of rice plant. PI: panicle initiation, FLO: flowering, MAT: maturity Description of parameters with the unit of
measurement 4
2. Differentiation of panicle architexctural components as provided by P-TRAP software: main axis length (A), primary branch length (B) and secondary branch length (C). Scale bar 5 cm (Adriani et al,
OBJECTIVES, OVERVIEW OF THE CHAPTERS AND THE METHODOLOGY
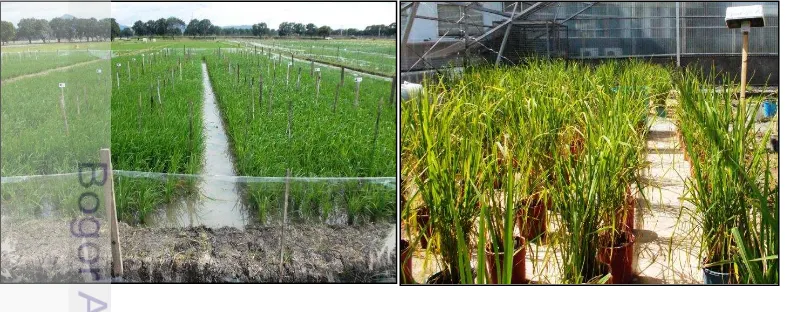
1. Control and shading treatment in greenhouse experiment, Montpellier 12 2. Field and greenhouse experiments in IRRI, Philippines 12 RICE PANICLE PLASTICITY IN NEAR ISOGENIC LINES CARRYING A QTL FOR LARGER PANICLE IS GENOTYPE AND ENVIRONMENT DEPENDENT
1. P-TRAP analysis resulting panicle structure with the rachis length (A), primary branch length (B) and secondary branch length (C). Scale bar
5 cm 23
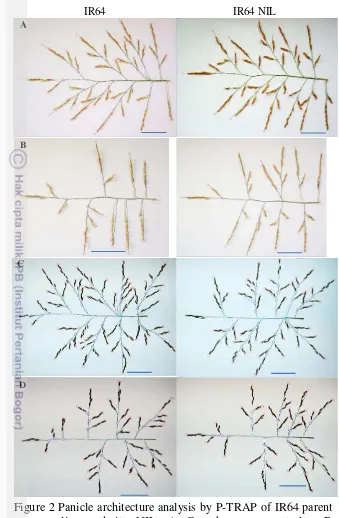
2. Panicle architecture analysis by P-TRAP of IR64 parent line and its NIL. A Greenhouse – control. B Greenhouse – shading. C Field – low density. D Field – High density. Scale bar 5 cm 30 3. Panicle architecture traits of main tiller by PTRAP in the greenhouse
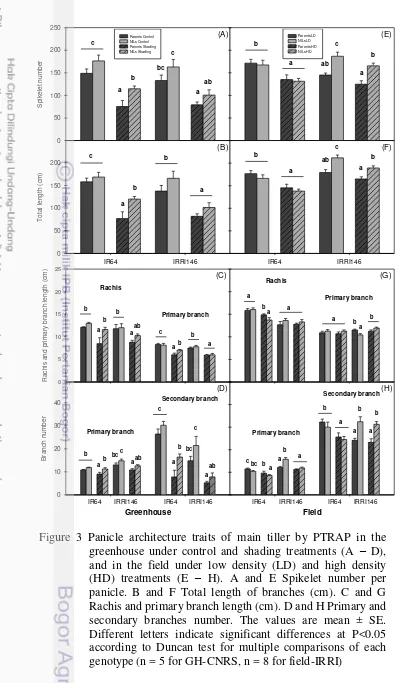
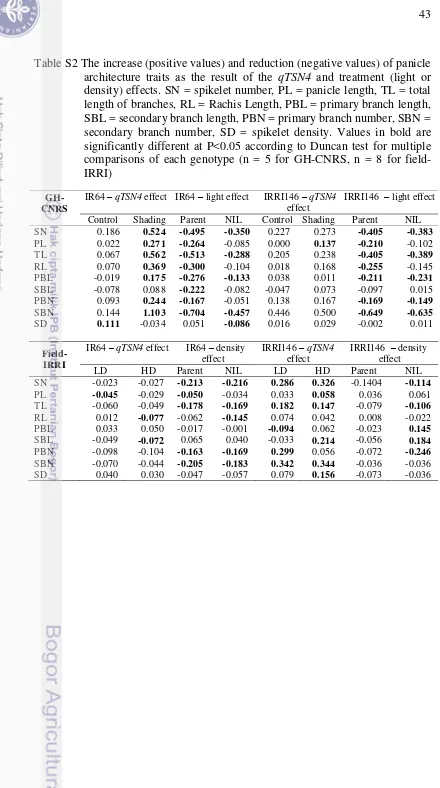
under control and shading treatments (A – D), and in the field under low density (LD) and high density (HD) treatments (E – H). A and E Spikelet number per panicle. B and F Total length of branches (cm). C and G Rachis and primary branch length (cm). D and H Primary and secondary branches number. The values are mean ± SE. Different letters indicate significant differences at P<0.05 according to Duncan test for multiple comparisons of each genotype (n = 5 for GH-CNRS,
n = 8 for field-IRRI) 32
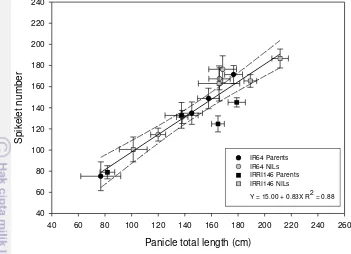
4. Relationships between panicle total length (cm) and spikelet number of main tiller across treatments and experiments. Regression curves are associated with confidence interval at P = 0.05 (n = 5 for
GH-CNRS, n = 8 for field-IRRI) 33
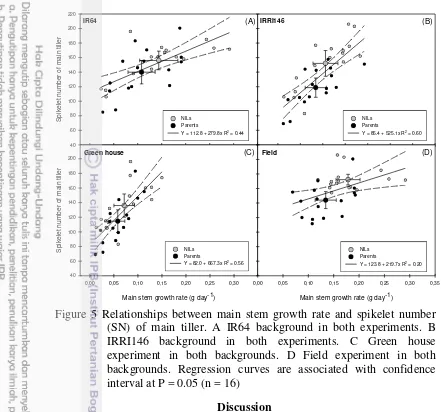
5. Relationships between main stem growth rate and spikelet number (SN) of main tiller. A IR64 background in both experiments. B IRRI146 background in both experiments. C Green house experiment in both backgrounds. D Field experiment in both backgrounds. Regression curves are associated with confidence interval at P = 0.05
(n = 16) 34
THE QTSN POSITIVE EFFECT ON PANICLE AND FLAG LEAF SIZE IS ASSOCIATED WITH AN EARLY DOWN-REGULATION OF TILLERING
1. Plant tiller number (A, D), leaf number on the main tiller (B, E) and stem length of the main tiller (C, E) of parent (black) and NIL (grey) in IR64 (A – C) and IRRI146 (D – F) background, under control (C) and shading (S) in GH-CNRS trial. The valies are mean ± SE. n = 3 55 2. Plant tiller number (A, D), leaf number on the main tiller (B, E) and
stem length of the main tiller (C, E) of parent (black) and NIL (grey) in IR64 (A – C) and IRRI146 (D – F) background, under low density (LD) and high density (HD) in field trial. The values are mean ± SE. n
= 4 57
NIL (grey) and NIL1 (white) in IR64 background (A) and IRRI146 background (B) in GH-CNRS under control and shading, in IR64 background (C) and IRRI146 background (D) in the field under low density (LD) and high density (HD), in IRRI146 background (E) in GH-IRRI under crowded and isolated plants. The values are mean ± SE. Results of Duncan test for multiple comparisons of each genotype per treatment at 5% level are shown in the letters above the bars. n = 4 in GH-CNRS and filed-IRRI, n = 3 in GH-IRRI. 58 4. Plant filled grain dry weight (A, E), main stem panicle dry weight at
maturity (B, F), plant shoot biomass at maturity (C, G), plant green leaf area at flowering (D, H) under control (C) and shading (S) in GH-CNRS (A – D), under low density (LD) and high density (HD) in field-IRRI (E – J). The values are mean ± SE. Results of Duncan test for multiple comparisons of each genotype per treatment at 5% level are shown by the letters above error bars. n = 5 at maturity and n = 4
at flowering in GH-CNRS, n = 4 in field-IRRI 61
5. Relationship between tillering rate from initial measurement to panicle initiation (PI) and main stem growth rate from PI to flowering (FLO) of the parent (black symbol) and the NIL (grey symbol), in IR64 background in GH-CNRS and field trials (A), in IRRI146 background in GH-CNRS and field trials (B), in GH-CNRS in IR64 and IRRI146 backgrounds (C), in field-IRRI experiment in IR64 and IRRI146 backgrounds (D). The values are mean ± SE. Regression curves are associated with confidence interval at P = 0.05. n = 40 for IR64 background and field-IRRI trial, n = 32 for IRRI146 background and GH-CNRS trial for regression curve 62 6. Relationship between main stem growth rate from panicle initiation
(PI) to flowering (FLO) and main stem panicle dry weight at maturity of the parent (black symbol) and the NIL (grey symbol), in IR64 background in GH-CNRS and field trials (A), in IRRI146 background in GH-CNRS and field trials (B), in GH-CNRS in IR64 and IRRI146 backgrounds (C), in fild-IRRI experiment in IR64 and IRRI146 backgrounds (D). The values are mean ± SE. Regression curves are associated with confidence interval at P = 0.05. n = 40 for IR64 background and field-IRRI trial, n = 32 for IRRI146 background and GH-CNRS trial for regression curve 63 7. Relationship between plant shoot growth rate from panicle initiation
(PI) to flowering (FLO) and plant panicle dry weight at maturity of the parent (black symbol) and the NIL (grey symbol), in IR64 background in GH-CNRS and field trials (A), in IRRI146 background in GH-CNRS and field trials (B), in GH-CNRS in IR64 and IRRI146 backgrounds (C), in field-IRRI experiment in IR64 and IRRI146 backgrounds (D). The values are mean ± SE. Regression curves are associated with confidence interval at P = 0.05. n = 42 for IR64 background and field-IRRI trial, n = 34 for IRRI146 background and GH-CNRS trial for regression curve 64 8. Carbon assimilation (A, B) and internode starch concentration during
(white) under control (C) and shading (S) in GH-CNRS (A, C), under low density (LD) and high density (HD) in field-IRRI (B, D). The values are mean ± SE. Results of Duncan test for multiple comparisons of each genotype per treatment at 5% level are shown in the letters above the bars. n = 3 in GH-CNRS, n = 4 in field-IRRI 65 S1. The relative (NIL-P) of IRRI146 background in GH-CNRS under
control. Leaf number on the main tiller (A) Tiller number per plant (B) Stem length of the main tiller (C) Individual leaf area at flowering and spikelet number per panicle at maturity (D) Peduncle and internode length at maturity (E) Peduncle and internode thickness at maturity (F) 72 S2. The relative (NIL1-P) of IR64 background in field-IRRI under low
density. Leaf number on the main tiller (A) Tiller number per plant (B) Stem length of the main tiller (C) Individual leaf area at flowering and spikelet number per panicle at maturity (D) Peduncle and internode length at maturity (E) Peduncle and internode thickness at maturity (F) 73 S3. Relationship between plant shoot growth rate from panicle initiation
(PI) to flowering (FLO) and plant grain dry weight at maturity of the parent (black symbol) and the NIL (grey symbol), in IR64 background in GH-CNRS and field trials (A) in IRRI146 background in GH-CNRS and field trials (B) in GH-CNRS in IR64 and IRRI146 backgrounds (C) in field-IRRI experiment in IR64 and IRRI146 backgrounds (D). The values are mean ± SE. Regression curves are associated with confidence interval at P = 0.05. n = 42 for IR64 background and field-IRRI trial, n = 34 for field-IRRI146 background and GH-CNRS trial for
regression curve 74
S4. Carbon assimilation (A) and internode starch concentration during panicle development (B) of parent (black), NIL (grey) under isolated and crowded population in GH-IRRI. The values are mean ± SE. Results of Duncan test for multiple comparisons of each genotype per treatment at 5% level are shown in the letters above the bars. n = 3 75 QTSN4 EFFECT ON FLAG LEAF SIZE, PHOTOSYNTHESIS AND PANICLE SIZE, BENEFITS TO PLANT GRAIN PRODUCTION DEPENDING ON ITS ACCESS TO LIGHT
1. Morphological characteristics measured at heading and grain physiological maturity in four trials detailed in Table 6.2.
C: control; S: shading at 58% from panicle initiation to heading; LD: low planting density, HD: high planting density; Cr: Crowded plants from panicle initiation to heading; Is: Isolated plants during this period. Letters indicate the level of significance of qTSN4 effect between parent and NIL at p<0.05 in each treatment (Tukey HSD test). Each bar represents mean ± s.e. (A) Flag leaf area (excepted for GH-IRRI 2012) (B) Flag leaf width on the main stem (C) Spikelet number per panicle on the main stem (D) Plant grain dry weight 83 2. Physiological leaf characteristics measured at three weeks after
significant difference at p<0.05 (Tukey HSD test) among values in a given experiment. Each bar represents mean ± s.e. (n=3)
(A)Photosynthetic rate (B) Maximum carboxylation rate (Vcmax) 85 3. Leaf anatomical characteristics and N status measured at three weeks
after paicle initiation in greenhouse experiment (GH-CNRS 2013) with two light treatments. C: Control; S: Shading. Different letters indicate significant difference at p<0.05 (Tukey HSD test) among values in a given experiment. Each bar represents mean ± s.e. (n=3) (A) Specific leaf area (SLA) (B) Dry weight based leaf nitrogen
content (Nm) 86
4. Relationship between photosynthetic rate at PAR saturation (A) and the leaf area N content (Na) for control and shade-acclimated plants in experiment GH-CNRS 2013. Presence or absence of qTSN4 is
indicated by +/- QTL 87
5. Starch content measured at three weeks after panicle initiation in greenhouse experiment (GH-CNRS 2013) with two light treatments. C: Control; S: Shading. Different letters indicate significant difference at p<0.05 (Tukey HSD test) among values in a given experiment. Each bar represents mean ± s.e. (n=5)
(A) Leaf starch (B) Internode starch 88
SYNTHESIS, GENERAL DISCUSSION AND PERSPECTIVE
1. Schematic hierarchisation of qTSN effect-trait heritability and the level of QTL x E interactions on the observed main traits 100 2. Conceptual scheme the synthesis of qTSN effect on sink and source
1 INTRODUCTION
This PhD work takes place within the context of the international consortium GRiSP (Global Rice Science Partnership) and more particularly in the project "Yield Potential Breeding‖ coordinated by International Rice Research Institute (IRRI) (http://www.cgiar.org/our-strategy/cgiar-research-programs/rice-grisp/). The challenge of this project is to improve yield potential of rice, i.e. grain production to meet the demand of the growing population by genomic and physiological approaches targeting source related traits. The present PhD thesis tackles this challenge through an ecophysiological approach.
Since the 1960‘s breeders in IRRI developed varieties those have been distributed globally and as important parental varieties in breeding program. In 1966, one of the breeding lines became a new cultivar, IR8, a semi-dwarf rice variety that could produce more grains of rice per plant when grown with certain fertilizers and irrigation, triggered the green revolution in the Asia tropical countries (Hossain, 1995). De data et al. (1968) reported his findings that IR8 rice yielded about 5 tons per hectare with no fertilizer, and almost 10 tons per hectare under optimal conditions. This was 10 times the yield of traditional rice. IR8 was a success throughout Asia, and followed by indica inbred cultivars such as IR36, IR64 and IR72 (Peng and Khush, 2003).
However, until today, using conventional breeding and selection, breeders have not been able to break yield ceiling in rice since the release of IR8 (Peng et al. 1999). As a result, yield stagnation of newly developed rice varieties has been observed in the tropics (GRiSP 2010). This led rice breeders in the late 1980s to select for genotypes with larger panicles (Dingkuhn et al. 1991; Peng et al. 1994, 2008; Li et al. 2014) by developing a new plant type (NPT) with the goal of increasing yield potential under tropical environments. Unlike IR64, the NPT varieties have several agronomic traits inherited from tropical japonica-type varieties: low tiller number, low number of unproductive tillers, large panicle, thick culm, lodging resistance and large, dark green flag leaves (Khush 1995).
environment (Okami et al. 2014); suggesting qTSN is prone to QTL x environment interactions. The added value of qTSN for future breeding programmes implies to better understand such interactions.
Accordingly, from an ecophysiological point of view, these NILs, when compared to their recipient lines, represent a relevant genetic material, to study the way (i) panicle size is elaborated with respect to tiller vigor and physiological performances and is described in function of branch and spikelet size and number, and (ii) yield components compensate depending on the environment i.e. to which extent they are plastic and compete for a given resource within the plant. Elaboration of panicle architecture and sizing was, however, poorly addressed by physiologists, as it develops mainly in hidden parts of the plants, i.e. encapsulated within the sheaths of leaves previously developed on a given tiller. This PhD work addresses the phenotypic plasticity of panicle development in response to limitation of carbohydrates due to incoming light restriction. It aimed at understanding rice panicle morphogenesis from initiation to flowering in terms of dimension, growth and developmental rate, panicle architecture and its relations with the whole plant morphogenetic pattern and resulting C source-sink relationships.
2 PROBLEMATIC AND STATE OF THE ART
Rice (Oryza sativa L.) is the first of the three most important cereal crop species (before wheat and maize) and forms the staple diet of about half of the world's population. The global production of rice in the world has been recorded at the level of 741 million tones in 165 million hectares of harvested area (FAOSTAT, 2013). Asia is the leader in rice production accounting for about 90% of the world's production. Over 75% of the world supply is consumed by people in Asian countries and thus rice is of immense importance to food security in Asia. The demand for rice is expected to increase further in view of expected increase in the population (Tripathi et al. 2011).
Rice Development and Growth Cycle
Rice is grown throughout a wide range of climates. It is a C3 plant that can grow in thermal conditions ranging from 15 to 35°C, although the range 20 – 30°C seems optimal, and that can express consistent tolerance under transient drought (Luquet et al. 2008; Pallas et al. 2013) and submergence (Septiningsih et al. 2015), and even in saline conditions (Kizhakkedath et al. 2015) and problem soils (Haefele et al. 2014).
Generally, rice plant growth is divided into three phases: vegetative (from germination to panicle initiation), reproductive (from panicle initiation to heading) and grain filling or ripening (from heading to maturity) (Li 1979).
Vegetative Phase
Figure 1 The crop cycle of rice plant. PI: panicle initiation, FLO: flowering, MAT: maturity
Reproductive Phase
Tillers continuously develop as the plant enters into the next step which is stem (internode) elongation that coincides with the reproductive phase (Figure 1). This stage may indeed begin most generally with panicle initiation (PI). During this period, tillers continue to increase in number and height, with no appreciable senescence of leaves noticeable (Tripathi et al. 2011). Internode elongation usually begins around the initiation of panicle primordia and continues until heading. The top five internodes may be elongated at heading. For this reason, the reproductive growth stage is sometimes called the internode elongation stage (Yoshida 1981).
The reproductive phase thus characterized by culm elongation (which increases plant height), plateau in tiller number, emergence of the flag leaf (the last leaf), booting, heading, and flowering. The initiation of panicle primordium starts about 30 days before heading; it corresponds to the time when the fourth leaf from the top begins to elongate. Before heading a considerable amount of starch and sugar accumulates in the culms and leaf sheaths, thus to be translocated to the grains during ripening. Panicle development and growth start with the neck-node differentiation and end when the pollen is fully matured. The total duration of panicle development varies with variety and weather and ranges from 27 to 46 days (Yoshida 1981).
As the panicle continues to develop, the spikelet becomes distinguishable (Figure 1). The young panicle increases in size and its upward extension inside the flag leaf sheath causes the leaf sheath bulge. This bulging of the flag leaf sheath is called booting. Booting is most likely to occur first in the main culm. At booting, senescing (aging and dying) leaves and juvenile tillers are noticeable at the base of the plant (Tripathi et al. 2011).
Heading means panicle exertion and is marked by the emergence of the panicle tip from the flag leaf sheath. The panicle continues to emerge until it partially or completely protrudes from the sheath. Spikelet anthesis (or flowering)
Vegetative phase Reproductive phase Ripening phase
PI
begins with panicle exertion, or on the following day. Consequently, heading is considered a synonym for anthesis in terms of calendar days in the life history of rice. It takes 10 –14 days for a crop to complete heading because of variation in panicle exertion between tillers of the same plant and between plants in the same field. From an agronomic point of view, heading is usually defined as the time when 50% of the panicles have exerted (Tripathi et al. 2011; Yoshida 1981). Ripening Phase
The ripening period is characterized by grain growth — increase in size and weight, changes in grain color, and senescence of leaves. At the early stages of ripening, the grains are green, then turn yellow as they mature. The texture of the grains changes from a milky, semifluid state to a hard solid. On the basis of such changes the ripening period is subdivided into milky, dough, yellow ripe, and maturity stages. Leaf senescence starts from the lower leaves and extends upward as the plant matures. Leaf senescence is faster in indica than in japonica rices and in warm regions than in cool regions. In cool regions, some leaves remain green even at maturity (Yoshida 1981).
Agronomically, the duration of ripening is from the date of heading to the time when the maximum grain weight is attained. The time of harvest is usually determined by past experience, grain color, and leaf senescence. The length of ripening and thus filled grain predominantly affected by temperature (Ahmed et al. 2015), solar radiation (Okawa et al. 2003; Restrepo and Garcés 2013), water requirement (Boonjung and Fukai 1996).
Rice Panicle Development
The term panicle is synonymous with the inflorescence of angiosperms, and is a proper appellation used for Graminae (Takeoka et al. 1993). The rice panicle is composed of rachis and spikelets. Rachis has peduncle (panicle base axis), main axis (distance from panicle neck node up to the tip node), primary, secondary or tertiary branches according to branching stages and pedicel (Takeoka et al. 1993; Yoshida 1981). Architectural components of the panicle are presented in Figure 2. Pedicels come out from each node at the tip of branches curve around their edge where spikelets are set. Spikelets are composed of glumes (which alternately develop on the rachis), lemma and paleae laterally developing on the floral axis, and floral organs (two lodicules, six stamens and one pistil) (Takeoka et al. 1993).
Figure 2 Differentiation of panicle architexctural components as provided by P-TRAP software: main axis length (A), primary branch length (B) and secondary branch length (C). Scale bar 5 cm
Phenotypic Plasticity of Rice
The dynamic responses of plant morphogenesis to its environment constitute is phenotypic plasticity. Phenotypic plasticity enables the plant to adjust its morphology and phenology to variable environments (Sultan 2000, Dingkuhn et al. 2005; Luquet et al. 2005).
From a physiological angle, phenotypic plasticity is the environment-induced diversity of phenotypes a given genotype can generate, brought about by the responsiveness of the plant‘s metabolic, growth and developmental processes to external and internal signals. This responsiveness may or may not involve changes in the expression patterns of genes, depending on whether the response is actively induced or inherent (constitutive) to the physiological apparatus. Phenotypic plasticity rarely affects the body plan (or basic structure) of the phenotype, but can strongly affect morphology, histology and phenology of a plant (Dingkuhn et al. 2006).
Plasticity phenomena can be classified in different ways, e.g. based on the nature of the involved traits (e.g. morphological, physiological and behavioral), the nature of the environmental signal (low access of light, population density) interpreted by the plastic developmental system or the relevant organism‘s performance (escape or avoidance) in the ecological context (Fusco and Minelli 2012).
The architecture of the plant is modified through the allocation of assimilate, which determines the growth rates of different organs. At the same time, the plant is subjected to external mechanical stresses, such as gravity or
B
wind forces, and must adapt its shape and develop support structures. In order to adapt their shape to the constantly changing environment, and in response to competition from nearby plants, individual plants gradually develop their architecture according to source – sink activities and endogenous signals (Guo et al. 2011).
The plasticity of rice as induced by phosphorus (P) deficiency corresponds to a reduction of shoot growth and thus assimilates demand, while root growth is not inhibited or even triggered. It was suggested that morphogenetic effects of P deficiency are the result of modified relationships among sinks, and specifically, inhibition of leaf expansion (Luquet et al. 2005).
Under suboptimal cropping conditions (no abiotic stress), rice plant morphology is strongly affected, amongst others, by planting density, a major characteristic of cultural practices (Zhang and Yamagishi 2010; Oghalo 2011). Depending on planting density, plant-plant competition for light and asasociated reduction in plant internal availability of C assimilates resources, will occur more or less rapidly during crop cycle , resulting in a variable regulation of plant morphogenesis in timing and intensity (tillering, organ size, starch remobilization, senescence) (Lafarge et al. 2010). With respect to yield potential and its optimization by the genotype and the cultural practices, it is thus crucial to understand the Genotype X Environment interactions (GxE), i.e. the level of phenotypic plasticity of yield component traits, panicle number and morphology in first place. While many studies addressed the phenotypic plasticity of rice at the vegetative stage (Luquet et al. 2005) under phosphorus deficiency, Luquet et al. (2008) under drought, Lafarge et al. (2010) under shading), that of panicle formation was much less explored.
Phenotypic Plasticity of Panicle Development and Architecture
Panicle development is a key developmental stage in rice because at this stage plant switches from vegetative to reproductive development and source-sink relations change to allocate a part of photoassimilates to reproductive sinks, namely growing spikelets and kernels (Streck et al. 2009), in addition to elongating culms and accumulating C reserves.
The stages of panicle development are strongly influenced by G x E interactions. For instances, it was shown that elevated CO2 can compensate the
Challenges in Breeding for Panicle Size
In order to raise the yield ceiling, different breeding strategies had conducted with a key focus on large panicle, in terms of many fertile spikelets, since the conception of new plant types with varieties having limited tillering ability (New Plant Type, NPT: Dingkuhn 1991; Peng et al. 1994; Super Hybrid Rice: Peng et al. 2008; Li et al. 2014). These large panicles raised, however, questions on the adequate panicle structure and size for efficient grain filling and the trade-off between panicle size and number. Indeed the QTL qTSN4 which was recently developed by Fujita et al. (2009), exhibited such physiological trade-offs between panicle size and panicle number (Fujita et al. 2013), leading instability in grain production under different culture practice (Okami et al. 2014). The qTSN then becomes an interesting material of understanding this trade-off and the plasticity of the panicle.
3 OBJECTIVES, OVERVIEW OF THE CHAPTERS AND THE METHODOLOGY
The GRiSP, (Global Rice Science Partnership, WEBSITE) and more particularly Yield Potential project aims at Increasing the yield potential in rice using genomic and physiological approaches. In this context and with respect to abovementioned challenge and hypothesis, the goal of this PhD project is to provide further insight on the traits explaining i) genetic variation and , ii) phenotypic plasticity in response to plant C source-sink relationships. For this purpose, original genetic, of current interest for breeders at IRRI, was used consisting of isolines carrying qTSN4 (or qTSN12), a QTL enhancing flag leaf and panicle size. This material was studied in contrasting situations of plant access to light as a factor affecting plant C source-sink relationships. The fourth chapter entitled ―Rice panicle plasticity in near-isogenic lines carrying QTL for larger panicle is genotype and environment dependent” addresses abovementioned hypotheses under contrasted situations of plant access to light and thus to C assimilates. It discusses the way panicle architecture is related to genotypic and C assimilation differences and its association with organ vigor in morphogenetic development traits in 2 pairs of contrasted genotypes (NILs vs parents), under full light and low light conditions in greenhouse Montpelier, and low vs high density in field IRRI trials.
The chapter 5 aims at understanding the response of rice panicle morphogenesis to whole plant and local (stem, leaf) non-structural carbohydrates availability and source to sink balance. In the second chapter ”The qTSN positive effect on panicle and flag leaf size of rice is associated with an early down-regulation of tillering” explores the role of plant morphogenesis (tillering, leaf appearance, stem elongation), biomass accumulation in organ and the whole plant, conjointly with C assimilation and sugar related traits. The data collected in Montpellier in a greenhouse in 2013; in IRRI, Philippines in the field and in greenhouse (2014) on two high yielding genotypes (IR64 and IRRI146) those were compared to their Near Isogenic Lines (NIL) carrying QTL qTSN4 and QTL qTSN12 were described in this chapter.
Finally, the last chapter is a general discussion of this work. Considering the results of Montpellier and IRRI experiments in chapters 4, 5, 6. It addresses the opportunities and limits of the present work regarding the plasticity of panicle and its response to the introgression of QTLs carrying larger leaf and panicle size, and low access of light; the yield component related traits as well as the consequences for physiological and genetic studies. Future physiological and genetic studies are suggested to better understand genotype and environment dependent that limit the panicle size and thus grain yield under full and low access of light.
Methodological Overview
To date, many QTLs were identified in rice to increase panicle size with the final goal of increasing grain yield. Recently, Fujita et al. (2009, 2012, 2013) revealed, by using simple sequence repeat (SSR) markers, a QTL, qTSN4, that enhances panicle size through higher total spikelet number (TSN) per panicle and that is located on the long arm of chromosome 4. This QTL was confirmed to increase grain yield, through larger flag leaf and panicle size, under non-limiting environment in the IRRI farm, Philippines, across 3 distinct growing seasons (Fujita et al. 2013). Recently, it was reported that this QTL leads to fewer but larger tillers under well-watered and drought-rewatering treatments (Okami et al. 2015). However,higher grain yield associated with this QTL was reported only under given culture practices as observed under flooded and aerobic culture in summer field experiments in Japan (Okami et al. 2014).
pairs of genotype (NIL vs parent), will be used for the next trials as we observed the lowest growth and development of two NPT lines.
In the first experiment, that was conducted in GH-Montpellier, accordingly, only two pairs of genotypes (NIL vs. parent), were grown under deep shading (58% of light attenuation) from panicle initiation (PI) up to heading. The shading set up and the GH conditions are presented in Figure 1.
Figure 1 Control and shading treatment in greenhouse experiment, Montpellier In IRRI, the same two genetic backgrounds as in GH Montpellier, with an additional pair of P/NIL that is IR64 and NIL1 carrying qTSN12, were grown in the field during the dry season under two planting densities, 25 and 100 plants m-2, and continuous flooding and appropriate N application for high yield. The two densities included the common situation as used in breeding fields, 25 plants m-2, and a situation where plants were confronted to high inter-plant competition for access to light (Figure 2).
A small experiment was also conducted at IRRI with plants in pots in the greenhouse during the wet season with a pair of P/NIL that is IRRI146 and its NIL (qTSN4). under two plant spacing from PI up to flowering, one as the common density within farmers‘ fields (Crowded, 25 plants m-2), the other close to isolated plants, 60 cm x 60 cm (2.78 plants m-2) (Figure 2).
In all trials, panicle development was observed weekly during the first two weeks after PI time by meristem dissection, panicle fixation and microscopic analysis provided by Histalim, an independent laboratory in food histology in Montpellier. At flowering and maturity, panicle architecture was then characterized by analysing its picture with help of a Java-based stand-alone software, P TRAP. This software enables to automatize the extraction of parameters such as individual axis length and number, and spikelet number (Figure 1 Chapter 2). Due to difficulties in interpreting microscopic images (the first two weeks after PI) and P TRAP analyses at flowering (because of non-fully developed panicles), only images at maturity have been exploited in this study. To correlate panicle architecture to the individual plant status and growth rate, measurements of plant height (distance from the base of the plant to the highest collar), green tiller number, green and dead leaf number on the main stem, organ dry weight (leaves, stems, sheath, and panicle for the main stem, for two extra tillers and for the whole plant) were collected at each developmental stage, i.e. at PI, flowering and maturity. In addition, photosynthesis and sugar content were measured to enlarge the understanding of the control of panicle architecture to the interaction of source-sink activities.
The following chapter dedicated to research paper submitted in RICE journal. This chapter highlighted the increase of panicle size in the presence of qTSN4 through greater architecture in terms of panicle branching and spikelet number. Variation in panicle size was related to pre-floral stem dry-weight growth suggesting qTSN4 increases primarily assimilate resources available at tiller level, followed by the trade-offs between panicle size and number. The effect of qTSN4 on grain production cannot be confirmed at crop level explaining some of genetic background, treatment and environment effects.
References
Ahmed N, Tetlow IJ, Nawaz S, Iqbal A, Mubin M, Nawaz ul Rehman MS, Butt A, Lightfoot DA, Maekawa M. 2015. Effect of high temperature on grain filling period, yield, amylase content and activity of starch biosynthesis enzymes in endosperm of basmati rice. J. Sci. Food Agric. 95(11):2237-2243.
Boonjung H and Fukai S. 1996. Effects of soil water deficit at different growth stages on rice growth and yield under upland conditions. 2. Phenology, biomass production and yield. Field Crops Research 48(1): 47-55.
Choi W-J, Lee M-S, Choi J-E, Yoon, S, Kim H-Y. 2013. How do weather extremes affect rice productivity in a changing climate? An answer to episodic lack of sunshine. Global Change Biology 19(4): 1300-1310.
De Datta SK, Tauro AC, Balaoing SN. 1968. Effect of plant type and nitrogen level on growth characteristics and grain yield of indica rice in the tropics. Agron. J. 60 (6): 643–7.
Dingkuhn M, Luquet D, Quilot B, de Reffye, P. 2005. Environmental and genetic control of morphogenesis in crops: towards models simulating phenotypic plasticity. Australian Journal of Agricultural Research 56(11): 1289-1302. Dingkuhn M, Luquet D, Kim H, Tambour L, Clement-Vidal A. 2006.
EcoMeristem, a model of morphogenesis and competition among sinks in rice. 2. Simulating genotype responses to phosphorus deficiency. Functional Plant Biology 33(4): 325-337.
Endo-Higashi N and Izawa T. 2011. Flowering Time Genes Heading date 1 and Early heading date 1 Together Control Panicle Development in Rice. Plant and Cell Physiology 52, 1083-1094.
FAOSTAT 2013. http://faostat3.fao.org/home/E
Fujita D, Santos RE, Ebron LA, Telebanco-Yanoria MJ, Kato H, Kobayashi S, Uga Y, Araki E, Takai T, Tsunematsu H, Imbe T, Khush GS, Brar DS, Fukuta Y, Kobayashi N. 2009. Development of introgression lines of an Indica-type rice variety, IR64, for unique agronomic traits and detection of the responsible chromosomal regions. Field Crops Research 114: 244-254.
Fujita D, Tagle AG, Ebron LA, Fukuta Y, Kobayashi N. 2012. Characterization of near-isogenic lines carrying QTL for high spikelet number with the genetic background of an indica rice variety IR64 (Oryza sativa L.). Breeding Science 62: 18-26.
Fujita D, Trijatmiko KR, Tagle AG, Sapasap MV, Koide Y, Sasaki K, Tsakirpaloglou N, Gannaban RB, Nishimura T, Yanagihara S, Fukuta Y, Koshiba T, Slamet-Loedin IH, Ishimaru T, Kobayashi N. 2013. NAL1 allele from a rice landrace greatly increases yield in modern indica cultivars. Proceedings of the National Academy of Sciences of the United States of America 110, 20431-20436.
Fusco G and Minelli A. 2012. Phenotypic plasticity in development and evolution: facts and concepts. Philosophical Transactions of the Royal Society B-Biological Sciences 365(1540): 547-556.
Guo Y, Fourcaud T, Jaeger M, Zhang X, Li B. 2011. Plant growth and architectural modelling and its applications. Annals of Botany 107: 723 – 72. Haefele SM, Nelson A, Hijmans RJ. 2014. Soil quality and constraints in global
rice production. Geoderma 235: 250-259.
Hasegawa T, Koroda Y, Seligman NG, Horie T. 1994. response of spikelet number to plant nitrogen concentration and dry-weight in paddy rice. Agronomy journal 86(4): 673-676.
Hossain M, 1995. Sustaining food security for fragile environments in Asia: achievements, challenges and implications for rice research. In: Khush, G.S. (Ed.), Proceedings of the third international rice genetics symposium, Manila, Philippines, pp. 3–23.
Ikeda K, Sunohara H, Nagato Y. 2004. Developmental course of inflorescence and spikelet in rice. Breeding Science 54(2): 147-156.
Itoh J, Nonomura K, Ikeda K, Yamaki S, Inukai Y, Yamagishi H, Kitano H, Nagato Y. 2005. Rice plant development: from zygote to spikelet. Plant and Cell Physiology 46, 23-47.
Khush GS. 1995. Breaking the yield frontier of rice. GeoJournal 35: 329–332 Kizhakkedath P, Jegadeeson V, Venkataraman G, Parida A. 2015. A vacuolar
rice Porteresia coarctata (Roxb.) Tateoka. Molecular Biology Reports 42(6): 1091-1105.
Kobayasi K and Horie T. 1994. the effect of plant nitrogen condition during reproductive stage on the differentiation of spikelets and rachis-branches in rice. Japanese Journal of Crop Science 63(2): 193-199.
Lafarge T, Seassau C, Martin M, Bueno C, Clément-Vidal A, Shreck E, Luquet D. 2010. Regulation and recovery of sink strength in rice plants grown under changes in light intensity. Functional Plant Biology 37(5): 413-428.
Luquet D, Zhang BG, Dingkuhn M, Dexet A, Clément-Vidal A. 2005. Phenotypic plasticity of rice seedlings: Case of Phosphorus deficiency. Plant Prod. Sci. 8(2): 145-151.
Luquet D, Clement-Vidal A, Fabre D, This D, Sonderegger N, Dingkuhn M. 2008. Orchestration of transpiration, growth and carbohydrate dynamics in rice during a dry-down cycle. Functional Plant Biology 35(8): 689-704.
Li YH. 1979. Morphology and Anatomy of Grass Family Crops. Shanghai science and Technology Press, Shanghai. 138-142.
Li G, Zhang J, Yang C, Song Y, Zheng C, Wang S, Liu Z, Ding Y. 2014. Optimal yield-related attributes of irrigated rice for high yield potential based on path analysis and stability analysis. Crop J. 2: 235-243.
Oghalo SO. 2011. Effect of population density on the performance of upland rice (oryza sativa) in a forest-savanna transition zone. International Journal of Sustainable Agriculture 3 (2): 44-48.
Okami M, Kato Y, Kobayashi N, Yamagishi J. 2014. Agronomic performance of an IR64 introgression line with large leaves derived from New Plant Type rice in aerobic culture. European Journal of Agronomy 58, 11-17.
Okami M, Kato Y, Kobayashi N, Yamagishi J. 2015. Morphological traits associated with vegetative growth of rice (Oryza sativa L.) during the recovery phase after early-season drought. European Journal of Agronomy 64, 58-66. Okawa S, Makino A, Mae T. 2003. Effect of irradiance on the partitioning of
assimilated carbon during the early phase of grain filling in rice. Annals of Botany 92(3): 357-364.
Pallas B, Clement-Vidal A, Rebolledo MC, Soulié JC, Luquet D. 2013. Using plant growth modeling to analyze C source–sink relations under drought: inter-and intra specific comparison. Frontiers in Plant Science 4(437): 1-13.
Peng S, Khush GS, Cassman KG. 1994. Evolution of the new plant ideotype for increased yield potential, In: Cassman KG (Ed.). Proceedings of a workshop on rice yield potential in favorable environments. International Rice Research Institute, Philippines, pp 5-20.
Peng S, Cassman KG, Virmani SS, Sheehy JE, Khush GS, 1999. Yield potentialtrends of tropical rice since the release of IR8 and the challenge of increasingrice yield potential. Crop Sci. 39: 1552–1559.
Peng S and Khush GS. 2003. Four decades of breeding for varietal improvement of irrigated lowland rice in the International Rice Research Institute. Plant Prod. Sci. 6: 157–164.
Restrepo H. and Garcés G. 2013. Evaluation of low light intensity at three phenological stages in the agronomic and physiological responses of two rice (Oryza sativa L.) cultivars. Agronomía Colombiana 31(2): 195-200
Septiningsih EM, Hidayatun N, Sanchez DL, Nugraha Y, Carandang J, Pamplona AM, Collard BCY, Ismail AM, Mackill DJ. 2015. Accelerating the development of new submergence tolerant rice varieties: the case of Ciherang-Sub1 and PSB Rc18-Ciherang-Sub1. Euphytica 202(2): 259-268.
Streck NA, Lago I, Bosco LC, de Paula GM, Oliveira FB, Gabriel LF, Schwantes AP. 2009. Relationship between panicle differentiation and main stem leaf number in rice genotypes and red rice biotypes. Scientia Agricola 66(2): 195-203.
Sultan SE. 2000. Phenotypic plasticity for plant development, function and life history. Trends in Plant Science 5(12): 537-542.
Takeoka Y, Shimizu M, Wada T. 1993. Panicles. In: Matsuo and Hoshikawa (eds) Science of the rice plant. Morphology, vol 1. Food and Agriculture Policy Research Center, Tokyo, Japan, pp 295-338.
Tripathi KK, Warrier R, Govilla OP, Ahuja V. 2011. Biology of Oryza sativa L. (Rice). Department of Biotechnology. Ministry of Science and Technology and Ministry of Environment and Forests. Govt. of India. pp 12 – 23.
Qi J, Qian Q, Bu Q, Li S, Chen Q, Sun J, Liang W, Zhou Y, Chu C, Li X, Ren F, Palme K, Zhao B, Chen J, Chen M, Li C. 2008. Mutation of the rice narrow leaf1 gene, which encodes a novel protein, affects vein patterning and polar auxin transport. Plant Physiology 147, 1947-1959.
Wang Y and Li J. 2005. The plant architecture of rice (Oryza sativa). Plant
Molecular Biology 59: 75-84.
Yamagishi J, Miyamoto N, Hirotsu S, Laza RC, Nemoto K. 2004. QTLs for branching, floret formation, and pre-flowering floret abortion of rice panicle in a temperate japonica x tropical japonica cross. Theor. Appl. Genet. 109: 1555-1561.
Yoshida S. 1981. Fundamentals of Rice Crop Science. The International Rice Research Institute, Philippines. 269 pp.
4 RICE PANICLE PLASTICITY IN NEAR ISOGENIC LINES CARRYING A QTL FOR LARGER PANICLE AT DIFFERENT
ENVIRONMENTS
Abstract
Panicle architectural traits in rice (branching, rachis length, spikelet number) are established between panicle initiation and heading stages. They vary among genotypes and are prone to Genotype x Environment interactions. Together with panicle number, panicle architecture determines sink-based yield potential. Numerous studies analyzed genetic and environmental variation of plant morphology, but the plasticity of panicle structure is less well understood. This study addressed the response of rice panicle size and structure to limited light availability at plant level for near-isogenic lines (NILs) with IR64 or IRRI146 backgrounds, carrying the QTL qTSN4 (syn. SPIKE) for large panicles. Full light and shading in the greenhouse and two population densities in the field were implemented. The image analysis tool P-TRAP was used to analyze the architecture of detached panicles.
The qTSN4 increased total branch length, branching frequency and spikelet number per panicle in IRRI146 background in the field and greenhouse, and in IR64 background in the greenhouse, but not for IR64 in the field. In the field, however, qTSN4 reduced panicle number, neutralizing any potential yield gains from panicle size. Shading during panicle development reduced spikelet and branch number but qTSN4 mitigated partly this effect. Spikelet number over total branch length (spikelet density) was a stable allometry across genotypes and treatments with variation in spikelet number mainly due to the frequency of secondary branches. Spikelet number on the main tiller was correlated with stem growth rate during panicle development, indicating that effects on panicle size seemed related to resources available per tiller.
The qTSN4 effects on panicle spikelet number appear as indirect and induced by more direct effects on pre-floral assimilate resources at tiller level, as indicated by (1) effects on panicle depending on the environment, (2) effects being non-specific to a given structural trait within the panicle, and (3) pre-floral stem growth governing panicle size.
Keywords: panicle plasticity, panicle architecture, branch number, branch length, spikelet number per panicle, pre-floral stem vigor, qTSN4
Background