N
HARDWOOD
PLWCK$Lb-I
I W P O R S
AWD
DOME?$TIC
PLYWOOD
IN
THE
u.&'"
*MARILET:
A
J&&AND
ANA~YSIS
% E ~ I Q U E
Fungsi permintaan i r n w tayu I$pis- d y .l@q (dm tropik) di Amerika Serikat diturunkan dari minimasi biaya produksi dalam'industri furnibre and fixtures den- k6ndelr PIlrsgsi pmduksilC%t+b-Douglas;. Secafa
-at, p w - b b i - h n i i a& f- diymsilren d m I l w p r q g e m deli fh?ai P* Gobb Dcqxlas, T i spdel4in~@ P q i thgSj permintean y a ~ g
WRWW
tpyerualart +yi i4lppr. tdadaph*ii ilan produk$i Gihiiun q d kxtuks diduga dari data' i m p r bul- "ntuk fi jodq hinuyix 1981 sanipai
t)es~ber''EM? dengatr niCir&& metode' ordinary lead s~uares. Htisil @nelltl& mentlnj~~ah b q w p *:lapis d m Mia- I m h B&a&*rhq&an b b n g substitusi maupun komplementcr bagi kayu lapis daun lebar domestik. Perubahan i-kayu lap& dam iebar ( d p tropik) dapat dijclnskpn oleh
lapis daun lebar impor terhadap kayu lapis daun
-
jarum domestik dan 0 t h prod~kSi fitnitufe, .$ , I T
-
: , r i / AIn the Unted States, h d w & plywobd is ,used in a wide range 'of '&pplIcdons,
ifaluding reridp@al $Od hbd-resiflknrial cme&uction, tesr ahd ' i ~ ~ o d e f m g , mamktured housing, furniture, and cabinets a d fixtures (U.S. Department of Commercq 1994). A major portion of the United States consumption of hardwood plywood hag been supplied by imports. Haynes (1990) sated that during the past decade, about 55 to 70 percent of hardwood plywood consumed in this
cbuntry has bsen 3 i i has been mainly dug, to $e pvai,b@lity ~f
liirge
qwint
of< imhrted tropical hardwdodplywood -from ,AS$
at
relatirely, lowprices, suitable for use in construction and furniture industries (U.S. Department of Commerce, 1994). But, there has been a growing awareness that the sources of supply of tropical hardwoods are not limitless; on the contrary, they are shrinking and, for the most part, and are not being harvested and managed on a
sustainable basis. This will cause world markets to experience increasing scarcity
*
Department of Forest aotlucts Technology, Faculty of Forestry, Bogor Agricultural University, IndonesiaSubstitution Between Hardwood PIywood Impaa
.
25shrinking and, for the most part, and are not being harvested and managed on a sustainable basis. This will cause world markets to experience increasing scarcity of tropical forest products during the next decades (lngram, 1993).
The objective of this study was to deter- mine the price elasticity of substitution between imports of hardwood plywood (especially of tropical origin) and domes- tic species in the U.S. market. The understanding of this response is impor- tant to improve knowledge of markets for tropical forest products, and particularly their relationship with markets for timbers of temperate species.
PREVIOUS WORK
Two previous analyses of the United States import demand of hardwood plywood have been conducted by Chou and Buongiorno in 1982 and 1983. Chou and Buongiorno (1982) estimated that the long-term elasticity of hardwood plywood imports were -1.98 with respect to real import price and 1.10 with respect to housing starts in the United States. Further, Chou and Buongiorno (1983a) estimated that the long-term own-price elasticities for imports were, from Korea,
-
1.95, Taiwan, -1.85, Japan, -1.81; the Philippines, -1.77, and an a b e g a t e restof the world, -1.79. Both studies used monthly data from 1974 to 1979. Chou and Buongiorno (1983b) found that imports of hardwood plywood were more responsive to changes in import price and
price of all commodities than to housing starts during the period January, 1974 to December, 1980.
Another study was conducted by Parthama and Vincent (1992) who found that the import price, the price of
hardwood plywood f b m other countries, and housing were significant deter- minants of import quantity. A 1 % decrease
in the Indchsian price raised U.S. import by nearly 3 %. This study analyzed the period July 1979 to December 1987.
THEORETICAL MODEL
Based on derived demand theory, demand for imported hardwood (or tropical) plywood are expressed as a function of (a)
a measure of activity in the sector using hardwood plywood; (b) the import price of hardwood plywood; (c) the price of it. most direct substitute in the form of domestically produced plywood; and (d) the price of all commodities.
Chou and Buongiorno (1982) and Parthama and Vincent (1992) have derived demand for hardwood plywood imports from residential construction activity in the United States. But, in this study, for empirical reasons the U.S. demand for plywood imports is derived from furniture and fixtures production. It is assumed that production of furniture and fmtures can be represented at the aggregate level by a generalized Cobb- Douglas production hction. The
production function for furniture
and
fixtures is (Dixon et al., 1980):[l] Y, = a Q;' DH,? DSPJ DAP4
Where Yt is the volume of furniture and
fmtures production; Qt is the quantity of
imported hardwood plywood (QJ or tropical plywood
(QT);
DHt and DSt are the quantities of domestically produced hardwood and softwood plywood con- sumed by tbe industry; DA, is the quantityof all other inputs used in combination
with DHt, DSt and Qt to produce Yt; and
26 Substitution Between Hardwood Plywood Imports
the a's are elasticities of furniture and towards the equitibritm level correspond- fixtwes production with respect to hard- ing to the new level of aVrritwa and wood BT tropical plywood kput and other fixtures production and prices. TIE rwson
inputs. T h y all are positive constants. is that most of US hardwood plywood
The corresponding cost fimction has the imports come from Southeast Asia, and
form: therefore the lag between the decision to
import and the time when the merchandise [2] Ct = PMPt Qt
+
PDHl DHt + PDSt arrives at US ports may be of severalDSt
+
PDAt DAt weeks. The partial adjustment model is :Where Ct is the cost of producing [4]
Q,
=b
P M P , ~ P D H ~ PDS? furniture and fixtures; and, P M P ~ PDH'PDA?
y,fi
PDSl and PDA, are, respectively, the
import price of hardwood plywood in which the parameters with asterisks are
(PMP,)
or tropical plywood(PMP,),
the short-term elasticities. Taking logarithms domestic price of hardwood plywood, the on both sides, the log-linear stochastic domestic price of softwood plywood and form of equation [4] is :the price of all other iaputs.
If we assume that producers choose the
E5]
ln QI = +B,*
InPMc
+pz'
in*t mix
that
minimizes cost, subject to P D H , + p; P D S , +/3,*
the technology described by equation [I], In PDA, + fl; In Y, + !Y In
Q,-,
the derived demand for total importedhardwood plywood is
(Varbm,
1984): + P I bWhere
p,,
&,/?,,
p,
andp,,
are long-term demand elasticities of hardwood (or tropical) plywood with respect to the import price of hardwood (or tropical).
*wood, the domestic price of hardwood M o o d , the domestic price of oftw woodthe price of all other inputs and and fixtures production, respec- tiway*
-
" ' *~ o d e t @] b
a
static equation. It measures long4&m effa of changes inqfimiture and f%um psduction arid prices on imports, .Hawevc~*acXllal
observations dodependent variable adjusts only in part
Where p, is a random error.
The expected sign of B,' is negative and
the remainiag are d l positive. The long- term estimates of the elasticities were then recovered as (Johnson st al, pp. 223-226):
and
p,
= B:( 1 - P )
DATA
This study used monthly data covering the period January 1981 to December 1987. Imports data on hardwood plywood (Q,J
were compiled from various issues of U S .
General Imports: Schedule A Commodity
-*
S u ~ i o n Between Hardwood Plywoad
by Corntry: Table 2. Schedule A Commodity by Country of Origin, customs values, f.as., and c.i.f., published by the U.S. Bunau of
the
Census U.S. Department9t
Comtneree,The
Standard International Trackr CWftcarim (SITC) codes for the comnrodities of iatertst are: 6347040 for plywood with a face piy of Philippines mahogany, bagtikan, red lauan, white lauan etc., 6347050 for plywood with a face ply of mahogany, and 6347070 for plywood with a face ply of Spanish cedar arrd other. Imports dataon tropical plywood (Q,) were obtained by excluding imports of hardwood from Canada from total hardwood plywood imports. Unit value of imports, inclusive of cost, insurance and fieight (c.i.f.) served as a measure of import price,
P M P, (PMPH and PMP,).
The United States prices of hardwood and softwood plywood, PDHt
and
Pb)i,
wweae measured by the producer price index for hardwoodaed
s o w plywood, as published in variousissues
of Producer Prices wd Price Indexes: Table 6.Producer Prices and Price Indexes for commodity groupings and individual items, published by the U.S. Bureau of Labor Statistics. This is also the source of the U.S. domestic producer price index for all commodities, PDA*. Furniture and fixtures production, Yt, in the U.S. was measured by the monthly index of furniture and fixtures industrial produc- tion, as published by U.S. Department of Commerce, Bureau of Economic Analy- sis, current business statistics (in CD
ROM
databank,
Item ID: EA BUSTAT SO1 085, February 18,1995).All data- were expressed
as
indices, with the June 1982 serving as the basis. None was seasonally adjusted.RESULTS
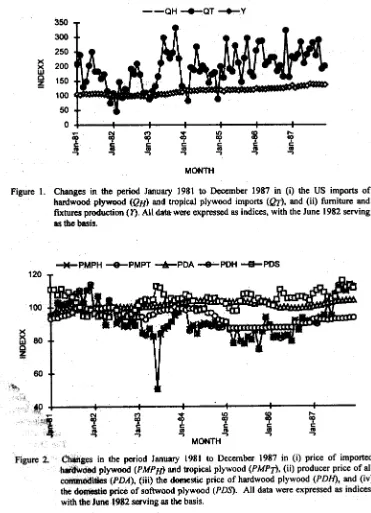
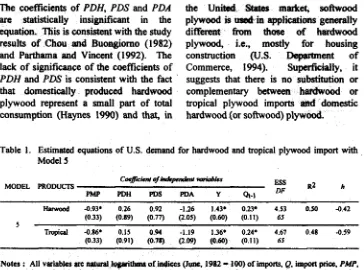
As shown in Figure 1
and
Figure 2, the quantity curves of imported brdwood and tropical plywood (Q, and Q,) overlap. The price curves of imported hardwood and tropical plywood (PMP,, and PMP,) overlap as well. Figure 1 also shows that quantity of hardwood and tropical plywood imports are subject to strong seasonal fluctuations. To solvethis
problem, unadjusted data plus dummy variables' were used to account for monthly seasonal fluctuations not captured by the other explanatory variables in this study (see Lorell 1963).Dynamic model
Model (5) was esfimated by ordinary least
squares. The mub appaar in Table 1.
An mefficieat9 have the expected signs, except for the negative coefficient of PDA, which would suggest sqne complementary between
im-
bani-wood (or tropical) plywood;
mi
all commodities, but the standard qmc ja &olarge to justifying any concl* The explanatory p e r of the
moSIBt
3s low, with adjusted coefficient of &inationit2 of 0.50 for hardwood plywood and of 0.48 for tropical plywood. The Durbin's h sEatistic supports the null hypothesis of no sshl d a t h at 5% significance
level. The h statistic is the computed t-
SWWQ of lagged residuals with Durbin's
method when
some of the repssors are lagged dependent variables (Johnson etal., 1987).
28 Substitution Betwam Hatdwood Plywood Imports
[image:5.432.23.394.48.561.2]MONTH
Figure 1. Changes in the period January 1981 to December 1987 in (i) the US imports of hardwood plywood (QH) and tropical plywood imports (QT), and (ii) furniture and
fwtures production (Y). All data were expressed as indices, with the June 1982 serving
as the basis.
Y
.
8
(3C
m
3
m3
tof
a9
tZ9
wJ
-
-J -3 -J '5MONTH
Figure 2. C h r t n p in the period January 1981 to December 1987 in (i) price of imported har'62aradKi plywood (PMPH) and tropical plywood (PMPT), (ii) producer price of all
c a ~ @ ~ d d ' i (PDA), (iii) the domestic price of hardwood plywood (PDH), and (iv) the dorm& price of softwood plywood (PDS). All data were expressed as indices, with the June 1982 serving as the basis.
Substitution &tween Hardwood Plywead 29
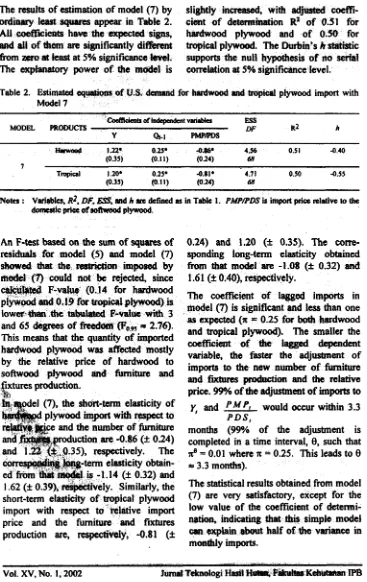
The coefficients of PDH, PDS and PDA are statistically insignificant in the equation. lliis is consistent with the study results of Chou and Buoagiomo (1982)
and Parthama
and
Vincent (1992). The lack of significance of the coefficients of PDH and PDS is consistent with the fact 'that domestically produced hardwood plywood represent a small part of total consumption (Haynes 1990) and that, in
the United States matket, softwood plywood is &in applications generally diffeFew
from
thase of hardwood plywood, i-e., mostly for housingconstruction S .
merit
ofCommerce, 1994). Superfkialiy, it suggests that there is no substitution or complementary between hardwood or tropical plywood imports
and
domestic hardwood (or softwood) plywood.Table 1. Estimated equations of U.S. demand for hardwood and tropical plywood import with
Model 5
Cwfikm s/in&pen&m mridlks
MODEL PROWCIS h
F'MP PDH PDS PDA Y Qt-1
Hanvacd -0.93' 0.26 0.92 -1.26 1.43. 0.23. 4.53 0.30 -0.42 (0.33) (0.89) (0.77) (2.05) (0.60) (0.11) 65
5
Tropical -0.86. 0.15 0.94 -1.19 1.36. 0.24. 4.67 0.48 -0.59 (0.33) (0.91) (0.71) (2.09) (0.60) (0.11) 65
Nates : All veriaMeo m aural mhtnsof iartices (Junc, 1982
-
100) of imports, Q, import price. PMP,domestic price h&vpod plywood. PDH, domestic price of sofhrvood plywood, PDS, pnnlucar price
index of all @mmo&itcs, FDA, finnitun and fixtures production. Y, respectively. Numbus in pucntt#scr rrc s t & d errors of cornspondig codficknts. ldicate coefficients significantly dibemt h m zero at the 5% signifi- level. E B and DF am, ~ v e t ysum of , ~squans of residuals and the number of degrees of freedom. ~2 and h am the d c i e n t of de&rmiastiaa
a c t e d for degree of freedom and the Lhrbin's statistic, respe4vcly.
However in Table 1, PMPt and PDSt have coeficients of same magnitude and opposite signs, so it is plausible to assume that the demand for imports is homoge- neous of degree zero in prices. This leads to a more parsimonious model :
P M P ,
[7] In
a
= q o +S.
ln-
+
6'P D S ,
In Y, + a l n Q,-, +
Ir,
Model (7) is special case of model (5) in which :
pi*
=-
B,'
and-
= 0, a hypothesis that was tested.Since all variables in the model (7) are
expressed in l o g d h s ,
tbs
coeff-t5'
can be iRte@
as
s?mbtdnn ek?$kityof hardwood (or tropical) plywood imports with respect to relative prices ( P M P,
,
the ratio of the import prim?.d
P D S ,
hardwood plywood to domestic
pri'ce
of softwood plywood), whereas 6 " ' b n be interpreted as the short-term *ticity of hardwood (or tropical) p-d imports with respectto
level Of production in fbrniture and f i r e s industry(r).
The long-term estimate of the elasticity(5
and8 )
wwettrcnrtcovered as :6*
=- (I
-
a ) '-
[image:6.428.40.404.47.317.2]30 Substitution &twbdn ~ o a d ~ a o d hnports
The results of estimation of model (7) by slightly i n d , with adjtrstsd c&-
oniimry last spares appear in TaMe 2. k t of detmmhfion
'
R
of 0.51 forAU
wffsietsts h w the qxcted signs, hardwood ptywood and of 0.50 forand all
of them art significantly difhmt tropical plywood. The Durbii's hSWWK:
fiwn
a m
abkast
at 5% significance W. supports the null hypothesis of tto -'IThe eq&w&ny power is comhttion at 5% signifimce level.
Table 2. Estimated o q wof U.SC deftrand for betQwwd .nd &+id plywood import with Model 7
Notm : Varicibles, ~ 2 , DF,
W I
sui h pc defined rc in Table 1. PMPIPDS is import price reletkc to the~ ~ p r i o i G O t ~ p l y w o 0 d .
An F-test based on the sum of squares of 0.24) and 1.20 (f 0.35). 'Iht corn-
ns*kWs for model (5) and model (7) sponding long-term elasticity obtained
shewed
tfiat
the m&dbn imposed by from that modtl are -1.08 (f 0.32) and mdei(7)
m t d notbe
rejected, since 1.61 (f 0.40), respectively.wuw
F-v.kIC (0.14 for h d w o o dccD,wimt of lsggd imports in p b , m c l .ad O.I9 for @*)-' is model
(7)
is significant and icaa than oneb w a - h n h c rim 3 m.xpoaod(n i0.21, fabohhatdWOOd and 65
ms
Of f k h ~ , '. 2.'16).and tropical plywood). The smaller the This means that the quantity of imported cotfficicat
of
the
lagged dependent hvdwood plywood affWcd mmtly variable, tho faster the adjustmat of by the relative price of hardwood to impaD to henolu nw of hi-
~ 0 f t W d
~ 3 w d
and fllflli- d=*
-
mm
.nd &@ rCla*e price. 9!% of the sdjustmcnt of imparts to
icity of y, and P M P, mid within 3.3 P D S ,
f firnitwe months (99% of the adjustment is
completed in a time interval, 8, such that
ne = 0.01 where n = 0.25. This leads to 8
a 3.3 mo*).
is -1.14 (f 0.32) and
.62 (* 0.39), +ely. similarly, the The statistical results obtained from model short-term
el&^
of q i c a l plywood (7) are very d s f a c t o ~ , except for the import to-'"nlative imp,,* low value of the coefficient of determi- price and the fmiw fnrtures nation, indicatingthat
this simplemodel
production
are,
mpectiveiy, -0.81 (fcm
@Wrn
half
of*
inm&iy imports.
- . ..- .,.. -". . - . .
[image:7.436.36.403.45.627.2]Substitution Between Hardwood Plywoad bpats
Distributed-lag model
A distributed-lag model was investigated as an alternative to the dynamic model
(7). The alternative model is :
PMP,
ln ( - ) t - r + Z 6,
PDS, I=O
where m indicates the length of the lag. Each ci, and 6 i measures the relative change in imports in month, t, arising from the relative change in the relative price and the number of furniture and
2
8, therefore measure the total or long-i=O
term elasticities of imports with respect to the relative price and the number of furniture and fktures production.
There is no theoretical reason for using a polynomial of a particular degree or a particular length of lag, m. A second- degree polynomial was used in this study. The value of m was set at 6 months
because it maximized
R2
for that polynomial. Instead, model (7) is in fact equivalent to. a distributed-lag model of infmite length, with parameters&
andS i
that decline exponentially as i increase.
fixtures production in month t-i.
5
5, and [image:8.430.34.408.44.625.2]i=O
Table 3. A distributed-lag demand model of hardwood plywood imports
Lag number I Coefficient of independent variables
(months) (PMP/PDSlt,l SE yt-I SE
4 -0.267 0.054 0.256 0.058
5 -0.214 0.043 0.205 0.047
6 -0.125 0.025 0.120 0.027
Sum -0.497 0.301 1.435 0.326
Mean lag 3 months 3 months
R2 0.55
ESS (DF) 4.12 (64)
DW 1.61
Notes : Variables, ~ 2 , DF and ESS are defined as in Table 1. SE and D W are standard errors and the Durbin-Watson statistic, respectively.
32 Substitution Between WdwBod Flywaod hnports
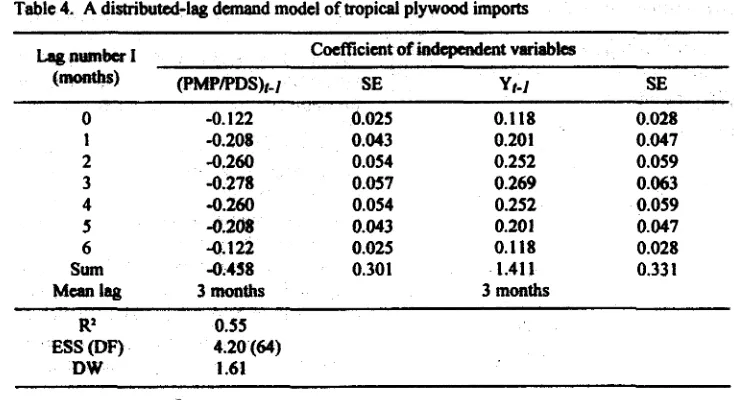
Table 4. A distributed-lag demand model of tropical plywood imports
L a g ~ ~ t n b c r I Coefficient ofirrdqraldent varkbk
(-1 (PW/PDS)I-I SE yt-1 SE
0 I 2 3 4 5 6 Sum Mean lag
-0.122 0.025
-0.208 0.043
-0,260 0.054
-0.278 0.057
-0.260 0.054
4.208 0.043
-0.1 22 0.025
-0.458 0.301
3 months
0.118 0.028
0.201 0.047
0.252 0.059
0.269 0.063
0.252 0.059
0.201 0.047
0.118 0.028
1.41 1 0.331
3 months
R2
ESS @F) DW
- -
N o h : Variables, RZ, L?SS, DF, SE and DW are defined as in Table 1 and Table 2.
The results of esthafio11 of model (9) by o r d i i Icast squa~es appsar in Table 3
and
in Table 4. In werail fit, mods1 (9) is better&an
rnodel (71, the adjustad coefficient of determination was 8%higher and the sum squares of residuals was lo0? lower. Also, d c i e n t s have the expected signs and ape significantly different from zero at least at 5% significance level or hardwood plywood and by 11% for tropical plywood.
The
Durbii-Watson statistics support the null hypothesis of no serial correlation at 5% s@ificance level. Howevef, the adjusted"
ient of determMo11 was still low: 5mdt@e variance in monthly hardwood plywodd bports can be explained by the import p r b relative to that of softwood p l y w d , md by production of furniture
and
lTxdues.
The long-term elasticities of hardwood plywood obtained from model (9) are
-
1.50 (f 0.30) with mpcctto
relative price and 1.44 (f 0.33) with respect to the number offrtraiturt
and
fixtumproduction. Meanwhile, the long-term elasticities of tropical plywood obtained
fhm that model are -1.46 (f 0.30) with respect to reldve price and 1.41 (f 0.33) with respect to the number of h i t u r e and fixtures production. The mean lag is of 3 months for both hardwood and tropical plywood imports.
CONCLUSIONS
The results suggest that there is no substitution
or
complementary betweenimported
and
domostic hardwood.In the United States, hardwood and tropical plywood have many substitutes.
Cheaper reconstituted panel products such as particleboard, fiberboard, and oriented- strand board are increasingly replacing plywood in a variety of end uses in the US (Parthama and Vmcent, 1992).
'Ihe
U.S.
demand for hardwood and tropical plywood imports appeared to be explained mostly by theprice
of imports [image:9.436.29.396.48.248.2]Substitution Between Hardwood Plywood Imports
relative to that of domestic softwood plywood and the total production of the furniture and fixtures industry.
Model (9) is the best model in terms of goodness of fit and parameter signifi- cance. However, the value of the coefficient of determination indicates that only 55% of the variance in monthly hardwood (or tropical) plywood imports can be explained by the models.
In summary, production of fiuniture and fixtures and ratio of impart price to domestic price of softwood plywood have nearly the same effect on hardwood plywood imports, as measured by their respective elasticities.
REFERENCES
Chou, J.J., and J. Buongiomo. 1982. United States Demand for Hardwood Plywood Imports: A Distributed Lag
Model. Agricultural Systems 8, pp. 225- 239.
.
1983a. United States Demand for Hardwood Plywood Imports by Country of Origin. Forest Science 29(2). pp. 225-237..
1983b. Elasticities of Demand for United States Imports and Exports for Some Forestry Commodities. Staff Paper Series Number 1 5. Department of Forestry, University of Wisconsin, Madison, Wisconsin. 7p.Dixon, P. B., Bowles, S. and Kendrick, D. 1980. Notes and Problem in Micro-
economic theory. North-Holland, Amster- dam. 32%.
Haynes, R.W. 1990. An Analysis of Timber Situation in the U.S.: 1989-2040. General Technical Report
RM-
199. United States Department of Agriculture, Forest Service.Ingram, C.D. 1993. Historical Price Trends of Nonconiferous Tropical logs and Sawnwood Imported to the United
States, Europe, and Japan. General
Technicat Report FPL-GTR-75. Madim, WI: U.S. Department of Agriculture, Forest Service, Forest Products Labora- tory.
Johnson Jr., A. C., Marvin, B. J. and Rueben, C. B. 1987. Econometrics. Basic and Applied. MacMillan Publishing Company. New York. 480p.
Lorell, M. C. 1%3. Seasonal Adjustment of Economic Time Series and Multiple
Regression Analysis, J. Amer. Statist.
Assoc., 58,993-1010
Parthama, I.B.P. and J.R. Vincent. 1992. United States Demand for Indonesian Plywood. Bulletin of Indonesian Econo- mic Studies. Vol28 No 1, April 1992.
U.S. Department of Commerce. 1994. U.S. Industrial Outlook 1994. U.S. Department of Commerce, Industry q d
Trade Administration, Washhgton, D.C.
Varian, H.R 1984. Microeconomic Analysis. Second Edition. W.W. Norton
& company. New York. 348p.