Corresponding Author: Nurbahirah Norddin, Universiti Teknikal Malaysia Melaka (UTeM), Faculty of Electrical Engineering, Malacca, Malaysia.
High Voltage Insulation Surface Condition Analysis using Time Frequency Distribution
Nurbahirah Norddin, Abdul Rahim Abdullah, Nur Qamarina Zainal Abidin and Aminudin Aman
Universiti Teknikal Malaysia Melaka (UTeM), Faculty of Electrical Engineering, Malacca, Malaysia.
Abstract: This paper presents an analysis of high voltage insulation surface condition under high contamination level using experimental test of tracking and erosion according to BS EN 60587 standard. Surface condition on glass and polymeric types of insulation is investigated. The leakage current patterns on these types of insulation are applied for surface condition classification. Due to the limitation fast Fourier transforms (FFT), a new approach of time frequency distributions (TFD) analysis is employed. Spectrogram and s-transform as time frequency distribution (TFD) are then applied to represent and analysis of the leakage current (LC) in time frequency representation (TFR) in temporal and spectral. These techniques extract relevant information from leakage current (LC) signal, and then leakage current (LC) parameters are estimated to identify its characteristics. These include root mean square current (RMS), total harmonic distortion (THD), total non harmonic distortion (TnHD) and total current waveform distortion (TWD). Leakage current’s instantaneous root mean square current per unit value and total current waveform distortion percentage are useful to reveal the insulator surface condition. Referring to rules based value, the classification of material surface state could be determined instantaneously. Instead of fast Fourier transform (FFT), it was found that time frequency distribution (TFD) is an appropriate tool for surface condition classification. Then, the unsymmetrical discharge pattern on polymeric insulation material indicated that erosion is occurred on the surface of the insulator.
Key words: Time frequency distribution; Spectrogram; S-transform; Tracking and erosion; Insulation.
INTRODUCTION
In high voltage the important materials used are conductors and insulators. While the conductor carrys current and insulation avoid the flow of current to unwanted path. The reliability of electrical power supply to the utility should be concerned to ensure the power lines and substations operated and protected. Insulation technology is still undergoing continuous development and improvement, from conventional ceramic type since the early 1900s, until the development of polymeric composite insulation materials. Polymeric or polymeric composite insulation is widely accepted (M.H. Ahmad et al. 2011) compare to conventional ceramic insulation because of its several advantages as mentioned by Hackam, Jeffry Mackevich and M.Shah in (Reuben Hackam 1999; M. A. R. M. Fernando and S.M. Gubanski 1999). However, polymeric insulation still has certain limitations such as dificulty in detecting defective insulation, lack of knowledge in its long term reliability and loss of hydrophobicity that leads to tracking and erosion as well as to flashover under contaminated condition.
Hydrophobic effect of the insulator provides high surface resistance even with the existence of contamination and moisture (R.S. Gorur et al. 2001). Different methods and analytical techniques are used to analyze the aging effect on polymeric insulating materials. One of the methods is by determining the loss of hydrophobicity. The methods to determine the loss of hydrophobicity are surface morphology by scanning electron microscope (SEM), Swedish Transmission Research Institute (STRI) classification, measuring the bead angle using a Goniometer and the equivalent salt deposit density (ESDD). Besides that, one of the key indicators widely accepted to determine performance of polymeric insulation either in service or accelerated aging laboratory test is by investigating the leakage curent (LC) signal. LC signal provides information of polymeric insulation surface condition and the pollution severity (N. Bashir and H. Ahmad 2009). LC measurement is popular technique because it can be monitored the performance of insulation either online or offline (D. Pylarinos et al. 2012; T. Zuo et al. 2012). Measurement of the peak current, accumulated charge (R.J. Chang and L. Mazeika 2000a) and discharge duration has been used by some researchers to provide information on degradation.
determining the surface condition. Most of them use fast Fourier transform (FFT) to analyze the leakage current signal (N. Bashir and H. Ahmad 2010; M.A.R.M. Fernando and S.M. Gubanski 1999a).
However, FFT does not provide temporal information and is not appropriate for non stationary signal (O. Rioul and M. Vetterli 1991). Instead, the analysis using time frequency distribution (TFD) such as spectrogram and s-transform is used. The linear time frequency distribution approaches resolve the limitation of FFT. In this recent work, TFD is employed to analyze LC components to identify surface condition of polymer and non-polymer materials. According to Al-Ammar and Karady (2005), spectrogram is appropriate to analyze signal in high or low frequency depending on its frequency resolution based on window selection but it does not track the signal dynamics properly. Moreover, s-transform offers higher accuracy than spectrogram in term of its time and frequency resolution (Z. Leonowicz, T. Lobos and K. Wozniak 2009).
Surface hydrophobicity performance and its surface condition severity could be determined by a LC behavior. El-Hag et al. (2008) and Fernando and Gubanski (1999b) in their work had been separated the surface events into a several stages. The stages are early aging period (EAP), transition period (TP) and late aging period (LAP). These stages determine the level of surface condition as well as its contamination levels. At early aging period (EAP) only capacitive leakage current signify the insulator in hydrophobic condition. Then, during transition period (TP) the surface of insulator becomes hydrophilic and leakage current significantly changes to resistive condition. Finally, during late aging period (LAP) the leakage current level become higher and become completely resistive. At this moment, the surface erosion took place as well as produce unsymmetrical leakage current wave shape.
In this recent work, glass is selected as non-polymeric and Polypropylene (PP) as the polymeric insulation material. Tracking and erosion test complying with BS EN 60587-2007 are conducted on these materials and data acquisition Lab View program is employed for LC storage. Then LC parameters such as current root mean square (Irms), instantaneous total harmonic distortion (ITHD), instantaneous total non-harmonic distortion (ITnHD), and instantaneous total waveform distortion (ITWD) are determined instantaneously by using (TFD) spectrogram and s-transform respectively. By these parameters the classification of surface events is made. In real time leakage current signal consist of non-stationary signal, it can be concluded that TFD is appropriate tools for surface condition monitoring. It also observed that no unsymmetrical discharge pattern (LAP) on glass and its indicated that no erosion is occurred on the surface of the insulator compared with polypropylene.
MATERIAL AND METHODS
1) Experimental Setup:
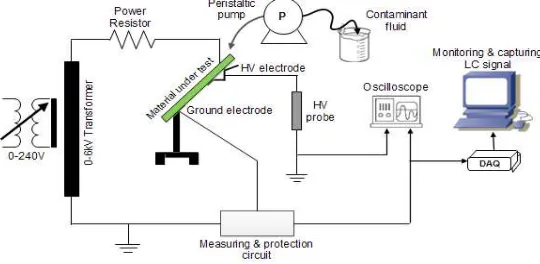
Inclined-Plane Test (IPT) is normally used to evaluate the tracking and erosion resistance of insulating materials and recommended by BS EN 60587 (B.standard 2007). It is a valuable tool for the comparison and evaluation of new and different materials under electrical stress, and to compare the suitability of materials for the dielectric surface of an insulator. Two materials are being evaluated which are non-polymeric (glass) and polymeric (polypropylene) having the dimensions of 50 mm wide by 120 mm long and 6 mm thick and inclined at 45° angle as shown in the schematic Fig. 1 which is the experimental setup for IPT test that are subjected to high voltage of 3.5 kV.
In the test procedure, since it is done in the same place every day, there are three parameters that are assumed constant; humidity, pressure, and temperature. As stated in the standard, the contaminant conductivity level is set to 2.533 S/m measured by Hanna Dist 4 conductivity meter and its flow rate at 0.6 ml/min. A non-ionic wetting agent (Triton X100) is added as prescribed in the standard test to provide uniform liquid for contamination (R.J. Chang and L. Mazeika 2000b). LABVIEW program is developed for LC data monitoring and storage for analysis purpose.
2) Time Frequency Distribution:
Linear time frequency distributions (TFD) provide the information about time variation as well as frequency spectrum of leakage current simultaneously which using spectrogram and s-transform. From the TFR, characteristics of the signals can be calculated and used as input for signals classification. The signal characteristics are total harmonic distortion, total non harmonic distortion, total waveform distortion and current root mean square (IRMS).
A. Spectrogram:
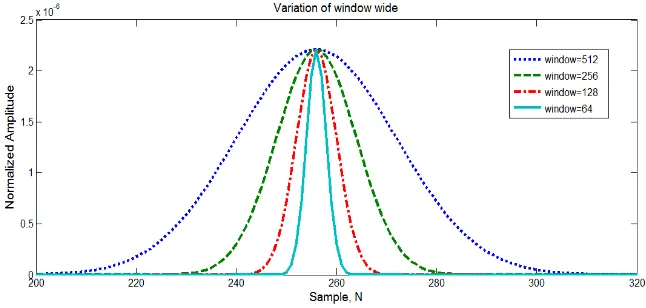
Spectrogram is one of the time-frequency representations (TFR) that represents a three-dimensional of the signal energy with respect to time and frequency. Spectrogram is the squared magnitude of the STFT. This technique roughly reflects how frequency content changes over time. However it has the limitation of a fixed window width that results is a compromise between time and frequency resolution The window effect caused smaller window size produces better time resolution but it also reduces frequency resolution and vice versa. The spectrogram defined as
Where h( ) is the input signal and w(t) is the window observation window. In this study, Hanning window is selected because of its lower peak side lope (H.I.S. Jayasundara, W.P.S. Sudarshani and M.A.R.M. Fernando 2008) which is narrow effect on other frequencies around fundamental value (50 Hz in this study) and other frequency components.
B. S-transform:
S-transform is proposed by Stockwell et al. (1996) which time frequency spectral localization method that combine element of Wavelet transform and short time Fourier transform (STFT). S-transform employs a moving and scalable localizing Gaussian window and the equation of Gaussian window shown in (3). It combines a frequency dependent resolution with simultaneous localizing the real and imaginary spectra. The basis functions for the s-transform are Gaussian modulated cosinusoids whose width varies inversely with the frequency. S-transform, introduced by Stockwell et al. (1996) is defined by the general equation (2)
2 2 Where h(t) is the signal, t represent the time, f the frequency, g(t) the scalable Gaussian window and is a parameter which control the position of the Gaussian window on the x-axis. When the window is wider in time domain, s-transform provides better frequency resolution for lower frequency. While the window in narrower, it provide better time resolution for higher frequency.
3) Parameter Estimation:
Parameters of the signal are estimated from the time frequency distribution to recognize the signal information in time. These parameters are important to use as an effective indicator for insulator surface condition.
A. Instantaneous RMS Current:
The instantaneous RMS current is
maxB. Instantaneous RMS Fundamental Current (I1rms):
Instantaneous RMS fundamental current I1rms(t) is defined as the RMS current at power system frequency (A. Kusko and M.T. Thompson 2007) and can be calculated as
1 1
Where f1 is the fundamental frequency that corresponds to the power system frequency and Δf is the bandwidth which is set to 50Hz.
C. Total Harmonic Distortion (THD):
THD is the relative signal energy present at non-fundamental frequencies and written as:
2 Where Ih,RMS(t) is RMS harmonic current and H is the highest measured harmonic component.
D. Total non Harmonic Distortion (TnHD):
Nonharmonics are not multiple integer signal components frequency of the power system frequency. Therefore, TnHD is referred as distinguishing between nonharmonic and noise, and is calculated as:
2 2
E. Total Waveform Distortion (TWD):
TWD consists of harmonic distortion and nonharmonic distortion. It can define as:
2 2
Polypropylene and glass are used as insulating material was tested under IPT condition at 2.5mS/cm conductivity level and 0.3 ml/min, while increasing the voltage stresses from 0 to 3.5kV. There are three patterns can be seen for glass and four pattern for polypropylene. These conditions were monitored and collected using LABVIEW software package.
A. Material Analysis: 1. Glass:
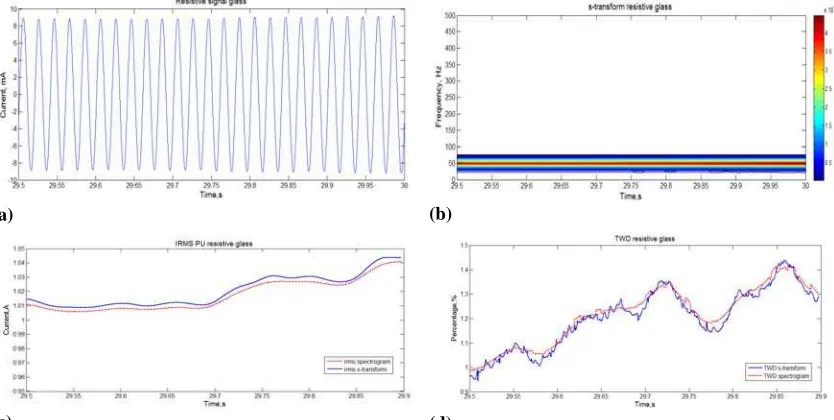
3b shows the spectrogram for capacitive glass with 400Hz of harmonic exists. Fig. 3c shows the small values of RMS current per unit (pu) for capacitive signal. Total waveform distortion (TWD) during this state around 30 to 20%.
(a) (b)
(c) (d)
Fig. 3: (a) Glass capacitive signal (b) Spectrogram (c) IRMS (d) TWD.
At this resistive state for glass, only fundamental frequency 50Hz exist and the amplitude is about 10mA. This condition appeared at voltage stresses 1kV until 1.5kV. The average instantaneous RMS current is approximately 1.0pu and it has a smallest TWD value that is below 3% because of low distortion on the signal. The symmetrical discharge for glass take place on 2kV which arcing sound produced but there is no spark on the glass surface and the signal has low distortion state. At 2.5 kV, sparks occurred on the glass surface form discharge activities. The amplitude for symmetrical signal for glass is about 70mA. The RMS current for this state is a lot higher than 1.0 pu and the TWD is below 100%. During this state, smokes appear and contamination fluid spread wildly with discharges scattered on the insulator surface. The pattern for symmetrical discharge for glass is same with polypropylene symmetrical pattern shown in fig.5a.
(a) (b)
(c) (d)
2. Polypropylene:
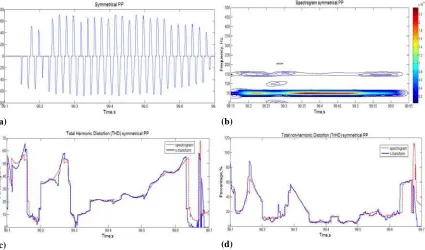
Polypropylene (PP) has good balance between electrical and mechanical properties (A. Aman et al. 2013). It also has high dielectric strength (S. Naidu and N.M. S 1999). It is observed that at low voltages levels between 0-1 kV, no erosion and arcing activities occurred. At this level of voltage, the LC is classified to capacitive type at wet condition. The amplitude for capacitive types for polypropylene is around 0.15mA. The RMS current pu for this state is around 6.6mA and the percentage of TWD around 30% to 20%. At 1kV until 1.5kV resistive state with fundamental frequency of 50Hz exist. The amplitude of LC during resistive is about 15mA. At 1.5kV, smokes appear during the test. The RMS current for this pattern is 1.0 pu and has low TWD value that is below 3%. At 1.8kV, waveform of the symmetrical signal with distortion exists depict in fig.5a and the sounds of arcing without spark are produced. The RMS current pu for this state is higher than 1.0 pu. THD and TnHD value lower than 100% shown in fig 6c and fig 6d respectively.
(a) (b)
(c) (d)
Fig. 5: (a) Polypropylene symmetrical signal (b) Spectrogram (c) THD (d) TnHD.
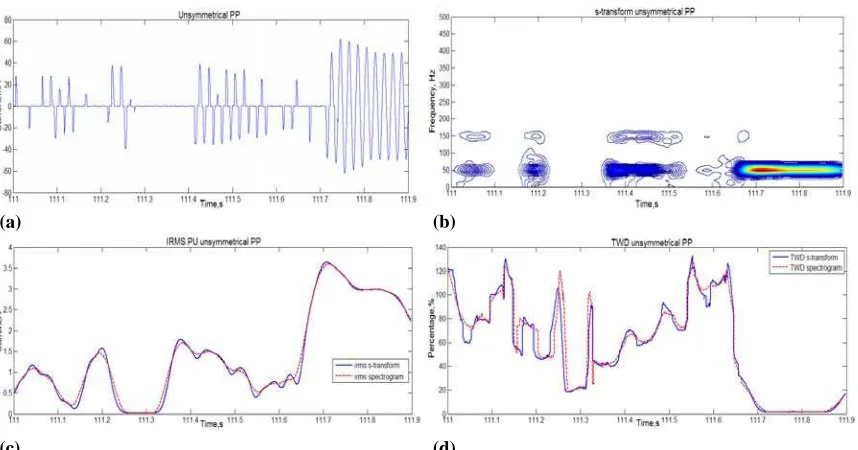
(a) (b)
(c) (d)
Fig. 6: (a) Polypropylene unsymmetrical signal (b) S-transform (c) IRMS PU, (d) TWD.
B. Surface Condition Classification:
In order to find out the relation between RMS current pu and total waveform distortion (TWD) to the surface condition of the insulator signal classification have been conducted. Analysis results are made based on leakage current parameter estimation obtained from spectrogram and s-transform. The rules based are used to classify the surface condition event instanteously are summaries in Table 1.
Table 1: Ruled based on surface condition classification.
Pattern Parameter Glass Polypropylene Condition
Capacitive IRMS <1.0 pu <1.0 pu No arching
TWD 50 – 3% 50 – 3%
Resistive IRMS 1.0 pu 1.0 pu Arching sound
TWD <3% <3%
Symmetrical IRMS >1.0 pu >1.0 pu Low arching for
polypropylene and high arching for glass
TWD Percentage varies around
5 - 100%
Percentage varies around 5 - 100%
Unsymmetrical IRMS / varies Dry band with high
arcing which lead to erosion 1.0 ≤x≥1.0
TWD / Percentage varies around 100 % –
200%
Conclusion:
This study using new approach to presents the comparison and analysis of non polymeric and polymeric insulation leakage current patterns using parameter estimation to identify the surface condition of the insulator. In conclusion, it was found that late aging period state with unsymmetrical discharge pattern on polymeric insulation material can be use as erosion indicator occurred on the surface of the insulator. Erosion does not occur on glass surface at 3.5kV because of their endurance to high temperature and they have high molecular weight compared to polypropylene. Instead of using LC amplitude, ruled based obtained from spectrogram and transform can be use to determine the surface condition of the insulator instantaneously. In term accuracy s-transform offers better performance than spectrogram because shows better time and frequency resolution.
ACKNOWLEDGMENT
The authors gratefully acknowledge the Faculty of Electrical Engineering, Universiti Teknikal Malaysia Melaka for giving the support in this study.
REFERENCES
Al-Ammar, E. and G.G. Karady, 2005. 'Transfer function analysis using STFT for improvement of the fault detection sensitivity in transformer impulse test', in Power Engineering Society General Meeting, 2005. IEEE, 2: 1855-1862.
Aman, A., M.M. Yaacob, M.A. Alsaedi and K.A. Ibrahim, 2013. 'Polymeric composite based on waste material for high voltage outdoor application', International Journal of Electrical Power & Energy Systems, 45(1): 346-352.
Aman, A., M.M. Yaacob and J.A. Razak, 2011. 'Dielectric strength of Waste Tyre Dust-Polypropylene (WTD-PP) for high voltage application', Australian Journal of Basic and Applied Sciences, 5(9): 1578-1583.
B.standard, 2007. Electrical insulating materials used under severe ambient conditions -Test methods for evaluating resistance to tracking and erosion in BS EN 60587:2007, Bsi.
Bashir, N. and H. Ahmad, 2009. 'Insulator leakage current studies in artificial climatic chambers using dimensional analysis', International Review of Electrical Engineering, 4(6): 1433-1439.
Bashir, N. and H. Ahmad, 2010. 'Odd harmonics and third to fifth harmonic ratios of leakage currents as diagnostic tools to study the ageing of glass insulators', IEEE Transactions on Dielectrics and Electrical Insulation, 17(3): 819-832.
Bruce, G.P., S.M. Rowland and A. Krivda, 2010. 'Performance of silicone rubber in DC inclined plane tracking tests', IEEE Transactions on Dielectrics and Electrical Insulation, 17(2): 521-532.
Chandrasekar, S., C. Kalaivanan, A. Cavallini and G. Montanari, 2009. 'Investigations on leakage current and phase angle characteristics of porcelain and polymeric insulator under contaminated conditions', IEEE Transactions on Dielectrics and Electrical Insulation, 16(2): 574-583.
Chang, R.J. and L. Mazeika, 2000a. 'Analysis of electrical activity associated with inclined-plane tracking and erosion of insulating materials', Dielectrics and Electrical Insulation, IEEE Transactions on, 7(3): 394-400.
Chang, R.J. and L. Mazeika, 2000b. 'Analysis of electrical activity associated with inclined-plane tracking and erosion of insulating materials', IEEE Transactions on Dielectrics and Electrical Insulation, 7(3): 394-400.
El-Hag, A.H., 2005. 'A new technique to detect dry-band arcing', IEEE Transactions on Power Delivery, 20(2): 1202-1203.
El-Hag, A.H., A.N. Jahromi and M. Sanaye-Pasand, 2008. 'Prediction of leakage current of non-ceramic insulators in early aging period', Electric Power Systems Research, 78(10): 1686-1692.
Fernando, M.A.R.M. and S.M. Gubanski, 1999a. 'Leakage current patterns on contaminated polymeric surfaces', IEEE Transactions on Dielectrics and Electrical Insulation, 6(5): 688-694.
Fernando, M.A.R.M. and S.M. Gubanski, 1999b. 'Leakage currents on non-ceramic insulators and materials', IEEE Transactions on Dielectrics and Electrical Insulation, 6(5): 660-667.
Fernando, M.A.R.M. and S.M. Gubanski, 2010. 'Ageing of silicone rubber insulators in coastal and inland tropical environment', IEEE Transactions on Dielectrics and Electrical Insulation, 17(2): 326-333.
Gorur, R.S., H.M. Schneider, J. Cartwright, Y. Beausajour, K. Kondo, S. Gubanski, R. Hartings, M. Shah, J. McBride, C. De Tourreil and Z. Szilagyi, 2001. 'Surface resistance measurements on nonceramic insulators', Power Delivery, IEEE Transactions on, 16(4): 801-805.
Hackam, R., 1999. 'Outdoor HV Composite Polymeric Insulators', IEEE Transactions on Dielectrics and Electrical Insulation, 6: 557-585.
Hackam, R., 1999. 'Outdoor HV composite polymeric insulators', IEEE Transactions on Dielectrics and Electrical Insulation, 6(5): 557-585.
Jayasundara, H.I.S., W.P.S. Sudarshani and M.A.R.M. Fernando, 2008. 'Leakage Current Patterns on High Voltage Insulators: Analysis on Frequency and Time-frequency Domains', in Industrial and Information Systems, 2008. ICIIS 2008. IEEE Region 10 and the Third international Conference on, pp. 1-6.
Jeong-Ho, K., S. Woo-Chang, L. Jae-Hyung, P. Yong-Kwan, C. Han-Goo, Y. Yeong-Sik and Y. Kea-Joon, 2001. 'Leakage current monitoring and outdoor degradation of silicone rubber', IEEE Transactions on Dielectrics and Electrical Insulation, 8(6): 1108-1115.
Kordkheili, H.H., H. Abravesh, M. Tabasi, M. Dakhem and M.M. Abravesh, 2010. 'Determining the probability of flashover occurrence in composite insulators by using leakage current harmonic components', IEEE Transactions on Dielectrics and Electrical Insulation, 17(2): 502-512.
Kumagai, S., B. Marungsri, H. Shinokubo, R. Matsuoka and N. Yoshimura, 2006. 'Comparison of leakage current and aging of silicone rubbers and porcelain in both field and salt-fog tests', IEEE Transactions on Dielectrics and Electrical Insulation, 13(6): 1286-1302.
Kusko, A. and M.T. Thompson, 2007. Power Quality in Electrical Systems, McGraw Hill.
Leonowicz, Z., T. Lobos and K. Wozniak, 2009. 'Analysis of non-stationary electric signals using the S-transform', COMPEL: The International Journal for Computation and Mathematics in Electrical and Electronic Engineering, 28(1): 204-210.
Ahmad, M.H., H. Ahmad, N. Bashir, Y.Z. Arief, Kurnianto, R. and F. Yusof, 2011. 'New Statistical Ranking of Tree Inception Voltage Distribution of Silicone Rubber and Epoxy Resin under AC Voltage Excitation', International Review of Electrical Engineering, 6(4): 1768-1774.
Naidu, S. and S, N.M., 1999. High Voltage Engineering, McGraw-Hill.
Piah, M.A.M., A. Darus and A. Hassan, 2003. 'Leakage current and surface discharge phenomena: effect on tracking and morphological properties of LLDPE-natural rubber compounds', in Properties and Applications of Dielectric Materials, 2003. Proceedings of the 7th International Conference on, 1: 347-350.
Pylarinos, D., K. Siderakis, E. Thalassinakis, E. Pyrgioti, I. Vitellas and S.L. David, 2012. 'Online applicable techniques to evaluate field leakage current waveforms', Electric Power Systems Research, 84(1): 65-71.
Rioul, O. and M. Vetterli, 1991. 'Wavelets and signal processing', Signal Processing Magazine, IEEE, 8(4): 14-38.
Stockwell, R.G., L. Mansinha and R.P. Lowe, 1996. 'Localization of the complex spectrum: the S transform', IEEE Transactions on Signal Processing, 44(4): 998-1001.
Vas, J.V., B. Venkatesulu and M.J. Thomas, 2012. 'Tracking and erosion of silicone rubber nanocomposites under DC voltages of both polarities', IEEE Transactions on Dielectrics and Electrical Insulation, 19(1): 91-98.