DEVELOPMENT OF ENERGY AUDIT SOFTWARE FOR LIGHTING SYSTEMS
AHMAD FARID BIN SAPAR
“I hereby declare that I have read through this report entitle “Development of Energy Audit Software for Lighting Systems” and found that it has comply the partial fulfilment for
awarding the degree of Bachelor of Electrical Engineering (Industrial Power)”.
Signature : ………...
DEVELOPMENT OF ENERGY AUDIT SOFTWARE FOR LIGHTING SYSTEMS
AHMAD FARID BIN SAPAR
This report is submitted in partial fulfillment of requirements for the degree of Bachelor of Electrical Engineering (Industrial Power)
Faculty of Electrical Engineering
UNIVERSITI TEKNIKAL MALAYSIA MELAKA
I declare that this report entitle “Development of Energy Audit Software for Lighting Systems” is the result of my own research except as cited in the references. The report has
not been accepted for any degree and is not concurrently submitted in candidature of any degree.
Signature :………
ACKNOWLEDGEMENT
Assalammualaikum Warahmatullahi Wabarakatuh ;
First of all, praise be to Allah S.W.T because of his willingness. Alhamdulillah I had successfully finished my Final Year Project entitled “Development of Energy Audit Software for Lighting Systems”. I was very fortunate to have a number of wonderful experience people who had a given me assistance and direction toward completing this project.
First and foremost, I would like to express my deepest gratitude to my project supervisor Dr. Gan Chin Kim for his advice and the logical opinion, motivation, guidance critics, stimulating suggestions and encouragement helped throughout this research. He has been kind enough to spend his time to check and give his positive feedback to my project and also always willing to be seen upon needed. Without him, I cannot finish my project and my final report on my own. I am also thankful to my panels Mr. Mohd Shahril Bin Ahmad Khiar and Mr. Norhafiz Bin Salim for their guidance, advices and also give positives criticism to my project. Without their support and interests, this project would not have been as good as presented in this thesis.
Finally, I would like to dedicate my gratitude to my parents, staff of Federal Tower of Melaka especially facility manager of the building Mr. Haji Zainol Bin Haji Leman, lecturers of Electrical Engineering Faculty, Universiti Teknikal Malaysia Melaka, and my classmates from 4 BEKP and those who has helped me directly or indirectly in the completion of this project. Their encouragement and guidance mean a lot to me. Their sharing and experience foster my belief in overcoming every obstacle encountered in this project.
ABSTRACT
ABSTRAK
TABLE OF CONTENTS
ACKNOWLEDGEMENT i
ABSTRACT ii
TABLE OF CONTENTS iv
LIST OF TABLES vii
LIST OF FIGURES viii
LIST OF ABBREVIATIONS ix
LIST OF APPENDECIES x
1 INTRODUCTION 1
1.1 Project Background 1
1.2 Project Statement 2
1.3 Project Objective 3
1.4 Project Scopes 4
1.5 Thesis Outline 5
2 LITERATURE REVIEW 6
2.1 Global Warming 6
2.2 Energy Consumption 7
2.3 Impact of Lighting Energy Consumption on the Environment 8
2.4 Lighting Energy in Building 8
2.5 Energy Audit 9
2.5.1 Type of Energy Audit 10
2.6 Energy Audit Tools 12
2.7 Concept and Term in Lighting 13
2.7.1 Lumens 14
2.7.2 Candela 14
2.7.3 Efficacy 14
2.7.4 Lux 15
2.7.5 Color Temperature 15
2.7.6 Color Rendering Index 16
2.7.7 Basic Parameters used in Lighting 17
2.7.7.1 Luminous Flux (Φ) 17
2.7.7.2 Luminous Intensity, (I) 17
2.7.7.3 Illuminance,(E) 18
2.7.7.4 Luminance, (L) 18
3 METHODOLOGY 19
3.1 Worksheet Preparation 22
3.2 Data Collection 22
3.2.1 Lumen Method Calculation 22
3.2.2 Utilisation Factor (UF) 23
3.2.3 Maintenance Factor (MF) 25
3.2.4 Installed Load Efficacy (ILER) 26
3.3 Energy Saving Computation 29
3.4 Programming Software Required for Development 30
3.4.1 Microsoft Visual Basic 6.0 30
3.4.2 Graphical User Interface (GUI) 30
4 PRELIMINARY AUDIT 32
4.1 Overall Energy Consumption 32
4.2 Federal Building Audit 34
4.3 Existing Lighting System Analysis 37
4.4 Lux Graphical Analysis 40
4.4.1 Office Workplace Area Lux 42
4.4.2 Utility Room Area Lux 43
4.4.3 Circulation Area Lux 44
5 IMPROVEMENT STRATEGIES 45
5.1 Strategy to Reduce Energy Consumption 45
5.1.1 Sensor 46
5.1.2 T5 Retrofit Saver Tube 46
5.1.3 T5 Retrosaver Tube with Sensor 47
5.1.4 LED T8 Tube 48
5.1.5 LED T8 Tube with Sensor 48
5.2 Graphical Analysis of Energy Consumption and Bill Payment 49 5.2.1 Graphical Analysis of Energy Consumption in kWh/month 49
5.2.2 Electricity Bill Payment in RM 51
5.3 Economic Engineering Analysis 53
5.3.1 Sensor 53
5.3.2 T5 Retrofit Saver Tube 54
5.3.3 T5 Tube with Sensor 56
5.3.4 LED T8 Tube 57
5.3.5 LED T8 Tube with Sensor 58
5.3.6 Result of the Economic Engineering Analysis 58
5.4 Software Development 59
5.4.1 Energy Consumption Calculator Interface 60
5.4.1.1 Manual Calculation Method 61
5.4.1.2 Energy Calculator Software Calculation 62
5.4.2 Recommendation Lighting Interface 63
5.4.2.1 Manual Calculation of Recommendation Lighting 63 5.4.2.2 Recommendation Lighting Software Calculation 71
5.4.3 Lux Standardize Interface 73
5.4.4 Fitting Design Interface 74
5.4.4.1 Manual Calculation of Fitting Design. 74 5.4.4.2 Fitting Design Software Calculation 75
6 CONCLUSION AND RECOMMENDATION 77
6.1 Conclusion 77
6.2 Recommendation 78
REFERENCES 79
APPENDICES 81
LIST OF TABLES
2.1 Luminous flux emitted by common light sources 14
2.2 Typical efficacy of lamps 15
2.3 Color temperature and warmness of common types 16
2.4 Typical values of color rendering index 16
3.1 Reflection factor 25
3.2 Indicator performance 26
3.3 Lumen method parameters 27
3.4 Room parameters 28
3.5 Light parameter 29
4.1 Total energy consumption and electricity bill payment for all equipment 33
4.2 Building division 35
4.3 Total fitting and total lamp of existing lighting systems 36 4.4 Total lamp and hour usage at office workplace 37 4.5 Total lamp and hour usage at utility room 37 4.7 Total power, energy consumption and bill payment each area 38 4.6 Total lamp and hour usage at circulation area 38 5.1 Total power, energy consumption and bill payment (T8 with sensor) 46 5.2 Total power, energy consumption and bill payment (T5 Retrofit ) 47 5.3 Total power, energy consumption and bill payment (T5 with sensor) 47 5.4 Total power, energy consumption and bill payment (LED T8) 48 5.5 Total power, energy consumption and bill payment (LED T8 with sensor) 49
5.6 Sensor cost data 53
5.7 Annual profit by using sensor 54
5.8 T5 retrofit saver cost data 55
5.9 Annual profit of T5 retrofit saver 55
5.10 Annual profit of T5 retrofit saver with sensor 56
5.11 T5 retrofit saver with sensor cost data 56
5.12 LED T8 cost data 57
5.13 Annual Profit of LED T8 57
5.14 Annual profit of LED T8 with sensor 58
5.15 LED T8 with sensor cost data 58
5.16 Payback period by using 5 methods 59
5.17 Example of lighting data 60
LIST OF FIGURES
2.1 Lighting energy consumption flow 7
2.2 The electromagnetic spectrum 13
2.3 Luminous flux concept 17
2.4 Luminous intensity concept 17
2.5 Illuminance concept 18
2.6 Luminance concept 18
3.1 Flow chart of project methodology 20
3.2 Spacing of luminaries in lumen design method 23
3.3 Working plane dimension 24
4.1 Graphical analysis of energy consumption and bill payment per-month 33
4.2 Building division on side view 35
4.3 Total energy consumption in kWh on each area 39 4.4 Total electricity bill payment on each area 40 4.5 Illustration existing lighting usage on each area 41 4.6 Result of illuminance lux after walk-through audit 41 4.7 Illuminance level standard on each area 42 4.8 Illuminance lux level standard at office workplace 43 4.9 Illuminance lux level standard at utility room 44 4.10 Illuminance lux level standard at circulation area 44 5.1 Total energy consumption in kWh on each area 50 5.2 Total energy consumption in kWh by each method 50 5.3 Percentage of reduction compare with existing lighting systems 51 5.4 Total electricity bill payment per-month by each method 52
5.5 GREEN Calculux interface 60
5.6 Inserting the lighting equipment 62
5.7 Result of Energy Calculator 63
5.8 Market Price interface 72
5.9 Result of Recommendation Lighting 72
5.10 Selecting on Office Workplace illuminance 73
5.11 Selecting on Utility Room illuminance 73
5.12 Selecting on Circulation Area illuminance 73
5.13 Room Data interface 75
5.14 Result of Fitting Design 76
LIST OF ABBREVIATIONS
RM - Ringgit Malaysia
GUI - Graphic User Interface
W - Watt
kW - Kilowatt
kWh - Kilowatt Hours
TNB - Tenaga Nasional Berhad
IL - Illuminance bare
cd - Candela
lm - Lumen
CRI - Color Rendering Index
I - Luminous Intensity
E - Illuminance
L - Luminance
K - Room Index
UF - Utilisation Factor
MF - Maintenance Factor
ILER - Installed Load Efficacy
n - Number of lamp each fitting
L - Length
W - Width
LIST OF APPENDICES
APPENDIX TITLE PAGE
A Gantt chart for final project 81
B Department that occupy at Federal Tower of Melaka 82
C Recommended average illuminance level based on Malaysian Standard 83
D Electricity bill tariff by TNB 84
E Utilisation factor (T8 Type – 36Watt) 85
F The lighting power data 86
G Analysis using five methods 87
H Payback period using five methods 106
1 CHAPTER 1
INTRODUCTION
This chapter will discuss the project background, problem statement, project objectives, project scopes, and thesis outlines.
1.1 Project Background
Recently, the issue of energy conservation is widely reported in journal and thesis. There is a growing concern over energy consumption and its adverse impact on the environment. There are many types of energy such as heat energy, kinetic energy, potential energy, mechanical energy and electrical energy. Electrical energy is one of the energy that has significant role in the world nowadays. Inefficient use of energy today will give a bad impact to the next generation. Global warming is one example effect of the inefficient use of energy. Nowadays global warming phenomenon is a serious issue, this phenomenon happen because of increasing of carbon dioxides (CO2) in our ozone surface. The increasing of CO2 is an effect of fossil fuels burning to fulfill energy demand. Increasing of energy demand will make our earth more suffer. Next, in the short term, the most significant impact that we can see is the increase in electrical energy consumption in kilowatt hour (kWh) and electricity bill payment in Ringgit Malaysia (RM). To overcome this situation, it should be consumed efficiently. For this reason, the energy audit is a useful method to preliminary estimate the savings potential of energy and money.
in the building and to find out the saving potential. The major task in this project is to conduct a basic energy audit, which include lighting audit in Federal Tower of Melaka. This project was proposed and agreed by facility manager of Federal Tower of Melaka and Appendix A shows the permission letter to do the auditing at the building.
Observations in Federal Tower of Melaka had been done to find out what is the major problem with the existing lighting system. Here are the results; first problem is the brightness of the office workplace exceed the standard illumination. This is because some of the workplaces mostly have windows and sunlight directly through the workplace. Secondly, the Federal Tower have 21 levels of offices workplaces, thus three levels will be measured as references. Level 1 until level 5 have the same square per meter, so, level 4 will be used as reference. At Level 6 until Level 12, Level 11 will be used as reference, seems the square per meter remains the same. In Level 13 until Level 21, Level 20 will be used as reference. Thirdly, the light was switched on even there is no occupant in the office workplace. The energy wastages have contributed to the yearly increasing of electricity consumption in Federal Tower of Melaka. Therefore, this project aims to study and analyze the existing lighting system in Federal Tower of Melaka, and finally to propose 5 method to reduce electricity energy consumption.
1.2 Project Statement
application of advance glazing, compact fluorescent lamps (CFL), insulation, housekeeping, and by raising thermostat set point temperature of air conditioners [3].
Energy audits are considered as one of the comprehensive methods in checking the energy usage and wastage in buildings. The term energy audit is commonly used to describe a wide variety of energy-related functions. Definitions range from a very simple and inexpensive process to one of high complexity, involving a detailed data analysis of simulated energy use, along with microeconomic numbers.
Thus, this software was developed will help facility manager to do the audit process. However, it will perform the audit to the lighting system only which is the largest element in daily electricity usage.
1.3 Project Objective
There are three (3) main objectives that need to be accomplished in order to make this project successful which are:
To evaluate the electricity energy consumption pattern at Federal Tower Melaka.
To develop user friendly Energy Auditing Software that;
Can do the auditing on the lighting system at Federal Tower Melaka Based on Malaysian Standard.
Can calculate the cost of energy consumption, energy savings in kWh, total cost savings in RM for each day of the lighting system based on the estimated time of use tariff and electricity.
Can select effective lighting equipment in the electrical energy consumption based on the brightness of the need for a space.
These projects involve the lighting audit and propose the five strategies to improve energy efficiency at Federal Tower of Melaka. The building has 21 levels in total. Three separate levels with different square per meter are taken as references which are level 4, level 11 and level 20.
The development of energy audit software is built using Visual Basic and it based on the energy efficiency guidelines MS 1525:2007[1]. The data collection that based on worksheet parameter is need before the lighting audit is analyzed. It includes the characteristic of activity in the room, the dimension of the room, light level reading in lux, number of lamp per luminaries, lamp fixture and the lamp wattage. The cost of electricity of a lighting system can be calculated from the data collection. This cost calculation is based on the estimated duration of use of such equipment and charges set by the energy provider. This software also can perform calculations with the most effective brightness of a space based on several factors.
Chapter 1 briefly summarizes the project background and problem statements as well as elaborates the objectives, scope of the project and thesis outlines.
Chapter 2, describes the for literature review. The contents include about the global warming, Malaysia energy consumption, impact of energy consumption on the environment, lighting energy building, definition of energy audits, the types of energy audit and also energy audit tools from past review.
Chapter 3 is the research methodology of the project. It discussed in detailed the project development to complete the project. All steps from the beginning until the end of this project done.
The Chapter 4 present the preliminary audit. The preliminary audit described the pattern of existing lighting systems in Federal Tower of Melaka in term of usage of energy consumption (kWh), electricity bill payment monthly and yearly and standardize of average luminance lux level standard.
Chapter 5 describes the purpose of five strategies to reduce the existing lighting systems in Federal tower of Melaka. This chapter will conclude that the most profitable method to reduce in terms of reduction of energy consumption and bill payment. The payback period on each method will be discussed on this chapter.
2 CHAPTER 2
LITERATURE REVIEW
This chapter discuss about the brainstorming related with the project. The sources are from past journals and book related with energy auditing for lighting systems.
2.1 Global Warming
Global warming gives a very bad effect to our life. It happens because of carbon dioxide (CO2) emission due the use of fossil fuels as primary energy in meeting the increasing the electricity load. By burning of fossil fuel, it will emit several harmful gas and the major one is CO2. According to World Meteorological Organization (WMO), the global average surface temperature has risen by 0.74°C since the beginning of the 20th century, and the temperature has risen by 0.18°C over the last 25 years [4]. That means, our earth become warmer year by year.
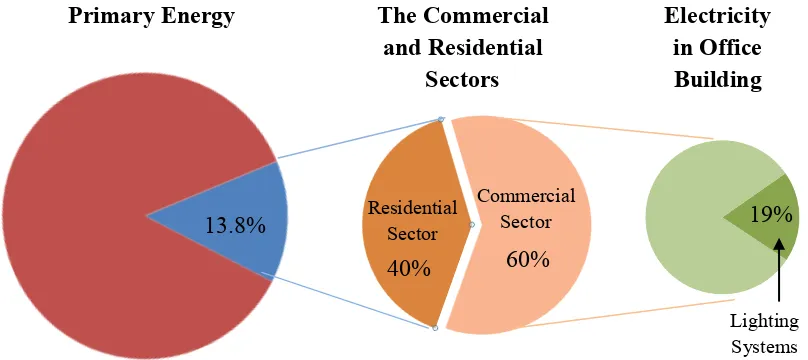
Energy consumption has been increasing quite sharply in Malaysia. The growth of energy consumption was around 5-6% per annum from year 2005 until 2008. The energy use in the industrial sector was driven increasing, which grew at 7% per year. The commercial and residential sector accounted for 13.8% of the total final energy use in Malaysia in 2008. The sector’s final energy use was ranked at third position after the industry and transport sectors. In term of electricity, the sector consumed 53.6% of electricity supplied during the period, of which 60% was consumed by the commercial sector and balance 40% by the residential sector [2].Thus, building energy use accounted a lot of numbers of the final energy use by the commercial and residential sector. A measured of a building’s energy performance is estimated for Malaysia and compared with a number of selected countries. Air conditioners are shown to be a major energy user (57%) in office buildings, followed by lighting (19%), lifts and pumps (18%) and other equipment (6%) [3]. Figure 2.1 illustrate the lighting energy consumption flow in Malaysia.
[image:22.595.103.507.546.726.2]In Malaysia, commercial buildings were designed and constructed and regulated by the Uniform Building By-Law (UBBL). The By-law does not cover the buildings energy-use performance. However, the government is promoting commercial buildings to adopt energy efficiency through voluntary approach by providing a standard called MS1525:2007- Code of Practice on Energy Efficiency and Use of Renewable Energy for Non-Residential Building [1].
Figure 2.1: Lighting energy consumption flow 19%
Primary Energy The Commercial and Residential Sectors Electricity in Office Building 13.8%
40% 60%
Lighting Systems Commercial Sector Residential Sector 13.8%
40% 60%
2.3 Impact of Lighting Energy Consumption on the Environment
The environment impacts of lighting are caused by the energy consumption of lighting, the material used to produce lighting equipment, and the disposal of used equipment. Emissions during the production of electricity and also as a result of the burning of fuel in vehicle lighting and in fuel-based lighting are responsible for most of the lighting-related greenhouse gas emissions. Hazardous based lighting are responsible for most of the lighting-related greenhouse gas emission. Hazardous materials such as lead, mercury are used in the lamps and ballasts, if not disposed properly, can cause harmful impacts on the environment. Lighting also affects the environment due to wastefully escaped light into the night sky (light pollution) [5].
The environment impacts of electric lighting depend on the electricity generation method. Thermal power generation system has the highest impact on the environment due to combustion fuel, gas emission, solid waste production, water consumption, and thermal pollution. Electricity generated from renewable energy source has the lowest effect on the environment. Lighting is one of the biggest causes of energy-related greenhouse gas emissions. The total lighting-related CO2 emission were estimated to be 1900 million tons (Mt) in 2005, which was about 7% of the total global CO2 emission from the consumption and flaring of fossil fuels. Energy efficient lighting reduces the lighting energy consumption and is not only inefficient and expensive, but also results in the release of 244 million tons of CO2 to the atmosphere every year, which is 58% of the CO2 emission from residential electric lighting globally. Replacing fuel based lighting with energy efficient lighting such as Light Emitting Diode (LED) will provide means to reduce greenhouse gas emission associated with lighting energy consumption.
2.4 Lighting Energy in Building
indirectly account some of the power consumed by air conditioning systems, as the heat added by lighting has to be removed by building cooling systems. However, lighting is essential for buildings to ensure the comfort, productivity and safely of the building’s occupants. Therefore, lighting systems need to be carefully designed to achieve the desired illumination level while using the minimum amount of energy.
This project focuses on offices building. Offices are designed to house working people engaged in thought and in a number of forms of communication (written, visual, telephone, computer, and face to face). Office lighting should enable workers to perform these tasks effectively. Since feeling of well-being, interest, and enthusiasm by the environment, consideration should be given to the design of office interiors in an effort to achieve a stimulating work place. Office lighting affects the appearance of the space and its occupants, and therefore their mood and productivity. Naturally, lighting should provide good visibility for the tasks. Although it is important to consider the luminous environment and the lighting visual tasks separately, these aspects must work together. The same lighting system may contribute to both, but typically, separate luminaries should provide or augment the visual task illumination.
By, energy audit from lighting system can be achieved by means such as optimizing lighting levels, improving the efficiency of lighting systems, using control, and day lighting (using natural light). This chapter provides a brief description of some basic concept of lighting followed by typical energy auditing measures for lighting systems.