BASELINE ENERGY USE BASED RESIDENTIAL LIGHTING LOAD CURVE
ESTIMATION: A CASE OF SURABAYA
Yusak Tanoto
1, Murtiyanto Santoso
2dan Emmy Hosea
31, 2, 3. Electrical Engineering Department, Faculty of Industrial Technology, Petra Christian
University
Jl. Siwalankerto 121-131,P Building 3rd Floor, Surabaya 60236, Indonesia
1
1. Introduction
Lighting system is one of important household appliances which significantly contributed toward monthly household’s energy expenditure. Establishment of residential lighting load curve is therefore prominent as the curve will be useful for any further analysis. Nevertheless, it is difficult to develop residential lighting load curve when the residential energy consumption is measured using conventional metering device. A study of baseline residential lighting energy use was conducted by Tribwell and Lerman [1]. A survey was carried out to establish actual on-hours for all lights in a sample of 161 residences in Northwest, US. The information was used to establish cost-effective lighting to be implemented in the residential sector.
E-mail: [email protected]
Abstract
Residential lighting is one of important appliances that, in total, consume large amount of electricity. Establishment of residential lighting load curve is therefore prominent as the curve will be useful for any further analysis. Nevertheless, it is difficult to develop residential lighting load curve when the residential energy consumption is measured using conventional metering or other power monitoring device. This paper presents estimation of residential lighting load curve using Baseline Energy Use method. A survey has been conducted to collect relevant data of lighting utilization in Surabaya. Important findings from the survey include determination of number of each lamp type, average number of lamps per household, total number of lamps in households, and average daily operating hours. Considering a 96.2% share of ownership which consist of incandescent, fluorescent, and compact fluorescent lamp, it is found from the analysis that the lighting peak load is occured at 7 PM with average wattage per household of 100.1 W. Meanwhile, residential sector’s lighting peak load is reached 76.3 MW. In addition, no coincidence found when the lighting load curve compared to the adjusted system loading curve.
Keywords: Baseline Energy Use, Residential Lighting, Lighting Load Curve, lamp utilization.
This paper is focused on the development of lighting load curve through the utilization of Baseline Energy Use (BEU) method. Initially obtained from the lamp utilization survey, the load curve is constructed as an estimation to help the decision maker in analyzing
possible policy related with the residential power sector management. This paper is organized as follows; the method used in the study is presented in the next section, results and discussion is followed subsequently, and finally conclusion is presented.
2. Methods
where Z is Z value (e.g. 1.96 for 95% confidence level); p is percentage picking a choice, expressed as decimal (0.5 used for sample size needed); and c is confidence interval, expressed as decimal. For finite population, providing the predetermined population size (pop), corrected SS can be determined as:
size is by using the sample size table, which is available online as shown in [2]. In this study, three types of lamps, i.e. Incandescent Lamp (IL), Fuorescent Lamp or Tubular Lamp (TL), and Compact Fluorescent Lamp (CFL) are considered to be asked regarding to their utilization in the questionnaire. As shown in Figure 1 below, the questionnaire template is adopted from [3].
Figure 1. Questionnaire template to obtain daily lamp utilization in the residential sector.
The BEU for household’s lamp utilization can then be obtained by conducting four essential assessment after the lamp utilization data have been gathered. The following baseline, such as the number of lamps of each lamp type in the surveyed households, average number of lamps per household, estimation of total number of lamps in all households, and average daily operating hour of each lamp, will then be revealed according to the followings [3]. Number of lamps of each lamp type are obtained by conducting survey. The survey participants are asked to fill up the questionnaire as shown in Fig. 1. The variety of IL, TL , and CFL are obtained from this stage. Furthermore, the result of this initial assessment will be used to determine other data of the following three assessment and other useful characteristic of lighting utilization, such as diversity factor (DF) and coincidence factor (CF).
Average number of lamps per household (ALH) is calculated based on the ratio between number of specific lamp type (SLT) having certain rated watt
which is obtained form the survey and number of survey participants or here is sample size (SS), as:
SS number of lamp type in the surveyed households (TNL) as [4]:
TNL TNHL
ADH
(5)
3. Results and Discussion
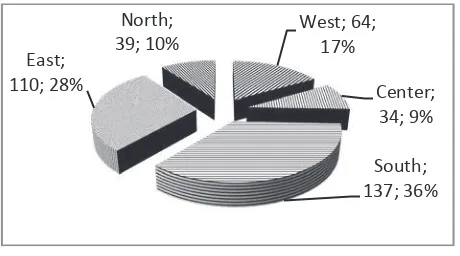
As described in earlier section, number of household to be surveyed is determined based on Equation (1) and (2). Therefore, a total number of required sample is 384 respondents which is equivalent to the same number of household, considering 762,248 households in Surabaya. The questionnaire is then distibuted randomly to all Surabaya areas, consisting of West, East, South, North, and Central. Composition of questionnaire distribution for lamp utilization survey in Surabaya is presented in the following figure.
representing 36% of total number of participant whereas
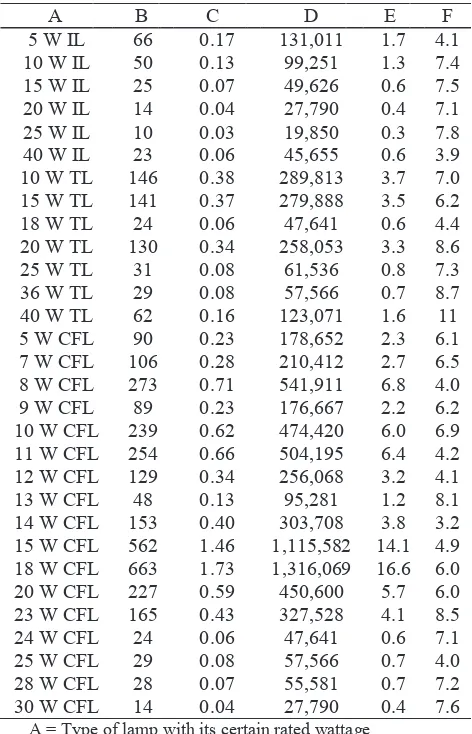
Table 1. Lamp Utilization Characteristics in Residential Sector: A Case of Surabaya
A B C D E F 15 W CFL 562 1.46 1,115,582 14.1 4.9 18 W CFL 663 1.73 1,316,069 16.6 6.0 20 W CFL 227 0.59 450,600 5.7 6.0
A = Type of lamp with its certain rated wattage B = Number of specific lamp type obtained from survey C = Average number of lamps per household
D = Total number of lamps in all households (estimation) E = Share of certain type of lamp toward total estimated
lamp (in percentage)
F =Average daily operating hours
As seen in Table 1, the lamp share of ownership in terms of three types of lamp in Surabaya is obtained as follows: CFL having the largest share of ownership with 77.4% followed with TL with 14.1% and IL with the least share of 4.7%, aggregated for 96.2%. Please be noted that only lamp type having ten or more in quantity calculated during the survey are taken into account. It
also shown that the CFL 18 W is the most widely used in the household sector, accounted for 16.6% whereas IL 25 W is least use with only 0.3% in share. It also found that 14 W CFL having the shortest daily usage with only 3.2 hours contrast to 40 W TL with 11 hours. Fig. 2 to 4 depict the calculated average daily operating hours for three lamp types with its various power rating.
Figure 3. Average daily operating hours: Compact Fluorescent Lamp (Survey 2012)
Figure 4. Average daily operating hours: Incandescent Lamp (Survey 2012)
Figure 5. Average daily operating hours: Fluorescent Lamp or Tubular Lamp (Survey 2012)
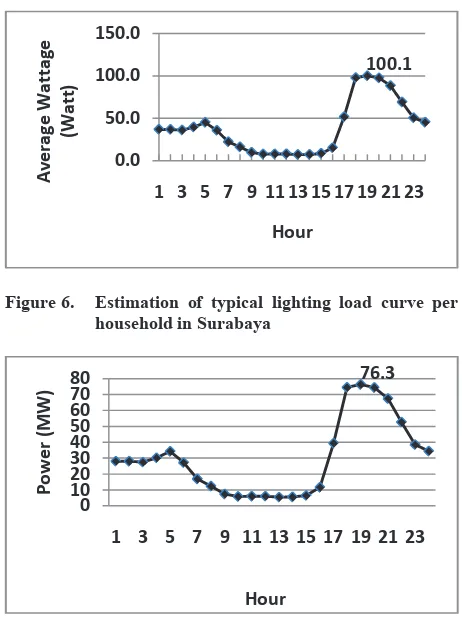
Figure 6. Estimation of typical lighting load curve per household in Surabaya
Figure 7. Estimation of typical lighting load curve for residential sector in Surabaya
Fig. 6 and 7 depict estimation of typical lighting load curve per household and for residential sector in Surabaya, respectively, taken into account 96.2% in lamp share of ownership. The curve is constructed based on each lamp power rating and their hourly usage. The peak load of lamp power consumption per household is estimated occured at 7 PM with 100.1 W. Data consisting all lamps power rating together with their total hourly usage as gathered in Fig. 1 are tabulated to obtain hourly total lamp power (W). In Fig 6, divided the hourly total power into total number of participant, the average hourly lamp power consumption per household can be determined. Similarly, multiplying average hourly lamp power consumption per household with total number of electrified households, we can obtain the estimates lighting load curve for residential sector in Surabaya, as depicted in Fig. 7. The peak load for residential lighting load in Surabaya istimated occured at 7 PM with 76.3 MW.
Figure 8. Adjusted average system load curve for Surabaya distribution area (PT. PLN APD Jatim, June – September 2011, modified)
This study also considers developing the system load curve for Surabaya to observe coincidence between lighting load and system load. The 2011 original system load curve for Surabaya distribution area was collected from PT. PLN APD Jatim [5]. The system load curve data during June – September 2011 was considered to be observed for the purpose of month similarity with the survey activity which was held during June – September 2012. This study uses assumption that no significant changes have been made during one year, particularly regarding to the lamp utilization in the residential sector.
Average value of peak load during June – September 2011 was obtained from the original data. However, due to large area of PLN’s Surabaya Distribution System, we have decided to reduce the coverage area by removing several transformers supplying into those areas, including those supplies industrial clusters. As seen on Fig. 8, the adjusted system load for Surabaya Distribution System during June – September 2011 shows its peak load at 3 PM with 543.4 MW. started to increase at 8 AM when most of industry began its operation. Commercial office followed at 9 AM, and shopping center started at 10 AM. In fact, the residential sector also contributed for the cooling load from the utilization of air conditioning system, which in turn increases the hourly power demand.
4. Conclusion
collected from the survey. From the analyses, we found that residential lighting peak load occured at 7 PM with 76.3 MW. Another finding is that residential lighting load curve has no coincidence with the system loading curve. In fact, Surabaya is the second largest city in Indonesia after Jakarta where its system load curve is also influenced by indusrial and commercial activities beside residential load. Also, lighting is only part of whole residential appliances. It can be concluded that the system load curve of Surabaya has a narrower valley than that in lighting load curve. From having such lighting as well as system curve, there will be opportunities to influence the loading curve for the purpose of energy efficiency and conservation, for example through loading management.
Acknowledgement
This paper is presented as part of research activity conducted under Contract No.07/SP2H/PP/LPPM-UKP/II/2012 based on the scheme ”Penelitian Hibah
Bersaing 2012”. Therefore, the authors would like to convey their gratitude to the Ministry of Education and Culture, Directorate of Higher Education for providing research grant through such scheme.
Reference
[1] L.S. Tribwell, D.I. Lerman, Baseline Residential
Lighting Energy Use
Study, http://eec.ucdavis.edu/ACEEE/1994-96/1996/VOL03/153.PDF, 1996.
[2] The Research Advisors, Sample Size Table, Franklin, MA., 2012. http://research-advisors.com/tools/SampleSize.htm
[3] M. Rumbayan, M.Eng Thesis, Asian Institute of Technology, Thailand, 2001.
[4] A.P. Gautam, M.Eng Thesis, Asian Institute of Technology, Thailand, 1997.