85
1.3:
P
EATLAND
R
EMOTE
S
ENSING
,
A
ERIAL
&
S
ATELLITE
I
MAGERY
A392
Assessment of Tropical Peatland Map in West Kalimantan, Indonesia…..
Kazuyo Hirose, Tomomi Takeda, Gusti Anshari, Muhammad Nuriman,
Tesuo Tanimoto, Ronny Christianto, Shigeru Takahara, Hiroshi Kobayashi,
and Gun Gun Hidayat
86
A159
GISPeatland Mapping Based on Discontinuous Data The Example of
Northern Jutland (Denmark)……….
Cosima Tegetmeyer, Alexandra Barthelmes, Mette Risager and Hans
Joosten
91
A143
Global Peatland Database @ Greifswald Mire Centre Integration,
Evaluation and Generation of Geospatial Data………..
Alexandra Barthelmes, Cosima Tegetmeyer, Franziska Tanneberger, Reni
Barthelmes, Stephan Busse and Hans Joosten
92
A318
Historical Development of Industrial Scale Oil Palm Over Peatland in Riau
and West Kalimantan Provinces, Indonesia………
Syaiful Anwar, Syed Aziz Ur Rehman, Untung Sudadi, Bandung Sahari and
Supiandi Sabiham
97
A146
Identification of Tropical Peat Forest Vegetation Using Spectroradiometer
and Hyperspectral Imagery in Central Kalimantan, Indonesia……….
Hendrik Segah, Freddy Wijaya, Laju Gandharum and Hiroshi Tani
102
A413
Remote Sensing Imagery in Tropical Peatland Mapping: A Review………..
Chloe Brown, Doreen Boyd, Sofie Sjögersten and Paul Aplin
107
A444
Tropical Peatlands Characterization using Temporal PALSAR/PALSAR2
Mosaic Data: A Case Study in Siak Regency, Riau, Indonesia……….
Dandy Aditya Novresiandi and Ryota Nagasawa
97
Abstract No: A318
HISTORICAL DEVELOPMENT OF INDUSTRIAL SCALE OIL PALM PLANTATION
OVER PEATLAND IN RIAU AND WEST KALIMANTAN PROVINCES, INDONESIA
Syaiful Anwar1*, Syed Aziz Ur Rehman2, Untung Sudadi1, Bandung Sahari3 and Supiandi Sabiham1
1Faculty of Agriculture, Bogor Agricultural University, Indonesia
2Former graduate student, Faculty of Agriculture, Bogor Agricultural University, Indonesia 3Indonesian Palm Oil Association, Indonesia
* Corresponding author: [email protected]
SUMMARY
Over the past three decades oil palm plantation (OPP) in Indonesia has been developed on peatland. Expansion of OPP is a large scale land use change and is having dynamics to the environments. In the perspective of national level resource management and policy development regarding peatlands, understanding the historical expansion of OPP over peatland and explores the dynamics of aboveground biomass (AGB) during the land use changes is much needed. The study area consisted of two provinces in Indonesia, namely Riau and West Kalimantan. This study highlights the conversion of peat swamp forests (PSF) based on the status of primary or secondary forests. The study also reported on the transitions occurred in AGB in the peatlands that have been developed for OPP by distinguishing classes of peat thickness. Landsat imagerywas used to visually interpret OPP followed by intersection with peat thickness and swamp forest maps to create provincewide maps; spanning three temporal periods spanning from 1990 to 2000 to 2010 to 2013. The AGB estimates reported in the scientific literature were used to assess the AGB loss associated with each land use change. The results show that in 1990, the two provinces collectively had approximately 0.31 Mha of OPP, which expanded to 3.04 Mha by 2013. The OPP grew at an approximately constant rate (11% yr–1). Only 0.94% (29,137 ha) of the OPP had been derived directly from primary peat swamp forest (PPSF), and 21.55% (0.67 Mha) of the OPP had been established on land previously covered with secondary peat swamp forest (SPSF) within the past 23 years (19902013) in Riau and West Kalimantan. Higher portion of SPSF converted to wet shrublands (WSL) leading to the greatest loss of AGB (85.5 M tons). Lower loss of AGB resulted by conversion from SPSF to OPP (47.5 M tons). Similarly, the loss of AGB from the conversion of PPSF to OPP (estimated to be only 4.39 M tons) was higher than for conversions from PPSF to WSL (3.44 M tons ).
Keywords: land use change, oil palm, peat swamp forest, plantation, above-ground biomass
INTRODUCTION
During the mid1980s, Indonesian government implemented policies to promote diversification of products outside the oil and gas sector focused on development of tree crop plantations. Original proposed development was Industrial Tree Crop Estate (Hutan Tanaman Industri or HTI) as a model to be established on degraded land, supposedly to reduce the demanding of natural timber. At almost the same time, there has been booming in development of oil palm plantation (OPP) from about 0.5 ha in 1984, increased to over 1.0 Mha by 1990, to approximately 2.4 Mha in 1997, and to nearly 3.0 Mha in 2000 (Pagiola, 2000). Expansion of OPP in previously swampy areas including peatlands involved the drainage of land during preparation; therefore, since the 1980s, there has been an increase in the distortion of landscapes and a loss of small segments of land held by poor landholders in the logged peatlands (Page et al., 2009). The drainage of land during preparation involves civil engineering work such as the development of road networks and waterways, ultimately leads to lowering the ground water level, creating aerobic conditions within the peat that accelerate oxidation, nitrogen mineralization and microbial activities (Hirano et al., 2007). Such logging activity causes the humid tropical forests to be highly prone to forest fires and desiccation because of wood loss and the opened canopy (Siegert et al., 2001).
98
MATERIALS AND METHODS
The study was conducted in Riau and West Kalimantan Indonesia. . Landsat imagery (4, 5, 7 and 8) of the study area were downloaded from the US Geological Survey website: http://glovis.usgs.gov/. Provincewide scale (1:250,000) peatland distribution maps were prepared by Wetland International (WI) in 2003/2004, followed by the Indonesian Centre for Agricultural Land Resources Research and Development (ICALRRD) in 2011. Peatland distribution data and peat thickness were obtained from ICALRRD (2011), which was used to obtain details related to peat thickness. The land use data for forest lands were acquired from the Indonesian Ministry of Forestry and used to locate swamp forests. Primary peat swamp forest (PPSF) and secondary peat swamp forest (SPSF) polygons were intersected with peat thickness polygons to obtain the locations of PSF.
Landsat imagery (4, 5, 7 and 8) was processed using ArcGIS® 9.3 software by performing onscreen analysis to locate OPP. During onscreen interpretation, multistage visual technique images were displayed as false color composites of various Landsat bands. The OPP were then identified and delineated, intersected with spatial extent and thickness of peat soils. The peatlayer thickness information was used to determine the extent of OPP above two groups of peat soil with thickness identified as being either more or less than 3 m. Similarly, the peat soil polygons were intersected with OPP and swamp forests data to circumscribe the PSF and to further distinguish between the peatlands and PSF. To extract PSF and differentiate it from swamp forests above mineral soils, the land use change data for forests was overlaid with peatland maps across each time periods of 19902000, 20002010, and 20102013. The primary outputs of the data analysis were land cover change matrices. The results were then compared with land cover maps and published statistics from other studies. To estimate the changes in AGB across selected land uses, the reported estimates of AGB from the scientific literature were used. The decline in biomass was estimated by multiplying the spatial change (ha) in AGB during each land use transition based on the difference of biomass.
The average time for carbon storage in standing oil palm tree excluded harvested and cut palm frond is 25 years during the rotation period. Applying the differences in the AGB carbon stocks, the C lost during each land use transition was estimated by multiplying the difference factor with the areal increase in each time period, following the timeaveraged biomass stocks from this study and applied C fraction (CF = 0.50) [ton C (ton dm) 1] from IPCC (2006) for the selected land uses. The results thus show similar trends to that of biomass losses, i.e. the greatest C loss in AGB was estimated to occur in areas converted from SPSF to WSL, i.e. 42.8 M tons. This is followed by conversion from SPSF to OPP, i.e. 23.8 M tons. Whilst C loss in AGB from the conversion of PPSF to OPP was estimated to be only 2.19 M tons, and this is higher than C loss in AGB from the conversion of PPSF to WSL i.e. 1.72 M tons.
RESULTS AND DISCUSSION
Current and Historical Oil Palm Plantations in Peatlands
99
[image:5.595.69.541.104.247.2]The Conversion of Peat Swamp Forest to Oil Palm Plantations
Table 1. Oil palm plantations in peatlands based on peat thickness in West Kalimantan and Riau, Indonesia
Year Land Use Mineral soil (ha) Oil Palm over Peat (ha) D1 D2 D3 D4 Grand Total West Kalimantan
1990 Oil Palm 43,518 140 43,658
2000 Oil Palm 181,498 3,193 7,035 2,490 194,216
2010 Oil Palm 359,960 57,571 39,877 9,288 12,558 479,253
2013 Oil Palm 641,799 81,449 131,287 27,549 24,796 906,880
Riau
1990 Oil Palm 246,402 4,855 42,37 13,734 26 269,255
2000 Oil Palm 845,340 59,415 147,643 130,425 25,718 1,208,541
2010 Oil Palm 972,696 61,116 212,804 187,477 52,791 1,486,884
2013 Oil Palm 1,087,486 66,364 268,721 395,374 310,755 2,128,700 Peat thickness classes: D1, 50–100 cm; D2, 100–200 cm; D3, 200–300 cm; D4, > 300 cm
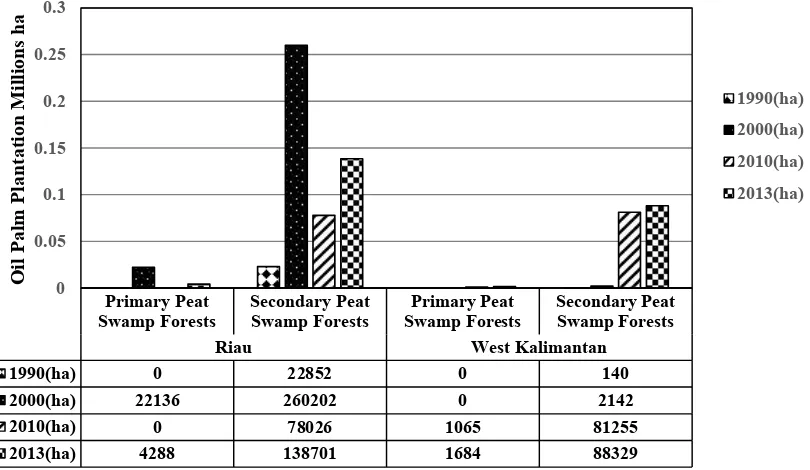
The results show that a very minute fraction of OPP has been derived from primary peat swamp forests (PPSF); most of the OPP has been established on land previously inhabited by secondary peat swamp forests (SPSF). Our results supported the finding (Figure 1) that in both provinces the expansion took place initially using SPSF and then in the later stages (from 2010 to 2013) some portion of PPSF has also been used. This study revealed that the exploitation of PSF for OPP is indirect and that PSF is not only being converted to OPP but also to other land uses. After analyzing all regions and temporal periods in both provinces, only 0.94% (29,137 ha) of the OPP had been derived directly from PPSF; 21.55% (0.67 Mha) had been established on land previously covered with SPSF. In particular, Riau had the overall highest observed magnitude of SPSF conversion from 1990–2000, while in West Kalimantan more expansion took place from 2000–2010. An overall comparison shows that Riau had the highest spatial extent of OPP that had replaced both primary and secondary PSF, i.e. 26,424 ha and 499,782 ha compared to 2,749 ha and 171,865 ha in West Kalimantan, respectively. The research results are both similar to and distinct from study of Miettinen et al. (2012). Some researchers believe that the expansion of OPP in Indonesia is one of several drivers of deforestation. However, it is a misconception to allege that all OPP originate from PPSF, as described by Pagiola (2000).
Figure 1. Temporal expansion of oil palm plantations and conversion of primary and secondary peat swamp forest in Riau and West Kalimantan, Indonesia
Loss of Above-Ground Biomass Because of Land Use Changes
The change in AGB is an obvious outcome in various land use changes. These changes involve a change from systems such as forests with high levels of biomass stock to less densely vegetated ecosystems such as
Primary Peat
Swamp Forests Secondary PeatSwamp Forests Swamp ForestsPrimary Peat Secondary PeatSwamp Forests
Riau West Kalimantan
1990(ha) 0 22852 0 140
2000(ha) 22136 260202 0 2142
2010(ha) 0 78026 1065 81255
2013(ha) 4288 138701 1684 88329
0 0.05 0.1 0.15 0.2 0.25 0.3 Oil Pa lm Pla nta tio n M
illions ha 1990(ha)
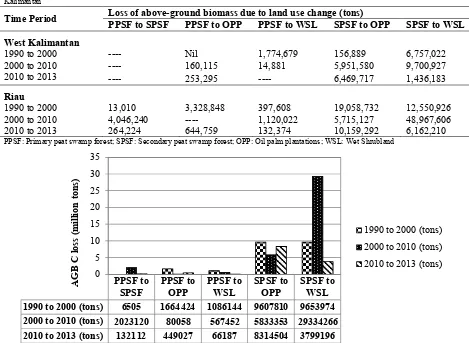
[image:5.595.94.499.447.682.2]100 shrublands or monocultures such as OPP. The biomass lost from 1990 to 2013 during all time periods was estimated (Table 2 and Figure 2) for each land use change category using the difference of biomass in each land use type per hectare. By totaling the AGB lost during all time periods and in both provinces, the highest amount of AGB loss was found to be a result of the conversion of SPSF to WSL (85.5 M tons); this was followed by 47.5 M tons from the conversion of SPSF to OPP. Similarly, the AGB loss from the conversion of PPSF to OPP was estimated to be only 4.39 M tons, which is higher than the 3.44 M tons lost by the conversion from PPSF to WSL. During the three periods analyzed, the greatest loss of AGB was estimated in areas converted from SPSF to WSL i.e. 19.30 M tons, 58.66 M tons and 7.59 M tons; this was followed by areas with a conversion from SPSF to OPP i.e. 19.21 M tons, 11.66 M tons and 16.62 M tons, respectively. During the same time periods, the estimated loss of AGB from conversion of PPSF to OPP was 3.32 M tons, 0.16 M tons and 0.89 M tons, which is higher than the loss of AGB from conversions of PPSF to WSL, which were 2.17 M tons, 1.13 M tons and 0.13 M tons, respectively.
Table 2. Loss of above ground biomass from primary and secondary PSF conversion to oil palm plantation and other land uses in Riau and West Kalimantan
Time Period Loss of above-ground biomass due to land use change (tons) PPSF to SPSF PPSF to OPP PPSF to WSL SPSF to OPP SPSF to WSL
West Kalimantan
1990 to 2000 Nil 1,774,679 156,889 6,757,022
2000 to 2010 160,115 14,881 5,951,580 9,700,927
2010 to 2013 253,295 6,469,717 1,436,183
Riau
1990 to 2000 13,010 3,328,848 397,608 19,058,732 12,550,926
2000 to 2010 4,046,240 1,120,022 5,715,127 48,967,606
2010 to 2013 264,224 644,759 132,374 10,159,292 6,162,210
PPSF: Primary peat swamp forest; SPSF: Secondary peat swamp forest; OPP: Oil palm plantations; WSL: Wet Shrubland
PPSF: Primary peat swamp forest; SPSF: Secondary peat swamp forest; OPP: Oil palm plantations; WSL: Wet shrubland; AGB: Aboveground biomass; LUs: Land uses
Figure 2. Overall loss of AGB carbon from primary and secondary PSF conversion to OPP and other land uses
CONCLUSION AND RECOMMENDATIONS
It is obvious that oil palm plantation (OPP) in Indonesia have developed extensively over time. This research revealed that OPP replaced secondary peat swamp forest (SPSF) to the extent that secondary in terms of areas. OPP that directly converted primary peat swamp forest (PPSF), in fact, only minor, less than 1% of the total OPP expansion during 1990 to 2013 in Riau and West Kalimantan. Similarly, higher area of SPSF was converted to wet shrubland (WS), leading to the greatest loss of aboveground biomass (AGB) when compared with all other types of land use change. This study does not cover the social and economic aspects of the trajectory of land use change; therefore, we recommend further studies should analyze shorter time periods and use advance remote sensing technologies other than visual interpretation to identify the economic and social factors that drive the land use change. Special consideration should be given to exploring the causes of major and spontaneous land use changes, e.g. conversion of SPSF to WSL, using field surveys and the knowledge of local indigenous peoples.
PPSF to
SPSF PPSF toOPP PPSF toWSL SPSF toOPP SPSF toWSL 1990 to 2000 (tons) 6505 1664424 1086144 9607810 9653974 2000 to 2010 (tons) 2023120 80058 567452 5833353 29334266 2010 to 2013 (tons) 132112 449027 66187 8314504 3799196
0 5 10 15 20 25 30 35 AG B C loss (m illion to ns)
101
ACKNOWLEDGEMENTS
The authors acknowledge the research team of the Indonesian Palm Oil Association (GAPKI) who financed this study in collaboration with Peat Society of Indonesia (HGI). We are also grateful to the Indonesian Agency for Agricultural Research and Development of the Ministry of Agriculture for helping us obtain secondary data and technical support.
REFERENCES
a) ICALRRD (Indonesian Centre for Agricultural Land Resources Research and Development). 2011. Peta Lahan Gambut Indonesia Skala 1:250.000 (Indonesian peatland map at the scale 1:250,000). Indonesian Agency for Agricultural Research and Development, Ministry of Agriculture, Republic of Indonesia. Bogor, Indonesia. 30pp.
b) IPCC (Intergovernmental Panel on Climate Change). 2006. IPCC Guidelines for National Greenhouse Gas Inventories, Prepared by the National Greenhouse Gas Inventories Programme, H.S. Eggleston, L. Buendia, K. Miwa, T. Ngara, and K. Tanabe (eds). Published: IGES, Japan.
c) Hirano, T., H. Segah, T. Harada, S.H. Limin, T. June, R. Hirata, and M. Osaki. 2007. Carbon dioxide balance of a tropical peat swamp forest in Kalimantan, Indonesia. Global Change Biology. 13(2): 412425.
d) Miettinen, J., A. Hooijer, D. Tollenaar, S. Page, C. Malins, R. Vernimmen, and S.C. Liew. 2012. Historical analysis and projection of oil palm plantation expansion on peatland in Southeast Asia. International Council on Clean Transportation. 22pp.
e) Page, S.E., A. Hoscilo, H. Wösten, J. Jauhiainen, M. Silvius, J. Rieley, H. Ritzema, K. Tansey, L. Graham, H. Vasander, and S.H. Limin. 2009. Restoration ecology of lowland tropical peatlands in Southeast Asia: current knowledge and future research directions. Ecosystems. 12(6): 888905.
f) Pagiola, S. 2000. Land use change in Indonesia. Washington, DC: World Bank Environment Department. 29pp.