235
AGRIVITA VOLUME 36 No. 3 OCTOBER – 2014 ISSN : 0126-0537
LAND SUITABILITY AND DYNAMIC SYSTEM MODELLING TO DEFINE PRIORITY
AREAS OF SOYBEAN PLANTATION IN PADDY FIELDS IN KARAWANG, WEST JAVA
Widiatmaka1*), Wiwin Ambarwulan2), Irman Firmansyah3), Khursatul Munibah1),
Paulus B.K. Santoso4) and Sudarsono1)
1) Department of Soil Science and Land Resources, Bogor Agricultural University, Indonesia 2) Geospatial Information Agency, Indonesia
3) Study Program of Environmental Management, Bogor Agricultural University, Indonesia 4) Data and Information Center, Ministry of Agriculture, Indonesia
*) Corresponding author Phone: +62-251-8629360 E-mail: [email protected]; [email protected]
Received: August 4, 2014 / Accepted: October 27, 2014
ABSTRACT
One of the agricultural public commodities in Indonesia which still can not fulfill the domestic consumption needs is soybean. The objectives of this research were: (i) to identify the suitable area for soybean plantation in paddy fields, (ii) to assess the development of soybeans in land use and socio-economic context, and (iii) to plan the spatial plantation of soybean. A land evaluation for soybean was completed. IKONOS imagery was analyzed to delineate paddy fields, while a dynamic system modelling was developed integrating physical and socio-economic aspects. The research results showed that the land suitability class for soybean plantation in the paddy fields in Karawang Regency ranged from not suitable (N) to suitable (S2), with limiting factors such as temperature, fertility, nutrients retention, slope, erosion, rooting media and toxicity. Very limited arable land has been used actually for soybeans plantation due to low economic returns. The model predicts that if the development of soybean continues in its business as usual path, a deficit of soybean will increase in 2030. The model provides alternative scenarios to reduce the deficit. Prioritization was done spatially using the suitable land gradually. Keywords: land evaluation, land use planning,
soybean production and consumption INTRODUCTION
Indonesia is currently facing serious problems in terms of food supply due to high amount of population. The supply adequacy of rice as the staple food of the country is alarming
(Dursin, 2012). The domestic demand of other food commodities such as beef, corn, sugar, are so far resolved through the import mechanism, which is of course worrying in terms of national food security (Simatupang et al., 2005; Supadi, 2009).
One of the commodities which is now a basic requirement of the people but still can not be fulfilled through the national agricultural supply is soybean. The limitation in domestic soybean production in recent years has led the government to introduce an exemption of 0% of soybean import duty in 2013 (Ministry of Finance, 2013), while in the past, this commodity was subject to 5% of import duty. Several researches (Suminartika, 2008; Hayati et al., 2014) indicate that the omission of import tariffs will result in lower prices for the domestic soybean and thus will cause difficulties for soybean farmers. Meeting the needs through imports may cover the short-term needs of soybeans in the country, but of course this solution is only resolving the problem temporarily (Simatupang et al., 2005). This is evident from the fact that the import has also experienced problems. The decline in US soybean production caused by crop failures due to bad weather in 2012 (Crutchfield, 2013) triggered domestic soybean price volatility in Indonesia. Based on this experience, the fulfillment of these needs through domestic production should be ensured.
Soybean domestic production is currently an alarming fact. The data from the Indonesian Bureau of Statistics (1990-2013) showed that there was a decline in soybean plantation in the last decade. As an illustration, if in 1993 Indonesian soybean planting areas encompassed
around 1,468,316 ha, the planting area in 2013 was only 554,132 ha. Although the average productivity has successfully been improved significantly from 1,163 kg.ha-1 in 1993 to 1,457
kg.ha-1 in 2013, the production decline cannot be
avoided due to the decrease of planting area: only 807,568 tons of soybeans were produced in 2013, a substantial decrease of less than half of the production of 1993, which was 1,707,126 tons.
Meanwhile, soybean consumption in Indonesia increased from 3.43 kg.capita-1.year-1
in 1970s (Mursidah, 2005) to 9.97 kg.capita
-1.year-1 in 2012 (IAARD, 2012). The 851,286
tons of local soybean production in 2011 were able to meet only 29% of the total national need. Indonesia imported then 2,087,986 tons of soybean to make up for the lack of 71% of domestic soybean (Indonesian Bureau of Statistics, 2011). This challenge will continue to grow with the increase of population. In addition to human consumption, soybean demand continues to grow along with the increasing use for animal feed (Anonymous, 2011). The need will also increase with the prospect of using this commodity for biofuels (Brown, 2008; Pimentel et al., 2009; Naylor et al., 2008; Liu and Li, 2010).
There are many factors that cause planting area to dwindle, which in turn leads to the decrease of production. The main cause is believed to be the lack of farmers’ interest to plant soybeans because of low economic returns (Amaliyah, 2013; Suyamto and Widiarta, 2013). Efforts should therefore be made to raise the interests of farmers, among others, the identification of potential land for cultivation, which should be coupled with production incentives such as provision of attractive price (Adisarwanto, 2010). If soybean prices and trading system can be improved, it is possible to increase production because there are still lands available. The situation can be improved by planting soybean only in biophysically suitable areas in order to enhance high productivity. This is where we may insist on the importance of land suitability evaluation. The method of land suitability evaluation for soybean as well as for other commodity has been developed (FAO, 1976; Rossiter, 2001). Since farmers play a big role in this matter, the improvement of the farmers’ income needs also to be reflected. Therefore, an integrated analysis taken into
account the aspects of land availability, land suitability, soybean demand and supply and other socio-economic aspects need to be considered. The dynamic system modelling can facilitate the integration of these aspects (Liu et al., 2007; Ferretti and Pomarico, 2013; Russel et al., 2013; Turner et al., 2013).
Karawang Regency is an agricultural production center. The main crops in this region is paddy. Soybean was generally planted as an alternative commodity in between two paddy plantation periods and thus, soybeans would not be a competitor for paddy. As a paddy production center, theoretically there are still vast area of paddy field to be planted by soybean. As an illustration, according to the data of Indonesian Bureau of Statistics (1990-2013), the paddy field area in 2011 in this regency encompass around 95,927.65 ha, however, soybean plantation in 2011 has decreased to only 585.16 ha in 2011, while soybean plantation in 1993 was 104,772 ha. Hence, the research was done in the context of developing soybean as an alternative crop rotation to paddy. Karawang is also an area close to the state capital, Jakarta, so that changes in land use from agricultural land to non-agricultural use is quite dynamic.
The objectives of this research were to: (i) identify the suitable area for soybean plantation in paddy fields, (ii) to assess the development of soybeans in land use and socio-economic context, and (iii) to plan the spatial soybean plantation priority in paddy field according to dynamic socio-economic factors.
MATERIALS AND METHODS
237 Widiatmaka et al.: Land Suitability and Dynamic System Modelling……….……….
485 mm.month-1 rainfall and the driest month is
July with 5 mm.month-1 rainfall.
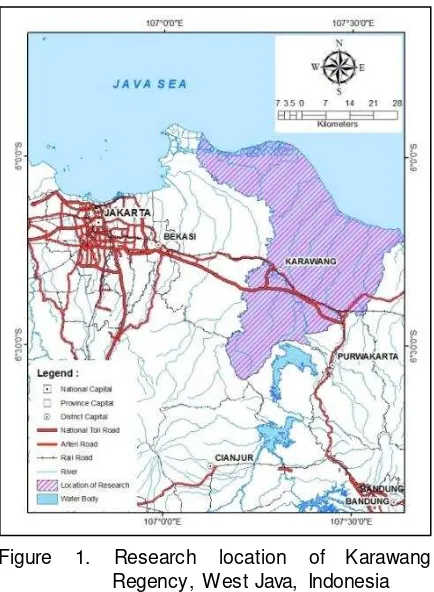
Figure 1. Research location of Karawang Regency, West Java, Indonesia Paddy Field delineation. As the analysis in this study is focused on soybean planted in paddy fields, existing paddy field was first delineated by using high-resolution (1 m) imagery, IKONOS of 2012. The delineation was done by Ministry of Agriculture.
Land Suitability Analysis. Analysis of land suitability for soybean in paddy fields area was done using the Automated Land Evaluation System (ALES), according to the method described in Rossiter (2001), Albaji et al. (2009) and Widiatmaka et al. (2012). The Land Mapping Unit (LMU) evaluated was taken from previous soil mapping at scale of 1:50,000 which included 68 soil samples (Faperta IPB, 1993; Puslittanak, 1996). Twenty additional soil samples were conducted for this study in 2013. Detailed LMU is not presented in this paper due to page limitations. Land suitability criteria used was the criteria from Land Ressources Evaluation Project (LREP II) (Hardjowigeno and Widiatmaka, 2007; Ritung et al., 2007). Result of land evaluation was land classification into
classes of S1 (very suitable), S2 (suitable), S3 (marginally suitable), N1 (currently not suitable) and N2 (permanently not suitable). The sub-class was indicated by abbreviation of limiting factors (Hardjowigeno & Widiatmaka, 2007; Djaenudin et al., 2003).
The procedure of land evaluation in ALES were performed in several steps including determination of land use type (LUT), in this case soybean monoculture in paddy fields, land use requirements (LUR), land characteristics (LC), and analysis using decision tree. The software used for land evaluation was ALES ver. 4.65e. The analysis was done by integrating Arc-GIS 10.1 and ALES. LCs used for land evaluation were stored in ALES database. The knowledge deriving from the expert was used to evaluate the suitability of each LMU. The results of ALES land evaluation were then transferred to Arc-GIS for geographic reference in order to depict the results in the form of map and tabulation.
Economic land suitability has also been done with ALES using the data of Indonesian Bureau of Statistics. The result was compared with economic land suitability of paddy field. Detail of the economic analysis will however not be presented, it can be consulted in Widiatmaka et al. (2012).
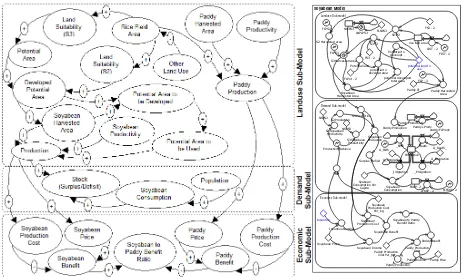
Dynamic System Modelling. The dynamic system models were used to formulate, simulate and validate the sustainable land use for soybean. System dynamics is designed for analysis of complex physical-socio-economic systems (Shen et al., 2009). A detailed description of the methodology is presented by Forrester (1968). This methodology has been applied into various fields,including environmental sustainability (Forrester, 1961, 1968), environmental management (Mashayekhi, 1990), transport and land use planning (Heimgartner, 2001; Shen et al., 2009; Luo et al., 2010), mining ressources (Elshkaki, 2013), land and water resource planning (Ford, 1996; Zarghami and Akbariyeh, 2012), ecological modelling (Li et al., 2012), agricultural sustainability (Saysel et al., 2002; Turner et al., 2013), regional planning and management(Guo et al., 2001).
is governed entirely by the passage of time and model developed in this research consisted broadly of 3 (three) sub-models, namely: (i) land this includes lands currently planted with soybeans and unused land that has the potencies for soybean planting. All of these
factors would affect the planted and harvested area of soybeans.
Land use sub-model is related to the economic sub-model through the soybean price and soybean production costs. The higher the price of soybeans, the lower the production costs, or in other words, the higher the profits, the higher the willingness of farmers to plant soybeans. Many researches have indicated this phenomena (Prasetyo et al., 2012; Suyamto and Widiarta, 2013). This sub-model is also related to the profitability of paddy production.
The results of the survey for this research
Figure 2. Causal loops of soybean dynamic system model
239 Widiatmaka et al.: Land Suitability and Dynamic System Modelling……….……….
The model validation was performed by error analysis using 2 (two) parameters: (i) Absolute Mean Error (AME), which is the difference between the average value (mean) of the results of simulation with the actual value; the actual value means the value obtained from the actual data of Indonesian Bureau of Statistics, and (ii) Absolute Variation Error (AVE), which is the deviation of variation (variance) of simulation with actual variation. The limits of acceptable deviation were between 1-10% (Hartrisari, 2007).
AME = [(Si – Ai)/Ai]...(1) Si = Si N, where S = simulation value
Ai = Ai N, where A = actual value N = time series interval
AVE = [(Ss – Sa)/Sa]...(2) Ss = ((Si – Si)2 N) = deviation of simulation value
Sa = ((Ai – Ai) 2 N) = deviation of actual value
To facilitate the formulation of policy alternatives, scenarios were formulated in the model. The scenarios were compiled according to type and level of intervention to the existing policy. In the case of soybean production in Karawang Regency, some considerations for the compilation of policy alternatives were: (i) whether there were sufficient suitable lands for soybean? (ii) If yes, where, and could such
lands be located spatially? (ii) whether it was possible to give incentives to farmers in an effort to increase the planting area, rather than providing incentives to import duty exemption?
RESULTS AND DISCUSION
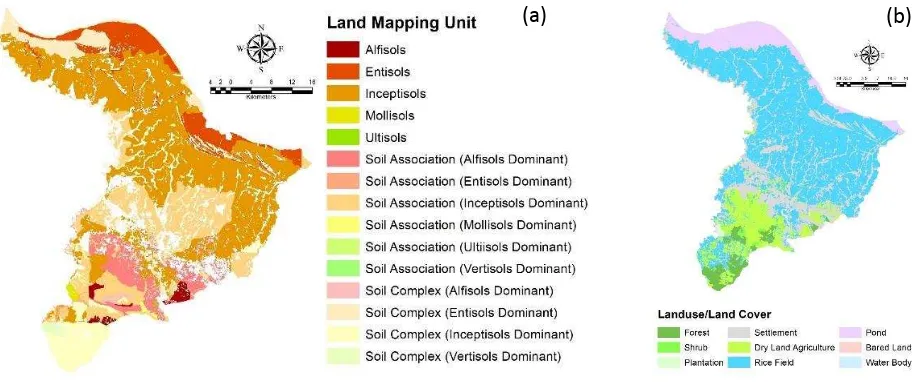
Karawang Regency as a whole is composed of 65 LMUs. LMU is compiled based on LMU components, including the soil classification in sub-group category, parent material, slope, and landform. Figure 3a presents the spatial distribution of soil types. The soil classification in this figure was grouped in order category (Soil Survey Staff, 2010) to facilitate the presentation.
In the category of soil order (Soil Survey Staff, 2010), the dominant soil was Inceptisols, followed by Entisols. Other soils found were Alfisols, Ultisols and Molisols (Figure 3a). Most of the soils were found in the form of associations and complex of LMU. The mapping scale was at 1:50,000 (Faperta IPB, 1993; Puslittanak, 1996).
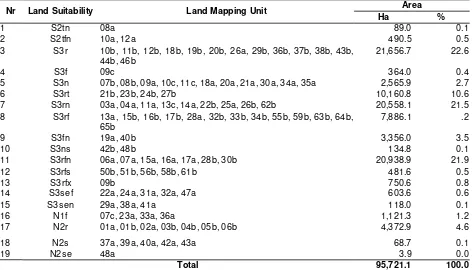
The results of land use and land cover analysis are presented in Figure 3b and Table 1. The main land-use in Karawang was respectively paddy fields, residential, agricultural dry land and ponds. Paddy field is the largest land use, covering 53.9% of the total area of analysis.
Figure 3. Map of: (a) soil class at sub-group categories, and (b) land cover, of Karawang Regency
Table 1. Land use and land cover of Karawang Regency
Nr Landuse/Land Cover Area
Ha %
1 Water Body 1,001.0 0.5
2 Shrub 741.8 0.4
3 Forest 6,811.3 3.6
4 Plantation 496.0 0.3
5 Settlement 39,706.7 20.7 6 Dry Land Agriculture 21,016.4 11.0 7 Paddy Field 103,093.6 53.9
8 Pond 18,472.0 9.7
9 Bared Land 67.2 0.0
Total 191,405.9 100.0
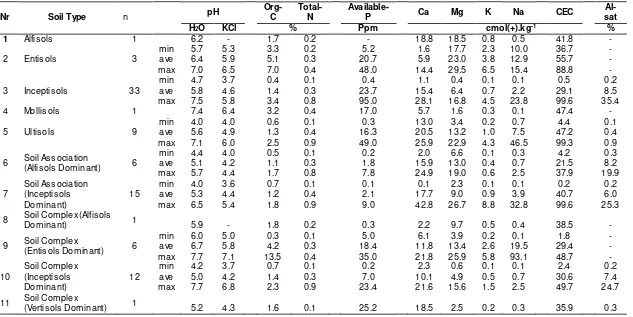
Soil samples that were used to determine land quality and land characteristics were analyzed, the summary of this analysis is presented in Table 2. Soil sampling locations are presented in Figure 4a. The actual land suitability map for soybean in existing paddy field area is presented in Figure 4b and Table 3. The results of the analysis of potential land suitability, when treatments to overcome limiting factors were provided, are presented in Figure 4c.
The results of the analysis of actual land suitability for soybean in paddy fields showed that land suitability for soybeans ranged from S2 (suitable) to N2 (permanently not suitable). The total suitable land for soybean, S2 and S3 class, was 95,721.11 ha, out of 103,093.59 of paddy field area. In the S2 class, land quality which became the limiting factor for soybeans growth included r (rooting medium), n (available nutrients), f (nutrient retention), and t (temperature). In the S3 (marginally suitable) land suitability class for soybeans, the limiting factors were r (rooting medium), f (nutrient retention), t (temperature), n (available nutrients) and x (toxicity). The land suitability of N (not suitable) for soybeans appeared with limiting factors such as r (rooting medium), f (nutrient retention), s (toxicity) and e (erosion). From these limiting factors, those which extensively appeared were r (rooting medium), n (available nutrients) and f (nutrient retention). The limiting factor of rooting medium that often arises was the soil texture. Some areas, especially in the northern part of Karawang Regency, have a relatively coarse texture. A low level of available P, which is a limiting factor of available nutrient, appeared in
most areas, while K-exchangeable was relatively non-problematic. Low organic matter was a limiting factor on nutrient retention.
Some limiting factors could not be improved by farmers because of their inadequate technology, for exemple the land quality of rooting medium which was caused by soil texture. The percentage of nutrient retention (f) which was caused by low organic-C could be improved through the application of organic manures. The availability of nutrients (n) could be improved through the application of P or K fertilizer according to the land characteristics.
The result of the economic land suitability analysis showed that the value of gross margin received by farmers when they plant soybean in S2 soybean-suitable class land was only Rp. 4,441,875.00. This value was much lower than the results received from paddy planted in S2 paddy field-suitable class, which achieved a gross margin of Rp. 26,542,200.00. This result describes why soybean planting is not economically attractive for farmers. These results confirm the continuous decline in soybean-planted area. According to the interviews with farmers, out of 42 respondents, 93% of them said that they did not want to plant soybeans because the yields were not worth the efforts. Most respondents (83%) stated that they were willing to plant if the government provided a subsidy of 5% of the price. When the subsidy was increased to 10%, 98% of respondents were motivated to plant soybeans. The constraint however is the willingness of the government to support such policy, in addition to the availability of the budget.
241
Widiatmaka et al.: Land Suitability and Dynamic System Modelling……….……….
Table 2. Summary of analysis result of soil samples1)
Nr Soil Type n pH
Org-C
Total-N
Available-P Ca Mg K Na CEC
Al-sat
H2O KCl % Ppm cmol(+).kg-1 %
1 Alfisols 1 6.2 - 1.7 0.2 - 18.8 18.5 0.8 0.5 41.8 -
2 Entisols 3
min 5.7 5.3 3.3 0.2 5.2 1.6 17.7 2.3 10.0 36.7 -
ave 6.4 5.9 5.1 0.3 20.7 5.9 23.0 3.8 12.9 55.7 -
max 7.0 6.5 7.0 0.4 48.0 14.4 29.5 6.5 15.4 88.8 -
3 Inceptisols 33
min 4.7 3.7 0.4 0.1 0.4 1.1 0.4 0.1 0.1 0.5 0.2
ave 5.8 4.6 1.4 0.3 23.7 15.4 6.4 0.7 2.2 29.1 8.5
max 7.5 5.8 3.4 0.8 95.0 28.1 16.8 4.5 23.8 99.6 35.4
4 Mollisols 1 7.4 6.4 3.2 0.4 17.0 5.7 1.6 0.3 0.1 47.4 -
5 Ultisols 9
min 4.0 4.0 0.6 0.1 0.3 13.0 3.4 0.2 0.7 4.4 0.1
ave 5.6 4.9 1.3 0.4 16.3 20.5 13.2 1.0 7.5 47.2 0.4
max 7.1 6.0 2.5 0.9 49.0 25.9 22.9 4.3 46.5 99.3 0.9
6 Soil Association
(Alfisols Dominant) 6
min 4.4 4.0 0.5 0.1 0.2 2.0 6.6 0.1 0.3 4.2 0.3
ave 5.1 4.2 1.1 0.3 1.8 15.9 13.0 0.4 0.7 21.5 8.2
max 5.7 4.4 1.7 0.8 7.8 24.9 19.0 0.6 2.5 37.9 19.9
7
Soil Association (Inceptisols Dominant)
15
min 4.0 3.6 0.7 0.1 0.1 0.1 2.3 0.1 0.1 0.2 0.2
ave 5.3 4.4 1.2 0.4 2.1 17.7 9.0 0.9 3.9 40.7 6.0
max 6.5 5.4 1.8 0.9 9.0 42.8 26.7 8.8 32.8 99.6 25.3
8 Soil Complex (Alfisols
Dominant) 1 5.9 - 1.8 0.2 0.3 2.2 9.7 0.5 0.4 38.5 -
9 Soil Complex
(Entisols Dominant) 6
min 6.0 5.0 0.3 0.1 5.0 6.1 3.9 0.2 0.1 1.8 -
ave 6.7 5.8 4.2 0.3 18.4 11.8 13.4 2.6 19.5 29.4 -
max 7.7 7.1 13.5 0.4 35.0 21.8 25.9 5.8 93.1 48.7 -
10
Soil Complex (Inceptisols Dominant)
12
min 4.2 3.7 0.7 0.1 0.2 2.3 0.6 0.1 0.1 2.4 0.2
ave 5.0 4.2 1.4 0.3 7.0 10.1 4.9 0.5 0.7 30.6 7.4
max 7.7 6.8 2.3 0.9 23.4 21.6 15.6 1.5 2.5 49.7 24.7
11 Soil Complex
(Vertisols Dominant) 1 5.2 4.3 1.6 0.1 25.2 18.5 2.5 0.2 0.3 35.9 0.3
Remarks: 1) Soil samples were taken at 0-20 cm depth
241
W
id
ia
tma
ka
e
t a
l.:
L
a
n
d
Su
ita
b
ili
ty
a
n
d
D
yn
a
mi
c
Syst
e
m
……….
.
Mo
de
llin
g………
.
(a) (b) (c)
Figure 4. Map of: (a) soil sampling locations, (b) the actual land suitability, and (c) the potential land suitability, for soybean in paddy fields area, Karawang, West Java Province
Table 3. Actual land suitability for soybean
Nr Land Suitability Land Mapping Unit Area
Ha %
1 S2tn 08a 89.0 0.1
2 S2tfn 10a, 12a 490.5 0.5
3 S3r 10b, 11b, 12b, 18b, 19b, 20b, 26a, 29b, 36b, 37b, 38b, 43b, 44b, 46b
21,656.7 22.6
4 S3f 09c 364.0 0.4
5 S3n 07b, 08b, 09a, 10c, 11c, 18a, 20a, 21a, 30a, 34a, 35a 2,565.9 2.7
6 S3rt 21b, 23b, 24b, 27b 10,160.8 10.6
7 S3rn 03a, 04a, 11a, 13c, 14a, 22b, 25a, 26b, 62b 20,558.1 21.5
8 S3rf 13a, 15b, 16b, 17b, 28a, 32b, 33b, 34b, 55b, 59b, 63b, 64b, 65b
7,886.1 .2
9 S3fn 19a, 40b 3,356.0 3.5
10 S3ns 42b, 48b 134.8 0.1
11 S3rfn 06a, 07a, 15a, 16a, 17a, 28b, 30b 20,938.9 21.9
12 S3rfs 50b, 51b, 56b, 58b, 61b 481.6 0.5
13 S3rfx 09b 750.6 0.8
14 S3sef 22a, 24a, 31a, 32a, 47a 603.6 0.6
15 S3sen 29a, 38a, 41a 118.0 0.1
16 N1f 07c, 23a, 33a, 36a 1,121.3 1.2
17 N2r 01a, 01b, 02a, 03b, 04b, 05b, 06b 4,372.9 4.6
18 N2s 37a, 39a, 40a, 42a, 43a 68.7 0.1
19 N2se 48a 3.9 0.0
243 Widiatmaka et al.: Land Suitability and Dynamic System Modelling……….……….
Land use planning based on a dynamic system was then composed from the results of the land suitability analysis. The scenarios constructed are as follows: (i) there is no consideration that land conversion in Karawang Regency will occur (Widiatmaka et al., 2013), simulation will produce the most rational outcome and should be applied as the recommended policy.
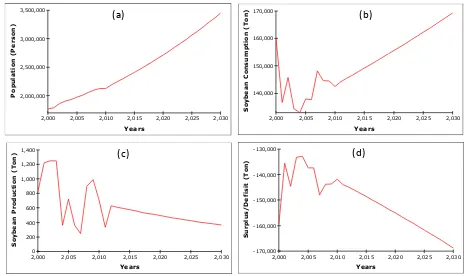
The results of the simulation up to 2030 which has calculated by taking into consideration the increase of population, soybean consumption, including soybean surplus and deficit are presented in Figure 5 (a, b, c), where the number supply of soybeans in Karawang Regency.
Figure 5. Results of simulation models for: (a) population growth, (b) soybean consumption c) soybean production, and (d) soybean deficit
2,000 2,005 2,010 2,015 2,020 2,025 2,030 -170,000
2,000 2,005 2,010 2,015 2,020 2,025 2,030 0
2,000 2,005 2,010 2,015 2,020 2,025 2,030 140,000
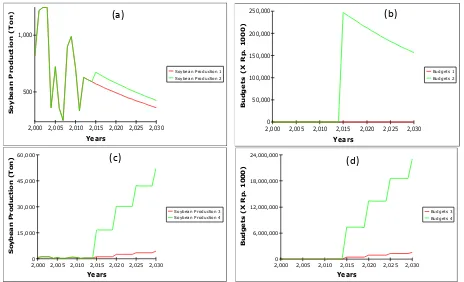
Figure 6. (a) Result of the model according to scenario 1 (soybean production 1) and scenario 2 (soybean fertilizer intensification which results in an upsurge of productivity and an amelioration of infrastructure received from the subsidy. The model assumed that the budget would increase its productivity compared to that without subsidy. Scenario-2 implies that the government should provide a subsidy budget of Rp. 156,334,620. suitable soybean plantation area is available. This value takes into account the land conversion rate in Karawang Regency as calculated in other research (Widiatmaka et al., 2013). Similar to other scenarios, taking into consideration the capability of the government, the planting areas deliberately planned gradually increase every 5 years. With this scenario,
2,000 2,005 2,010 2,015 2,020 2,025 2,030 0
2,000 2,005 2,010 2,015 2,020 2,025 2,030 0
2,000 2,005 2,010 2,015 2,020 2,025 2,030
0
2,000 2,005 2,010 2,015 2,020 2,025 2,030
245 Widiatmaka et al.: Land Suitability and Dynamic System Modelling……….……….
the actual data reaches 0.0047%, whereas in term of Absolute Variation Error (AVE), the deviation reaches 0.0128%. In harvesting areas, the deviation from the actual data is 0.0350% in terms of AME, whereas in term of AVE, the deviation is 0.0486%. For data of soybean production, the deviation from the actual data in term of AME is 0.9% while in term of AVE, the deviation is 2.4935%. Thus, the limit of deviation based on the results of this test is <10%. It can be concluded that based on these validity tests the model provided is able to simulate the soybean production changes that occur.
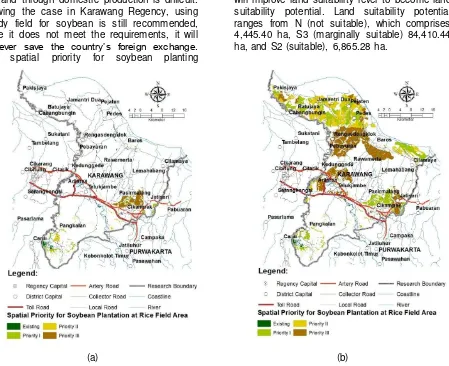
Based on the scenarios tested, it seems that it is very difficult to achieve self-sufficiency in soybeans. Since soybean is not a native tropical commodity, meeting the increasing demand through domestic production is difficult. Viewing the case in Karawang Regency, using paddy field for soybean is still recommended, while it does not meet the requirements, it will however save the country’s foreign exchange. The spatial priority for soybean planting
according to the scenario 3 and 4, which are the most recommended scenarios, are presented in Figure 7. In this figure, prioritization was done according to the land suitability: the higher the level of suitability, the more it becomes priority.
CONCLUSION
The results of the research showed that paddy fields in Karawang Regency have a suitability class for soybean ranging from not suitable (N), comprising 5,566.7 ha, marginally suitable (S3), 89,575.00 ha, and suitable (S2), 579.41 ha. From the analysis, the identified limiting factors were temperature, fertility, nutrients retention, slope, erosion, rooting media, and toxicity. Agricultural management improvements will improve land suitability level to become land suitability potential. Land suitability potential ranges from N (not suitable), which comprises 4,445.40 ha, S3 (marginally suitable) 84,410.44 ha, and S2 (suitable), 6,865.28 ha.
(a) (b)
From this available land, so far only 872 ha of arable land was used for soybeans plantations. Low returns has caused farmers to be reluctant to plant soybeans. The outcome of the interviews showed that most of the farmers are willing to plant soybeans, if the subsidy given is about 5-10% of the sale price of soybean.
There will certainly be a deficit of soybean in 2030 if the government policy in soybean planting continues as it is currently. The model predicts a deficit of 168,801.63 tons. If the government is willing to increase their budget support to Rp 1,589,014,293.76, there will be a reduction of the deficit to become 164,763.04 tons instead; through soybean planting in an area with S2 level of land suitability. If the government can provide a budget of Rp. 23,075,091,185.04, then the soybean supply deficit will be reduced to become 116,935.26 tons. The options for the government is highly dependent on the willingness and budget availability.
It is suggested to plant soybeans in biophysically suitable area. The prioritization can be done spatially and was presented in this study. This analysis shows that planning is essential and must start now so the situation does not worsen in the future.
ACKNOWLEDGEMENT
This research was financed by the Directorate General of Higher Education, Ministry of National Education of the Republic of Indonesia, through Operational Support for State Universities (Bantuan Operasional Perguruan Tinggi Negeri - BOPTN), Bogor Agricultural University, Indonesia. The research paper has been presented (oral presentation) in The 20th
World Congress of Soil Science, June 12th, in
Jeju, South Korea (IDS3 – Soil Information and Food Security, O46-6) through the funding of International Seminar Program of the Directorate General of Higher Education, Ministry of National Education of the Republic of Indonesia. The full paper is not included in the proceeding of the congress in order to be fully submitted to this journal.
REFERENCES
Adisarwanto, T. 2010. Soybean production enhancement strategies as the efforts to meet the domestic needs and reducing imports. Development in Agricultural Innovation, 3(4): 319-331 (in Indonesian). Albaji, M, A. A. Naseri, P. Papan, S. B. Nasab.
2009. Qualitative evaluation of land suitability for principal crops in the West Shoush Plain, Southwest Iran. Bulgarian Journal of Agricultural Science, 15 (2) 2009, 135-145. Agricultural Academy. Amaliyah, R. 2013. Importing soybeans: should
be continued to proceed? (effect of trade liberalization on Indonesian soybean). Global & Policy, 1 (1): 19-30 (in Indonesian).
Anonymous. 2011. World food security-everyone now wants arable land. Appropriate Technology, 38 (1): 53-56. Badan Pusat Statistik (Indonesian Bureau of
Statistics). 1990 to 2013. Statistik Tanaman Pangan. http://www.bps.go.id/ tnmn_pgn.php?kat=3&id_subyek=53¬ ab=0. Retrieved January to August 2014. Brown, L.R. 2008. Why ethanol production will
drive world food prices even higher in 2008. Earth Policy Institute, January 24, 2008.http://www.earthpolicy.org/Updates/ 2008/update69.htm. Retrieved 28 March 2014.
Coyle, R.G. 1996. System Dynamics Modelling: a Practical Approach. Chapman & Hall, London.
Crutchfield, S. 2013. U.S. Drought 2012: Farm and food impacts. United States Department of Agriculture, Economic Research Service. http://www.ers.usda. gov/topics/in-the-news/us-drought-2012-farm-and-food-impacts.aspx. Retrieved June 7, 2014.
Djaenudin, D, H. Marwan, H. Subagyo, A. Hidayat. 2003. Technical Guidelines for Land Evaluation for Agricultural Commodities. Soil Research Institute, Soil and Agro-climate Research Center, Agricultural Research Agency, Ministry of Agriculture (in Indonesian).
247 Widiatmaka et al.: Land Suitability and Dynamic System Modelling……….……….
Elshkaki, A. 2013. An analysis of future platinum resources, emissions and waste streams using a system dynamic model of its intentional and non-intentional flows and stocks. Resources Policy, 38: 241– 251.
FAO. 1976. A framework for land evaluation. FAO Soils Bulletin No. 32. Food and Agricultural Organization, Rome.
Faperta IPB. Tim Survai Fak. Pertanian, IPB. 1993. Survai dan pemetaan tanah semi detil DAS Citarum Bawah, Kab. Karawang, Purwakarta, Bekasi, Prov. Jawa Barat. Proyek Litbang Sumberdaya Lahan dan Agroklimat, LREP II, Skala 1:50.000.
Ferretti, V., S. Pomarico. 2013. Ecological land suitability analysis through spatial indicators: an application of the Analytic Network Process technique and Ordered Weighted Average approach. Ecological Indicators, 34: 507– 519.
Ford, A. 1996. Testing snake river explorer. System Dynamics Review. 12(4): 305– 329.
Forrester, J. W. 1961. Industrial Dynamics. The MIT Press, Cambridge, MA.
Forrester, J.W. 1968. Principles of System. Productivity Press, Cambridge.
Guo, H. C., L. Liu, G. H. Huang, G. A. Fuller, R. Zou, Y.Y. Yin. 2001. A system dynamics approach for regional environmental planning and management: a study for the Lake Erhai Basin. Journal of Environmental Management. 61(1): 93– 111.
Hardjowigeno, S., Widiatmaka. 2007. Land Evaluation and Land Use Planning. Gadjahmada University Press, Yogyakarta (in Indonesian).
Hartrisari. 2007. Dynamic system: Concepts of System and Modelling for Industry and Environment (in Indonesian). SEAMEO-BIOTROP. Bogor.
Hayati, M., R. Anindita, N. Hanani, D. Koestiono. 2014. Impact of food import tarrif decrease in Indonesia. Studia Universitatis Babeș-Bolyai Oeconomica. 59 (1): 73-87.
Heimgartner, C. 2001. System dynamic modelling of transport and land use: a first model draft. The first Swiss Transport Research Conference.
Indonesian Agency for Agricultural Research and Development (IAARD). 2012. Soybean expansion in the forest as a source of seed. Sinar Tani. XLII (3470): 1-9 (in Indonesian).
Li, F.J., S.C. Dong, F. Li. 2012. A system dynamics model for analyzing the eco-agriculture system with policy recommendations. Ecological Modelling, 227: 34al M
Liu, M., D. Li. 2010. An analysis on total factor productivity and influencing factors of soybean in China. Journal of Agricultural Science, 2 (2): 158-163.
Liu, Y., L.Xiaojian, X. Qin, H. Guo, Y.Yu, J. Wang, G. Mao. 2007. An integrated GIS-based analysis system for land-use management of lake areas in urban fringe. Landscape and Urban Planning, 82: 233–246.
Luo, G., C. Yin, X. Chen, W. Xu, L. Lu. 2010. Combining system dynamic model and CLUE-S model to improve land use scenario analyses at regional scale: A case study of Sangong watershed in Xinjiang, China. Ecological Complexity, 7: 198–207
Mashayekhi, A.N. 1990. Rangeland destruction under population growth: the case of Iran. System Dynamics Review, 6(2): 167–193. Ministry of Finance of the Republic of Indonesia.
2013. Regulation of the Minister of Finance of the Republic of Indonesia No. 133/PMK.011/2013 on the amendment regulation of the Minister of Finance No.213/PMK.011/2011 on goods classification system and the imposition of import duty on imported goods.
Mursidah. 2005. The development of national soybean production and the efforts of development in East Kalimantan. EPP Journal, 2 (1): 39-44.
Naylor, R.L., A.J. Liska, M.B. Burke, W.P. Falcon, J.C. Gaskell, S.D. Rozelle, K. G. Cassman. 2008. The ripple effect: biofuels, food security, and the environment. Environment, 49 (9): 32-43. Pimentel, D., A. Marklein, M.A. Toth, M.N.
Prasetyo, B., P.U. Hadi, N.K. Agustin, C.R. Adawiyah. 2012. The Study on Alternative Model of Aid in Seeds and Fertiliser to Increase Food Production (in Indonesian). 2012 Final Report. Socio-Economic and Agricultural Policy Analysis Centre, Agricultural and Development Research Institute, the Ministry of Agriculture. http://pse.litbang.deptan.go.id/ind/pdffiles/ LHP_2012_BPY.pdf. Retrieved 3 Aug 2014.
Puslitanak. 1995. Survai dan Pemetaan Tanah Semi Detil DAS Citarum Bawah, Propinsi Jawa Barat. Proyek Penelitian dan Pengembangan Sumberdaya Lahan dan Agroklimat/LREP II Part C. Bogor, Skala 1:50.000.
Ritung, S, Wahyunto, F. Agus, H Hidayat. 2007. Land suitability evaluation with a case map of Aceh Barat district. Indonesian Soil Research Institute and World Agroforestry Centre.
Rossiter, D.G. 2001. ALES’s Home Page: Documentation and software for the Automated Land Evaluation System (ALES) expert system framework. http://www.css.cornell.edu/landeval/ales/a les.htm.
Russell, S., A.B. Barron, D.Harris. 2013. Dynamic modeling of honey bee (Apis mellifera) colony growth and failure. Ecological Modelling, 265: 158– 169. Saysel, A. K., Y. Barlas, O. Yenigun. 2002.
Environmental sustainability in an agricultural development project: a system dynamics approach. Environmental Management, 64(3): 247–260.
Shen, Q., Q. Chen, B. Tang, S. Yeung, Y. Hu, G. Cheung. 2009. A system dynamics model for the sustainable land use planning and development. Habitat International, 33: 15–25.
Simatupang, P., Marwoto, D.K.S. Swastika. 2005. Soybeans and Research Policy Development in Indonesia (in Indonesian). Workshop in Soybean Development on Sub-optimal Lands of BALITKABI, Malang, July 26 ,2005 .
Soil Survey Staff. 2010. Keys to Soil Taxonomy. United States Department of Agriculture, Natural Resources Conservation Service. 7th Edition.
Suminartika, E. 2008. The effects of import tariff on demand and farm productivity of soybean industry in Indonesia. PhD thesis, Universiti Putra Malaysia.
Supadi. 2009. Impact of the sustained soybean import on food security. Jurnal Analisis Kebijakan Pertanian, 7 (1): 87-102. Suyamto, IN Widiarta. 2013. National Soybeans
Development. Proceeding in Radiation and Isotope Application Technology Workshop (in Indonesian). digilib.batan.go .id/ppin/katalog/file/9789793558257-2010-037.pdf. Retrieved 1 Aug 2014.
Turner, B.L., R.D. Rhoades, L.O. Tedeschi, R.D. Hanagriff, K.C. McCuistion, B.H. Dunn. 2013. Analyzing ranch profitability from varying cow sales and heifer replacement rates for beef cow-calf production using system dynamics. Agricultural Systems, 114: 6–14.
Widiatmaka, S.P. Mulya, M. Hendrisman. 2012. Evaluasi lahan permukiman transmigrasi pola lahan kering menggunakan Automated Land Evaluation System (ALES): studi kasus Rantau Pandan SP-2, Provinsi Jambi. Geomatika 18(2): 44 – 157.
Widiatmaka, W. Ambarwulan, K. Munibah. 2013. Land use change during a decade as determined by landsat imagery of a rice production region and its implication to regional contribution to rice self sufficiency: case study of Karawang Regency, West Java, Indonesia. In: G.H. Pramono, D. Ramdani, B. Barus, R.M. Ariansyah. 2013. Bridging Sustainable Asia. Proceeding of 34th. Asian Conference on Remote Sensing. Bali 20-24 Oct 2013. pp. 834-840.