Trop. For. Manage. J. VII (1) : 23-36 (2001)
PRACTICAL TECHNIQUE FOR DETECTING MANGROVE
VEGETATION USING DIGITAL MOS MESSR AND LANDSAT-5
TM IMAGES
:
A Case Study in Karawang Cape, West Java
Tehnik Praktis Mendeteksi Vegetasi Mangrove Menggunakan Citra
Dijital MOS MESSR dan Landsat-5 TM: Study Kasus di Tanjung
Karawang, Jawa Barat
I NENGAH SURATI JAYA1), M. BUCE SALEH2), RUDI ICHSAN ISMAIL3), HENDRI NURWANTO3), CECEP KUSMANA4) AND NOBUYUKI ABE5)
ABSTRAK
Studi ini menerangkan bagaimana algoritme-algoritme indeks separabilitas dan akurasi klasifikasi seyogyanya diterapkan secara benar untuk mendeteksi obyek-obyek yang dikehendaki secara optimal. Studi ini menemukan bahwa akurasi Kappa dan kriteria Separabilitas (Transformed Divergence) harus digunakan secara simultan. Evaluasi dengan hanya menggunakan akurasi Kappa saja atau separabilitas saja akan memberikan hasil yang keliru. Algoritme-algoritme yang diterapkan diujicobakan pada data dijital MOS MESSR (Marine Observation Satellite Multispectral Self-Scanning Radiometer) dan Landsat TM (Thematic Mapper) untuk mendeteksi distribusi vegetasi mangrove. Studi ini memperlihatkan bahwa algoritme-algoritme yang diujicobakan pada MESSR dan TM berhasil mendeteksi distribusi mangrove secara baik, dengan akurasi pengguna (user accuracy) dan akurasi pembuat (producer’s accuracy) yang cukup tinggi berkisar antara 55% dan 100%.
INTRODUCTION
In Indonesia, the existences of mangrove forest are under pressured from land conversion activities. The uniqueness of mangrove region in swampy area that has been found suitable for fishpond had caused various conflict of interests. In the last decades, major parts of mangrove forest were converted into fishponds. The loss of mangrove forest might be accompanied by the loss of their ecological function, for instance, as a buffer of seawater intrusion, fuel wood resource, construction wood resource and as an habitat of scarce fauna, particularly bird species.
1) Lecturer and scientist at the Laboratory of Forest Inventory, Faculty of Forestry, Bogor Agricultural University Kampus IPB Darmaga, Bogor
2) Ph.D student at the Graduate School of Science and Technology, Niigata University, Japan 3) Alumni of The Faculty of Forestry, Bogor Agricultural University
4) Lecturer and scientist at the Laboratory of Forest Ecology, Faculty of Forestry, Bogor Agricultural University Kampus IPB Darmaga, Bogor
In order to get reliable and timely information on the actual condition of mangrove vegetation, the use of terrestrial inventory could be time consuming and costly. Now, with the widespread availability of satellite remote sensing data in digital form, there is a possibility to get land cover information rapid and accurate manner. However, most of remote sensing practitioner is often focused on the advent of finer spatial resolution of the satellite data. Development of practical technique for detecting object of interest is often ignored.
Objective
Many kind of digital classification techniques have been developed and used to detect forest cover types, ranging from simple ones, such as single channel density slicing, to more complex techniques such as maximum likelihood classifier and principal component analysis. Most of the technique evaluation only relies on classification accuracy analysis. In this study, the authors hypothesized that interclass separability could give significant contribution to the success of the land cover discrimination. Therefore a practical technique using separability and Kappa accuracy algorithms for detecting mangrove vegetation were evaluated.
METHODS
Study Area and Data
The study area is located in Karawang Cape region, Muara Gembong District, Bekasi Utara Regency, West Jaya, extending from 106°59’25” to 107°06’05” East longitude; and from 05°54’45” to 05°59’30” South Latitude. Most parts of the study area are covered by mangrove vegetation, rice field, fishpond and bare land. The study was performed from mid May 1997 to October 1997.
The satellite images examined in this study were MOS MESSR (Marine Observation Satellite Multispectral Electric Self-Scanning Radiometer) acquired in 1991 and Landsat-5 TM (Thematic Mapper) acquired on 20 May 1992. Since the time interval between satellite data acquisition and ground check is nearly six years, the existing ancillary data such as land cover map, topographic map are also used as a reference. Interview data with local people concerning land conversion history were also collected as reference during establishing training data in the field.
Geometric Correction
Land Cover Categories
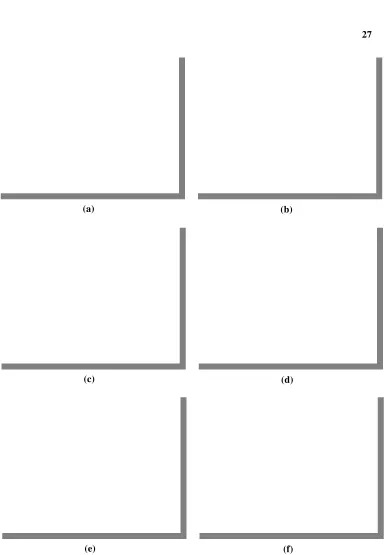
These multisensor images were analyzed independently. For MESSR data that was acquired in 1991, six land cover categories were established, i.e., (a) mangrove, (b) rice field, (c) dry cropland, (d) River, (e) fishpond and (f) Sea on the other hard, for Landsat-5 TM, eight categories were developed, namely (a) sea 1, (b) sea 2, (c) fishpond, (d) mangrove, (e) rice field, (f) settlement and (g) dry crop land. Descriptions of each category are as follows:
Mangrove
This category is a land is covered by mangrove vegetation. In the sparse density, the wet soil underlying the mangrove vegetation contributes significantly the reflectance of mangrove. This category presents in both MESSR and TM data.
Sea 1
In the TM image, the seawater was divided into two classes, i.e., sea 1 and sea 2. The sea 1 is the shallow sea water body that have much suspended sediments. In the true color image, this category appeared in light brown color. This category spread out in the surrounding coastal area.
Sea 2
The sea 2 is clear seawater that is located in relatively far from coastal area. Almost no sedimentation appeared in this category. In the true color image, this criterion appeared in dark blue color. In the MESSR image, the sea 1 and sea 2 were merged into single category and referred to as sea.
Fishpond
Fishpond is a land that used as coastal pond for raising fish. In this category, most part of the area is covered by water and by few trees over it scottered randomly.
Rice field
Rice field is an irrigated rice field that is used for rice cultivation. During the image acquisition (May), the senescent paddy areas were occured.
Settlement
This category is settlement area that consisted of community settlement buildings such as woody houses and cement/or brick houses.
Dry cropland
River
Fresh water bodies dominate this category. The water quality is commonly muddy and appears to have light brown color in the true color of TM.
The training area representing each of land cover type was located in relatively homogenous and unchanged since the date of satellite data acquisition. The minimum size of training area in the image is 3x3 pixels and numbers of pixel selected in each category are ranging from 19 to 30 pixels. The ground condition describing each category and their appearance in the color composite images are depicted in Figure 1.
Detection Strategy and Data Analysis
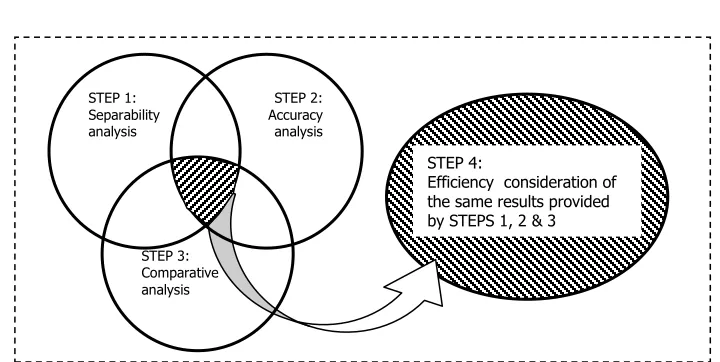
A practical techniques applied in this study includes (1) separability analysis using Transformed Divergence (TD) measure, (2) maximum likelihood classification and (3) accuracy analysis using Kappa accuracy ( ) measure. In detail, the mathematical expression of the TD and Kappa accuracy and their variances can be found in Jaya (1993) and Jaya and Kobayashi (1995). Schematically, the strategy of the technique is depicted in Figure 2. The performed analysis covers the following steps:
Step 1: separability analysis
Interclass separabilities between mangrove and other land cover categories were evaluated and ranked. This step produced the best band combination that could separate the mangrove and other categories statistically. If there is inseparable distance between mangrove and other categories, merging process or re-selection of training area was then performed.
Step 2: Classification and accuracy analysis
The band combinations that provided the Kappa accuracy of more than 90% were selected and ranked in descending order. The statistical differences of the ranked Kappa accuracies were examined using Ztest. This step recognized a set of band combinations that provided high accuracies (> 90%) and statistical difference.
Step 3: Comparison analysis
The results obtained from the steps 1 and 2 were compared. A set of band combination that is recognized as the best combination both in step 1 and step 2 were selected. Then, the interclass separability provided by the selected band combination was re-evaluated, particularly among non-mangrove categories. Interactive evaluation of separability and accuracy using both separability and confusion matrices were done. Step 4: Efficiency consideration
(a) (b)
(c) (d)
(e) (f)
Figure 2. Venn Diagram of the technique applied in this study
RESULTS AND DISCUSSION
Spectral Signatures
MESSR images
To get a better understanding on spectral behavior and potential discriminator ability, a comparison of spectral signatures among land covers was performed. The spectral signatures of the mangrove category provided by either MESSR or TM data was compared against other land cover categories, i.e., rice field, dry crop land, river, sea, fishpond and settlement. The comparisons were accomplished by graphical evaluation of the MESSR and TM bands as depicted in Figures 3 and 4, respectively.
STEP 2: Accuracy analysis
STEP 3: Comparative analysis STEP 1: Separability analysis
STEP 4:
5
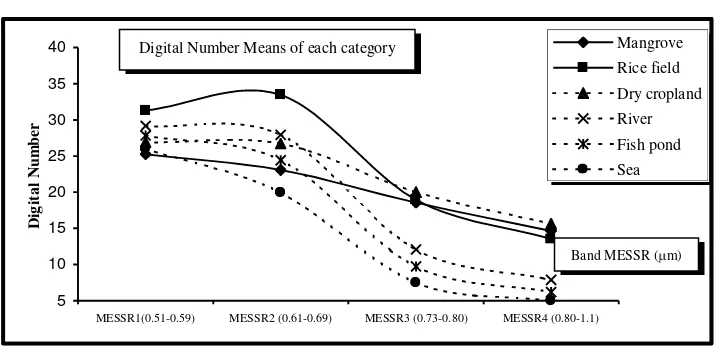
Figure 3. The spectral signatures of the land cover categories in the study site provided by MESSR bands
As described in Figure 3, the reflectance of mangrove category decreases when the wavelength of MESSR bands increases. This condition might be due to sparse condition of mangrove vegetation so that the underlying wet surface predominantly contributes the reflectance of mangrove. Starting from the green band (MESSR band 1[0.51 m-0.59 m]); then the red band (MESSR band 2 [0.61-0.69 m), up to infrared band (MESSR band 3[0.73 m-0.80 m] and 4[0.80 m-1.10 m]), the reflectance of wet surface decreases when the wavelength increases. This coincides with the curve of water reflectance characteristic. According to Richards (1993), the water reflects about 10% or less in the blue-green range, a smaller reflectance in the red and certainly no energy in the infrared range. Within the MESSR 2 (band 2) than other MESSR bands (bands 1, 3 and 4). The DN mean values of each category are well separated. This MESSR2 band is red band suitable for discriminating land covers is related to green biomass and water contents (Jaya and Kobayashi, 1996), i.e., forested/vegetated area, bare land, and swampy and dry cropland.
Digital Number Means of each category
0
TM1(0.51-0.59) TM2 (0.61-0.69) TM3 (0.63-0.69) TM4 (0.76-0.90) TM5 (1.55-1.75) TM7 (2.08-2.35)
D
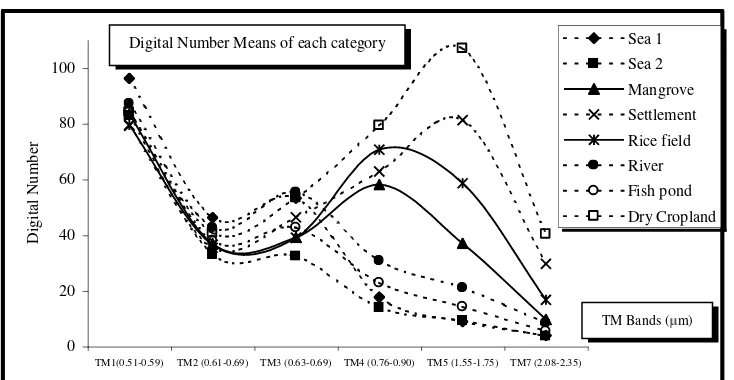
Figure 4. The spectral signatures of the land cover categories in the study site provided by Thematic Mapper bands
Spectral signature evaluation was also performed on TM data that acquired in 1992. In Figure 4, TM data visually depict good separation between classes, particularly using TM band 3, 4, 5 or 7. As recorded by Landsat TM in 1992, the visual inspection revealed that the mangrove density might increase, so that the reflectance of mangrove vegetation follows the common spectral reflectance curve of vegetation as described by Richards (1993). The mangrove reflectance shall increase when the wavelength increases from TM band 3 (red [0.63-0.69 m]) to TM band 4 (near infrared [0.76-0.90 m], then decreases when moving to middle infrared (TM band 5[1.55-1.75 m] & 7 [2.08-2.35 m]). The similar pattern is also given by rice field category. For dry cropland and settlement categories, from TM 2 to TM 7, the reflectance increase continuously achieving the peak at TM band 5 then decreases when it moving to band 7.
In quantitative classification, particularly when the maximum likelihood decision rule or mahalanobis distance is applied, the classification result depends upon their class signatures, i.e., their means and variances. Although two or more categories show very close DN means, their statistical separations could be influenced by their variance significantly. In this study, statistical evaluation for measuring interclass separation was also performed using the Transformed Divergence separability index. This index considers both means and variances of the categories to be compared. The separation criteria could be found in Jensen (1986); Jaya (1993); and Jaya and Kobayashi (1995).
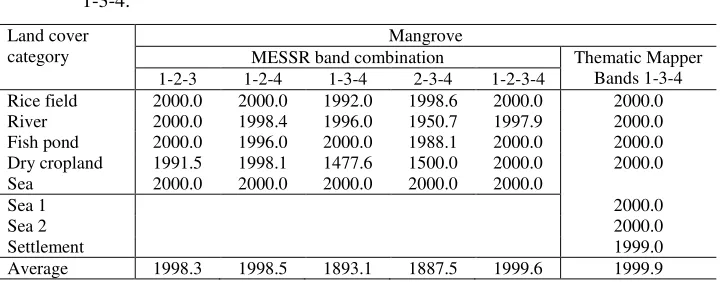
As described in Table 1, this study shows that better separations are provided by inclusion of MESSR1, MESSR2 plus MESSR3 or MESSR4 in the band combination (1-2-3 or 1-2-4). The MESSR1 is green band, while MESSR(1-2-3 and MESSR4 are within the range of the infrared band. Although single MESSR1 provides relatively clustered DN
Digital Number Means of each category
means than MESSR3 and MESSR4, their contribution is significant on enhancing interclass separation. As shown, the combinations of MESSR bands 2-3 (1998.3) and 1-2-4 (1998.5) give higher TD average (TDavg) than MESSR 1-3-4 (1893.1) and 2-3-4
(1887.5). This study noticed that the MESSR3 and MESSR4 have redundant information, so that inclusion of these two bands together could not improve interclass separation significantly. The band combinations 1-3-4 and 2-3-4 of MESSR band are fail to separate between mangrove and dry cropland significantly as depicted by their TD values less than 1600. i.e., 1477.6 and 1500, respectively.
Thematic Mapper images
Referring to the wavelength of the TM bands, band 1 and band 2 of the MESSR are equal to band 2 (green) and band 3 (red) of the Thematic Mapper (TM), respectively. Meanwhile, bands 3 and 4 of the MESSR are included within the range of TM band 4. As shown by many researches, e.g., Jensen (1986), Richards (1993), Jaya and Kobayashi (1995), and Jaya (2000a) and 2000b), the infrared band shows superior performance as compared to the visible bands for discriminating vegetated and non-vegetated land covers. In this study, the MESSR results were compared with the optimal TM band combination, i.e., TM bands 1-3-4 (blue-red-near infrared) in detecting mangrove vegetation. As shown in Figures 3 and 4, better interclass separations are provided by the infrared band, either near infrared or middle infrared. Using TM bands, better discrimination was provided by TM bands, giving TDavg of 1-3-4 is 1999.9, which is almost excellent. Noting the interclass
separability between mangrove and other land covers, only a little confusion occurred between mangrove and settlement (Table 1).
Land cover discrimination
Table 1. Transformed divergence measures between mangrove and other land cover categories using several combination of MESSR and combination of TM bands 1-3-4.
Remarks: The criteria of the Transformed Divergence measures are as follows (Jaya and Kobayashi,
1995): excellent: TD = 2000; good: TD between 1900 and < 2000; fair: TD between 1700
and <1900; poor: TD between 1600 and <1700; and inseparable: TD < 1600.
Table 2. The Kappa accuracies of MESSR and TM band combinations. MESSR band
All band (1-2-3-4) 96.97 All six reflective bands (1-2-3-4-5-7) 98.05
2-3-4 96.21 1-2-3-4-5 97.38
Remarks: Kappa accuracy values that are connected by line express that those values are not significantly different at 95% confidence level.
When the TM is applied, the combination of band 1-3-4 and 1-2-3-4 gave similar accuracy. Although all six reflective TM bands were used, the interclass separation between mangrove and other categories could not be improved significantly. However, for detecting mangrove vegetation, the combination of band 1-3-4 provides good and excellent interclass separabilities (Table 4) and quite high accuracy (Table 7). Applying more than 3 band could be time consuming and inefficient.
the pixel size of the MESSR is 50 m x 50 m (0.25 Ha), the minimum size of areas that recommended to be recognized is approximately 2.25 Ha (3 x 3 pixels).
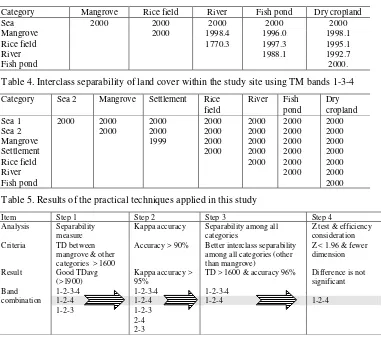
Table 3. Interclass separability of land cover within the study site using MESSR bands 1-2-4
Category Mangrove Rice field River Fish pond Dry cropland
Sea 2000 2000 2000 2000 2000
Mangrove 2000 1998.4 1996.0 1998.1
Rice field 1770.3 1997.3 1995.1
River 1988.1 1992.7
Fish pond 2000.
Table 4. Interclass separability of land cover within the study site using TM bands 1-3-4
Category Sea 2 Mangrove Settlement Rice
field
Table 5. Results of the practical techniques applied in this study
Item Step 1 Step 2 Step 3 Step 4
Accuracy > 90% Better interclass separability among all categories (other
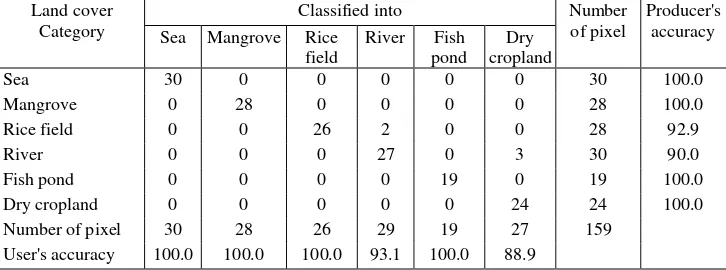
In the final classification, as previously evaluated using separability measures (Tables 3 and 4), the mangrove vegetation was well discriminated from other land covers either using MESSR or TM data. These also supported by their confusion matrices shown in Tables 6 and 7. By using MESSR bands 1-2-4, almost no confusion occurred between mangrove and other land covers, as shown by their producer's and user’s accuracies of 100%. A poor separation occurred only between rice field and rivers as indicated by their TD of only 1770 (Table 3). TM bands 1-3-4 also provide good accuracy for detecting mangrove vegetation, providing 95% user’s and 95% producer’s accuracies (Table 7). These bands separated all categories excellently (Table 4).
Table 6. Confusion matrix of land covers discrimination using MESSR bands 1-2-4. Land cover
CONCLUSIONS
From the foregoing discussion, the following conclusions are derived:
1. For detecting mangrove vegetation, an interactive separability and Kappa accuracy analysis should be performed sequentially. The evaluation, either using the separability or Kappa accuracy alone could provide a misleading result. The separability measure is beneficial to identify whether two categories could be separated statistically or not, while the Kappa accuracy is helpful in evaluating the accuracy of all categories and their statistical significance.
2. The Digital MESSR could be used to identify the distribution of mangrove vegetation precisely, providing user's and producer's accuracy of 100%. Although MESSR data have coarser spatial resolution than Thematic Mapper, their spectral ability could detect mangrove vegetation distribution. The only consideration that should be taken into account is on their spatial resolution limitation. From experience obtained from the use of MESSR data, this study recommended that the smallest size of detected area should not less than 3 x 3 pixels, i.e., approximately 2.25 Ha for MESSR or 0.81 Ha for Thematic Mapper. The recommended bands in detecting mangrove vegetation is the combination of MESSR band 1-2-4 (green-red-near infrared) or Thematic Mapper band 1-3-4 (blue-red-near infrared), providing Kappa accuracies of 96.2% and 91.5% respectively.The accuracy of TM data in detecting mangrove vegetation is also good enough, providing 95% for both user's and producer's accuracies.
ACKNOWLEDGEMENT
The authors would like to extend sincerely appreciation to The NASDA for their permission in using their digital MESSR data. The MESSR data used in this study is under copyright of NASDA, Japan.
LITERATURES CITED
Jaya, I N. S., 1993. Classifying Forest Types by Using Landsat-5 Thematic Mapper Data. Laboratory of Forest Mensuration. Department of Forestry. Master's Thesis (Unpublished).
Jaya, I N. S. and S. Kobayashi, 1995. Classification of detailed forest cover types based upon the separability algorithm: a case study in the Yahiko Mountain and Shibata Forest Area. Journal of the Remote Sensing Society of Japan, 15 (1): 40-53.
Jaya, I N S., 2000a. Detecting Burnt Forest Damage Using Digital SPOT Imagery. Tropical Forest Management Journal 6(1): 7-23.
Jaya, I N S., 2000b. Monitoring Vegetation Changes in Urban Area Using Landsat TM Imagery. Tropical Forest Management Journal 6(1): 33-42.
Trop. For. Manage. J. VII (1) : 23-36 (2001)
PRACTICAL TECHNIQUE FOR DETECTING MANGROVE
VEGETATION USING DIGITAL MOS MESSR AND LANDSAT-5
TM IMAGES
:
A Case Study in Karawang Cape, West Java
Tehnik Praktis Mendeteksi Vegetasi Mangrove Menggunakan Citra
Dijital MOS MESSR dan Landsat-5 TM: Study Kasus di Tanjung
Karawang, Jawa Barat
I NENGAH SURATI JAYA1), M. BUCE SALEH2), RUDI ICHSAN ISMAIL3), HENDRI NURWANTO3), CECEP KUSMANA4) AND NOBUYUKI ABE5)
ABSTRAK
Studi ini menerangkan bagaimana algoritme-algoritme indeks separabilitas dan akurasi klasifikasi seyogyanya diterapkan secara benar untuk mendeteksi obyek-obyek yang dikehendaki secara optimal. Studi ini menemukan bahwa akurasi Kappa dan kriteria Separabilitas (Transformed Divergence) harus digunakan secara simultan. Evaluasi dengan hanya menggunakan akurasi Kappa saja atau separabilitas saja akan memberikan hasil yang keliru. Algoritme-algoritme yang diterapkan diujicobakan pada data dijital MOS MESSR (Marine Observation Satellite Multispectral Self-Scanning Radiometer) dan Landsat TM (Thematic Mapper) untuk mendeteksi distribusi vegetasi mangrove. Studi ini memperlihatkan bahwa algoritme-algoritme yang diujicobakan pada MESSR dan TM berhasil mendeteksi distribusi mangrove secara baik, dengan akurasi pengguna (user accuracy) dan akurasi pembuat (producer’s accuracy) yang cukup tinggi berkisar antara 55% dan 100%.
INTRODUCTION
In Indonesia, the existences of mangrove forest are under pressured from land conversion activities. The uniqueness of mangrove region in swampy area that has been found suitable for fishpond had caused various conflict of interests. In the last decades, major parts of mangrove forest were converted into fishponds. The loss of mangrove forest might be accompanied by the loss of their ecological function, for instance, as a buffer of seawater intrusion, fuel wood resource, construction wood resource and as an habitat of scarce fauna, particularly bird species.
1) Lecturer and scientist at the Laboratory of Forest Inventory, Faculty of Forestry, Bogor Agricultural University Kampus IPB Darmaga, Bogor
2) Ph.D student at the Graduate School of Science and Technology, Niigata University, Japan 3) Alumni of The Faculty of Forestry, Bogor Agricultural University
4) Lecturer and scientist at the Laboratory of Forest Ecology, Faculty of Forestry, Bogor Agricultural University Kampus IPB Darmaga, Bogor
In order to get reliable and timely information on the actual condition of mangrove vegetation, the use of terrestrial inventory could be time consuming and costly. Now, with the widespread availability of satellite remote sensing data in digital form, there is a possibility to get land cover information rapid and accurate manner. However, most of remote sensing practitioner is often focused on the advent of finer spatial resolution of the satellite data. Development of practical technique for detecting object of interest is often ignored.
Objective
Many kind of digital classification techniques have been developed and used to detect forest cover types, ranging from simple ones, such as single channel density slicing, to more complex techniques such as maximum likelihood classifier and principal component analysis. Most of the technique evaluation only relies on classification accuracy analysis. In this study, the authors hypothesized that interclass separability could give significant contribution to the success of the land cover discrimination. Therefore a practical technique using separability and Kappa accuracy algorithms for detecting mangrove vegetation were evaluated.
METHODS
Study Area and Data
The study area is located in Karawang Cape region, Muara Gembong District, Bekasi Utara Regency, West Jaya, extending from 106°59’25” to 107°06’05” East longitude; and from 05°54’45” to 05°59’30” South Latitude. Most parts of the study area are covered by mangrove vegetation, rice field, fishpond and bare land. The study was performed from mid May 1997 to October 1997.
The satellite images examined in this study were MOS MESSR (Marine Observation Satellite Multispectral Electric Self-Scanning Radiometer) acquired in 1991 and Landsat-5 TM (Thematic Mapper) acquired on 20 May 1992. Since the time interval between satellite data acquisition and ground check is nearly six years, the existing ancillary data such as land cover map, topographic map are also used as a reference. Interview data with local people concerning land conversion history were also collected as reference during establishing training data in the field.
Geometric Correction
Land Cover Categories
These multisensor images were analyzed independently. For MESSR data that was acquired in 1991, six land cover categories were established, i.e., (a) mangrove, (b) rice field, (c) dry cropland, (d) River, (e) fishpond and (f) Sea on the other hard, for Landsat-5 TM, eight categories were developed, namely (a) sea 1, (b) sea 2, (c) fishpond, (d) mangrove, (e) rice field, (f) settlement and (g) dry crop land. Descriptions of each category are as follows:
Mangrove
This category is a land is covered by mangrove vegetation. In the sparse density, the wet soil underlying the mangrove vegetation contributes significantly the reflectance of mangrove. This category presents in both MESSR and TM data.
Sea 1
In the TM image, the seawater was divided into two classes, i.e., sea 1 and sea 2. The sea 1 is the shallow sea water body that have much suspended sediments. In the true color image, this category appeared in light brown color. This category spread out in the surrounding coastal area.
Sea 2
The sea 2 is clear seawater that is located in relatively far from coastal area. Almost no sedimentation appeared in this category. In the true color image, this criterion appeared in dark blue color. In the MESSR image, the sea 1 and sea 2 were merged into single category and referred to as sea.
Fishpond
Fishpond is a land that used as coastal pond for raising fish. In this category, most part of the area is covered by water and by few trees over it scottered randomly.
Rice field
Rice field is an irrigated rice field that is used for rice cultivation. During the image acquisition (May), the senescent paddy areas were occured.
Settlement
This category is settlement area that consisted of community settlement buildings such as woody houses and cement/or brick houses.
Dry cropland
River
Fresh water bodies dominate this category. The water quality is commonly muddy and appears to have light brown color in the true color of TM.
The training area representing each of land cover type was located in relatively homogenous and unchanged since the date of satellite data acquisition. The minimum size of training area in the image is 3x3 pixels and numbers of pixel selected in each category are ranging from 19 to 30 pixels. The ground condition describing each category and their appearance in the color composite images are depicted in Figure 1.
Detection Strategy and Data Analysis
A practical techniques applied in this study includes (1) separability analysis using Transformed Divergence (TD) measure, (2) maximum likelihood classification and (3) accuracy analysis using Kappa accuracy ( ) measure. In detail, the mathematical expression of the TD and Kappa accuracy and their variances can be found in Jaya (1993) and Jaya and Kobayashi (1995). Schematically, the strategy of the technique is depicted in Figure 2. The performed analysis covers the following steps:
Step 1: separability analysis
Interclass separabilities between mangrove and other land cover categories were evaluated and ranked. This step produced the best band combination that could separate the mangrove and other categories statistically. If there is inseparable distance between mangrove and other categories, merging process or re-selection of training area was then performed.
Step 2: Classification and accuracy analysis
The band combinations that provided the Kappa accuracy of more than 90% were selected and ranked in descending order. The statistical differences of the ranked Kappa accuracies were examined using Ztest. This step recognized a set of band combinations that provided high accuracies (> 90%) and statistical difference.
Step 3: Comparison analysis
The results obtained from the steps 1 and 2 were compared. A set of band combination that is recognized as the best combination both in step 1 and step 2 were selected. Then, the interclass separability provided by the selected band combination was re-evaluated, particularly among non-mangrove categories. Interactive evaluation of separability and accuracy using both separability and confusion matrices were done. Step 4: Efficiency consideration
(a) (b)
(c) (d)
(e) (f)
Figure 2. Venn Diagram of the technique applied in this study
RESULTS AND DISCUSSION
Spectral Signatures
MESSR images
To get a better understanding on spectral behavior and potential discriminator ability, a comparison of spectral signatures among land covers was performed. The spectral signatures of the mangrove category provided by either MESSR or TM data was compared against other land cover categories, i.e., rice field, dry crop land, river, sea, fishpond and settlement. The comparisons were accomplished by graphical evaluation of the MESSR and TM bands as depicted in Figures 3 and 4, respectively.
STEP 2: Accuracy analysis
STEP 3: Comparative analysis STEP 1: Separability analysis
STEP 4:
5
Figure 3. The spectral signatures of the land cover categories in the study site provided by MESSR bands
As described in Figure 3, the reflectance of mangrove category decreases when the wavelength of MESSR bands increases. This condition might be due to sparse condition of mangrove vegetation so that the underlying wet surface predominantly contributes the reflectance of mangrove. Starting from the green band (MESSR band 1[0.51 m-0.59 m]); then the red band (MESSR band 2 [0.61-0.69 m), up to infrared band (MESSR band 3[0.73 m-0.80 m] and 4[0.80 m-1.10 m]), the reflectance of wet surface decreases when the wavelength increases. This coincides with the curve of water reflectance characteristic. According to Richards (1993), the water reflects about 10% or less in the blue-green range, a smaller reflectance in the red and certainly no energy in the infrared range. Within the MESSR 2 (band 2) than other MESSR bands (bands 1, 3 and 4). The DN mean values of each category are well separated. This MESSR2 band is red band suitable for discriminating land covers is related to green biomass and water contents (Jaya and Kobayashi, 1996), i.e., forested/vegetated area, bare land, and swampy and dry cropland.
Digital Number Means of each category
0
TM1(0.51-0.59) TM2 (0.61-0.69) TM3 (0.63-0.69) TM4 (0.76-0.90) TM5 (1.55-1.75) TM7 (2.08-2.35)
D
Figure 4. The spectral signatures of the land cover categories in the study site provided by Thematic Mapper bands
Spectral signature evaluation was also performed on TM data that acquired in 1992. In Figure 4, TM data visually depict good separation between classes, particularly using TM band 3, 4, 5 or 7. As recorded by Landsat TM in 1992, the visual inspection revealed that the mangrove density might increase, so that the reflectance of mangrove vegetation follows the common spectral reflectance curve of vegetation as described by Richards (1993). The mangrove reflectance shall increase when the wavelength increases from TM band 3 (red [0.63-0.69 m]) to TM band 4 (near infrared [0.76-0.90 m], then decreases when moving to middle infrared (TM band 5[1.55-1.75 m] & 7 [2.08-2.35 m]). The similar pattern is also given by rice field category. For dry cropland and settlement categories, from TM 2 to TM 7, the reflectance increase continuously achieving the peak at TM band 5 then decreases when it moving to band 7.
In quantitative classification, particularly when the maximum likelihood decision rule or mahalanobis distance is applied, the classification result depends upon their class signatures, i.e., their means and variances. Although two or more categories show very close DN means, their statistical separations could be influenced by their variance significantly. In this study, statistical evaluation for measuring interclass separation was also performed using the Transformed Divergence separability index. This index considers both means and variances of the categories to be compared. The separation criteria could be found in Jensen (1986); Jaya (1993); and Jaya and Kobayashi (1995).
As described in Table 1, this study shows that better separations are provided by inclusion of MESSR1, MESSR2 plus MESSR3 or MESSR4 in the band combination (1-2-3 or 1-2-4). The MESSR1 is green band, while MESSR(1-2-3 and MESSR4 are within the range of the infrared band. Although single MESSR1 provides relatively clustered DN
Digital Number Means of each category
means than MESSR3 and MESSR4, their contribution is significant on enhancing interclass separation. As shown, the combinations of MESSR bands 2-3 (1998.3) and 1-2-4 (1998.5) give higher TD average (TDavg) than MESSR 1-3-4 (1893.1) and 2-3-4
(1887.5). This study noticed that the MESSR3 and MESSR4 have redundant information, so that inclusion of these two bands together could not improve interclass separation significantly. The band combinations 1-3-4 and 2-3-4 of MESSR band are fail to separate between mangrove and dry cropland significantly as depicted by their TD values less than 1600. i.e., 1477.6 and 1500, respectively.
Thematic Mapper images
Referring to the wavelength of the TM bands, band 1 and band 2 of the MESSR are equal to band 2 (green) and band 3 (red) of the Thematic Mapper (TM), respectively. Meanwhile, bands 3 and 4 of the MESSR are included within the range of TM band 4. As shown by many researches, e.g., Jensen (1986), Richards (1993), Jaya and Kobayashi (1995), and Jaya (2000a) and 2000b), the infrared band shows superior performance as compared to the visible bands for discriminating vegetated and non-vegetated land covers. In this study, the MESSR results were compared with the optimal TM band combination, i.e., TM bands 1-3-4 (blue-red-near infrared) in detecting mangrove vegetation. As shown in Figures 3 and 4, better interclass separations are provided by the infrared band, either near infrared or middle infrared. Using TM bands, better discrimination was provided by TM bands, giving TDavg of 1-3-4 is 1999.9, which is almost excellent. Noting the interclass
separability between mangrove and other land covers, only a little confusion occurred between mangrove and settlement (Table 1).
Land cover discrimination
Table 1. Transformed divergence measures between mangrove and other land cover categories using several combination of MESSR and combination of TM bands 1-3-4.
Remarks: The criteria of the Transformed Divergence measures are as follows (Jaya and Kobayashi,
1995): excellent: TD = 2000; good: TD between 1900 and < 2000; fair: TD between 1700
and <1900; poor: TD between 1600 and <1700; and inseparable: TD < 1600.
Table 2. The Kappa accuracies of MESSR and TM band combinations. MESSR band
All band (1-2-3-4) 96.97 All six reflective bands (1-2-3-4-5-7) 98.05
2-3-4 96.21 1-2-3-4-5 97.38
Remarks: Kappa accuracy values that are connected by line express that those values are not significantly different at 95% confidence level.
When the TM is applied, the combination of band 1-3-4 and 1-2-3-4 gave similar accuracy. Although all six reflective TM bands were used, the interclass separation between mangrove and other categories could not be improved significantly. However, for detecting mangrove vegetation, the combination of band 1-3-4 provides good and excellent interclass separabilities (Table 4) and quite high accuracy (Table 7). Applying more than 3 band could be time consuming and inefficient.