THE PRACTICAL APPLICATION OF
MOLECULAR MARKER TECHNIQUES
IN PLANT BREEDING
•'iV
^yV • IOTHOI*BIOTROP SPECIAL PUBLICATION NO. 62 ISSN 0125-975X
?/# 11
A
llndoBiC^
Published by
SEAMEO BIOTROP
Southeast Asian Regional Centre for Tropical Biology
SI.Raya Tajur Km. 6, P.O.Box. 116 Bogor, Indonesia
PRIMARYGENETIC MAP OPA WIDE PABA BEAN (
Vida
fabaL.) CROSS "GERMANY X MOROCCAN1"
Memen Surahman
Department ofAgronomy, Faculty ofAgriculture, BogorAgricultural University
X Merantl Kampus IPBDarmaga, Bogor16680. Ph/Fax.: 0251-629353.
E-mail: msurahmGplvcosxom
ABSTRACT
This research was conducted at the Molecular Genetic Laboratory of Plant Breeding Department, Georg-August University, Germany, from 1999-2001. The main objective of this research is to develop a genetic linkage map in faba bean (VidafabaL). A Population of F7 recombinant inbred lines (RILs) derived from the cross 34Morocco x Kristall25 was used. The 34Morocco Is a pure line bred from ICARDA, Syria. Krlstall25, developed at Hohenhelm, Germany, Is an inbred line from German cv. Krlstafl. The RIL
population consists of 253 lines. The number of lines analyzed with RAPD
was 57. Those lines were chosen randomly from the whole population of RILS, Mapmaker /Exp. 3.0 was applied to the data. The Haldane function LOD > 3,0 and maximum likelihood distance of 40 cM was used, The 48
selected decamer primers amplified a total of 115polymorphic bandswith an
average of 2.3 polymorphic bands per primer. Fragment sizes ranged from about 550 bp to 2400 bp. The present map comprises a total of 858.3 cM and classified Into14 linkage groups.
Key words: Faba bean, linkage map, RAPD, RIL
INTRODUCTION
Faba bean (VidafabaL), also referred to as broad bean, horse
bean or field bean, occupies nearly 2,3 x 10⁶ ha world-wide (FAO,
2000). The most common use of faba bean Is as human food indeveloping countries (mainly Asia and North Africa), with China the
largest producer with 1.1 x 10⁶ ha planted annually (FAO, 2000).
The origin of Vida fabaL Is still debated (Due, 1997). No wild progenitor has been found, and major differences exist between V. fabaand the most related species that belong to the Narbonensls complex (V. narbonensls, V. gafflea, V. Jphannis, and V hayenlscyamus). Geographically, the origin of Vida faba L is
considered to be the Near East The subspecies V. paudjuga,
presently found from Afghanistan to India, is a primitive form. Earliest findings of major faba beans {Vida faba majbt)in Eastern Iraq date after 1000 A.D. The presence of large seeded types in
Central Europe Is proven only as late the Middle Ages (Hanelt, 1972),
These types expanded in the sixteenth century towards Mexico and
southern America. Small seeded types (Vida
faba minor)
are found
in Ethiopian area and have been favored by North European
agriculture (Due, 1997). Medium seeded types
(Vide faba equina)
have developed throughout Middle East and North Africa with major
concentration in EgyptThe development'of a detailed linkage map for
V. 'faba
will
greatly increase the efficiency ofgenetic and breeding studies in this
important crop. In comparison to other legume spedes, ttie faba
bean
(Vida faba
L) has been the focus of little research in this area.
The attempts of Erith (1930), Sirics (1931) and Plcard (1963) In the
assessment of genetic variation and linkage studies, as well as the
use of translocation stocks In the assignment of different loci to their
respective chromosomes (SjOdln, 1971) are worth mentioning.
Another available tool for assigning genes and linkage groups tospecific chromosomes are primary trisomies. Trisomies of
V, faba
have been obtained from different sources such as polyploids(Poulsen and Martin, 1977), translocation stocks (Schubert
et a/.,
1983) and asynaptic mutants (Gonzales and Martin, 1983). After
successful identification and characterization of five of the six possible
primary Disomies (Martin and Barcelo 1984), crosses between an
asynaptic lineand a normal diploid parent proved to be advantageous
in localizing genes to their respective chromosomes (Cabrera
et at.,
1989; Torres
et ah,
1995). Ontire otherhand, preliminary analysis of
genetic linkage In faba bean Includes the study of morphological traits
(Cabrera and Martin, 1989) andwas followed by the establishment of
linkage maps based on morphological, Isozyme, RFLP and RAPD
markers (Van de Ven
et a/.,
1991). Torres
et al.
(1993) reported,
that when two F2 populations (20 F2 Individuals derived from the cross Vf6 x VT173 and 44 F2 plants from the cross Vf6 x VT35) were
analyzed using Isozyme, RFLP and RAPD, 11 Independently assorting
linkage groups were identified in this population.
Satovic
et al.
(1996) analysed 13 F2 families of faba bean descending from a
trisomic plant They have been analyzed for morphological, Isozyme and RAPD markers. Data were pooled to genetically map partially
overlapping sets of informative genetic markers. The study revealed
a total of 10 linkage groups, six of which have been precisely
assigned to specific chromosomes. The most recent map in faba
bean has been reported by Vaz Patto et al. (1998). Different F2 families of faba bean descending from trisomic plants were analyzed for morphological, isozyme, RAPD markers and seed protein genes. Linkage analysis revealed 14 linkage groups. A composite map was
also developed from these results and those previously reported
(Torres
et al.,
1993; Satovic
etal.,
1996). The numbers of linkage
groups were reduced to 13 with total distance of approximately 1200 cM(VazPatto <**/., 1999).
The expected length of the Vida faba genetic map is 700 -1500 cM (Torreset al., 1993). This 1500 cM number has not yet been reached until now. A complete map is one in which all regions of all chromosomes are covered by markers; and the number of linkage groups is the same as the haploid number of chromosome of the species (Peterson, 1996). Vida fabahas x - 6 chromosomes. So, a fully elaborated linkage map in V. fabaconsists of six linkage groups. The main objectives of this work is to develop a genetic linkage map.
MATERIALS AND METHODS
Plant material
For the construction of a linkage map, a population of recombinant inbred lines (RILs) derived from the cross 34Morocco x
Kristall25 was used. The 34Morocco is a bean pure line BPL228/ILB141 from ICARDA, Syria. Kristall25, developed at Hohenheim, Germany, is an inbred line from the German cuitivar KristalL These parents were chosen because of their large genetic and phenotypic difference (Schillet aL,1997). Further information
about the differences of these two genotypes are presented below.
The F2 plants from the cross 34Morocco x Kristall25and from the cross Krista!!25 x 34Morocco were self-pollinated and advanced to
the F7 generation using single-seed descent. The final population consists of 253 lines including reciprocal lines (114 lines derived from the cross 34Morocco x Kristall25, and 139 lines were from the cross Kristall25 x 34Morocco). All 253 lines were tested in the field. A random sample of 57 lines was characterized based on RAPDs. Seed multiplication was conducted in a cage throughout, that guaranteed that no bees entered the cage i.e., no cross pollination occurred.
Random amplified polymorphic DNA (RAPD)-analysis
DNA was isolated using a modified version of the protocol described in Lassner et al. (1992). The DNA concentration was
determined using a DNA fiuorometer TK0100 (Hoefner). The quality
of DNA was checked by get electrophoresis. DNA quality was judged
by the quality of the visualized band under the ultra violet light RAPD marker analysis was performed essentially as described by Williams etaf. (1990). The amplification was performed in a Perkin Elmer Thermo CyclerType 480 and programmed for 45 cycles. After
denaturation at 94°C for 30 seconds, each cycle consisted of 1
minute at 92dC followed by 1 minute at 35dC and 2 minutesat 72*C,
After 45 cycles the last step completed the amplification at 72dC for 5
minutes. The amplification products were separated by
electrophoresis through 1.8% PeqGoldUniversal agarose gel (Table
6), at 80 volts for 4 hours. Agarose wasdissolved inTAE-buffers. It
was stained for 20 minutes with ethidium bromide (40 m' ethidium bromide in 500 mi distilled water), then washed with tap water for 10 minutes, photographed and scanned under ultra violet light.
Construction of the genetic map
To construct the genetic map, 57 RI F7 lines were chosen randomly from the whole population. Segregation data were analyzed with MAPMAKER/EXP 3.0 computer program (Lander etat.,
1987; Lincolneta/., 1993).
[image:5.375.24.338.227.543.2]RESULTS
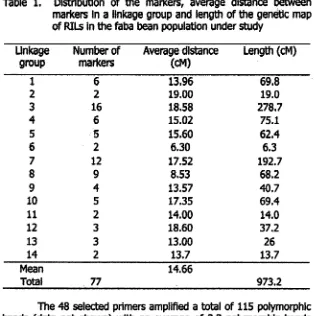
Table 1. Distribution of the markers, average distance between markers in a linkage group and length of the genetic map
of RILs in the faba bean population under study
Linkage Number of Average distance Lengtti(cM)
group markers (CM)
1 6 13.96 69.8
2 2 19.00 19.0
3 16 18.58 278.7
4 6 15.02 75.1
5 5 15.60 62.4
6 2 6.30 6.3
7 12 17.52 192.7
8 9 8.53 68.2
9 4 13.57 40.7
10 5 17.35 69.4
11 2 14.00 14.0
12 3 18.60 37.2
13 3 13.00 26
14 2 13.7 13.7
Mean 14.66
Total 77 973.2
The 48 selected primers amplified a total of 115 polymorphic
bands (data not shown) with an average of 2.3 polymorphic bands
per primer. Fragment sizes ranged from about 550 bp to 2400 bp. With linkage criteria LOD >3.0 and a distance of less than 40 cM, 77 RAPD marker loci were classified into 14 groups (Figure 1). There
were 38 unlinked markers. These markers were omitted from the
analysis as far as the linkage map and QTL is concerned. The
distribution of markers along the genetic map was visualized bythe
cumulative number of markers along the different linkage groups.
As shown in Table 1,the size ofthe 14 linkage groups ranged
from 6.3 cM to 278.7 cM. The total length of map is 973.2 cM. The
largest linkage group contains 16 lod (linkage group 3). The distance
between markers ranges from 1.9 cM to 38.5 cM, with an average of
14.66CM.resiooo AO>!J0O0
Rgure 1:. Primary linkage map of faba bean
(Vida faba)
with 77
•» RAPD-markers. Number to the left of a linkage group
represents map distance In cM calculated with the Haldane
mapping function. All linkages shown have a LOD score of at least 3.0. Designations to the rightare locus names
In the total number of markers observed, 1.6 % were nearly*
mpletely linked (distance less than 2 cM), and 30.1 % showed a
stance less than 10 cM;
49.2 % of the markers were separated
distance 10 to 20 cM, and 19.1 % by distance between 20 to 38
I (Figure 2).
0 2 4 6 8 10 12 14 16 18 20 22 24 26 28 30 32 34 36 38 40
Marker Interval distance (cM)
rgure 2: Frequency distribution distance (cM) between marker pairs
DISCUSSION
A total of 77 markers were found segregating in 57 RI
F7-mple lines (Figure 2). The totel map distance defined among
Iced markers was 973.2 centiMorgan. A comparison of the present >ne«c map with the hitherto published maps shows that its totel igth resembles the map of Vaz Patto et al. (1998) with a map igth of 984,5 cM. However these maps are still small when mpared to the expected size of the Vida fabagenome (1500 cM; iz Pattoeta/., 1998), Besides the total map length, a complete 3p is obtained only when the number of linkage groups corresponds the haploid number of chromosomes. The haploid chromosome imber of the faba bean is six (x = 6), therefore, six linkage groups, stead of the 14 linkage groups detected here, were expected, lese results reflect problems associated with the use of relatively nail populations (here: N = 57).
In view of the relatively large size of the linkage group 3, It ay putatlvely be assigned to chromosome number one of the faba
bean (Figure 3). In the standard karyotype, this chromosome is the longest one ( Torreset al. 1993). It Is a metacentric chromosome and about twice as long as each of the five subtelocentric
chromosomes (Cabrera etal.,1989).
The average distance between markers in the present map is
14.66 cM when all 77 RAPD markers were used. Although the
density of the map was lower than in the faba bean map constructed by Vaz Patto et al. (1989) which has an average distance of 12.95 cM, the map presented here can be considered as sufficiently dense for a QTL analysis. In general, a marker distance of about 20 cM is still adequate to detect QTL (Tanskley et al., 1993). In the present map, there are 12 gaps larger than 20 cM: one on the linkage group 1, three on the linkage group 3, two on the linkage group 5, five on the linkage group 7, and one on the linkage group 9.
Ousters of markers were found throughout the linkage groups. Clustering of markers throughout the linkage groups are in contrast
to the nature of metacentric chromosomes, which have the centromere in the middle of the chromosome. It is expected that a
reduction of recombination frequencies occurs in the vicinity of the centromere (Tankstey et al. 1992). Barcelo and Martin (1990) reported that faba bean has six pairs of chromosomes of which one pair is metacentric carrying the nucleolus organizer region and the remaining five pairs are essentially subtelocentric and of similar length. Since the connection of the detected linkage groups to
chromosomes and chromosome arms is unclear, these present findings cannot be further interpreted.
Ml
(i ho linn
Ti
1H
N Y U
Figure 3: Standard karyoptype of chromosomes of
Vida faba
(Schubert et al.,1986)
CONCLUSION
Asan additional tool for the genetic improvement of faba bean,
an Old World grain legume, a preliminary linkage map of a wide cross
was established.
Regarding the mean value, genotypic standard deviation and
heritabilities (data was not shown), the 57 RI F7-sample lines chosen
at random from the total set of 253 RI F7-lines were obviously wellrepresentative of thisset fhis implies that the 57 RI F7-sample lines
are a priori acceptable as a basis of a primary linkage map for this
cross.
To create a linkage map, RAPD markers were established for this cross and the 57 RI F7-sample lines. A total of 77 markers were assayed segregating In the 57 RI lines and grouped Into 14 linkage groups. The total map distance defined among linked markers was 973.2 centJMorgan. The haploid chromosome number of faba bean Is x = 6, therefore, six linkage groups, instead of the 14 linkage groups presented here, were ultimately expected. The actual result reflects problems associated mostly with the relatively small population (N » 57). This map nevertheless is significantly improving the present
knowledge of the faba bean genetic situation.
The average distance between markers of the recent faba bean map is 14.66 cM Haldane. This map can be considered as sufficiently dense for a QTL analysis.
REFERENCES
Cabrera, A., and A. Martin. 1989. Analysis of genetic linkage In faba bean (Vida fabaL). FABIS Newslett 24:3-5
Cabrera, A., J.I. Cubero, and A. Martin. 1989. Genetic mapping using trisomies in Vida fabaL FABIS Newslett 23:5-7.
Due, G. 1997. Faba bean (Vida faba L). Held Crop Res.
53:99-109.
Erith, A.G. 1930. The inheritance of color, size and form of seeds,
and of flower color in VfdafabaL Genetica 12:477-510.
FAO. 2000. Production Year Book , FAO, Rome. http://www.FAO.
org/statistical databases/agriculture/primary crops.
Gonzalez, JA, and A. Martin. 1983. Development, use and handling
of trisomies In Vldafabal. FABIS Newslett 6:10-11.
Lander, E.S., P. Green, J. Abrahamson, A. Barlow, MJ. Daly, $.E.
Lincoln, and L Newburg. 1987. Mapmaker: An interactive
computer package for constructing primary genetic linkage
maps of experimental and natural populations. Genomics1:174-181.
Lassner, M.W., P. Peterson, J.I. Yoder. 1989. Simultaneous
amplification of multiple DNA fragments by polymerase chain
reaction in the analysis of transgenic plants and their
progeny. Plant Mol. Biol. Rep. 7:116-128.Lincoln, S.E., MJ. Daly, and E.S. Lander. 1993. Constructing genetic
linkage maps with MAPMAKER/EXP version 3.0: A Tutorial and reference manual. Whitehead Institute for Biomedical
Research. USA.
Martin A., and P. Barcelo. 1984. The cytology and morphology of
Vida faba
trisomies. In: G.P. Chapman 8t S.A. Tarawa! (ed.):
Systems for cytogenetic analysis in Vida faba. Martinus Nijhoff/Dr. W. Junk Publisher, the Hague, The Netherlands,p. 63-76.
Paterson, A.H. 1996. The DNA revolution. In: A.H. Paterson (ed):
Genome mapping in plants. Academic Press. R.G. Landes Company. Austin, Texas, U.S.A.Plcard, J. 1963. La coloration des teguments du grain chez la feveroie(Vida fabaL). In: Z. Satovic, A.M. Torres, and J.I. Cubero. 1996. Genetic mapping of new morphological, isozyme and RAPD markers in Vida fabaL. using trisomies. Theor. Appl. Genet 93:1130-1138.
Poulsen, M.H., and A. Martin. 1977. A reproductive tetraplold Vida
fabaL Hereditas 87:123-126.
Satovic, 2., A.M. Torres, and J.I. Cubero. 1996. Genetic mapping of new morphological, isozyme and RAPD markers in Vida faba
L using trisomies. Theor. Appl. Genet 93:1130-1138.
Schill, B., A.E. Melchinger, E. von Wttiitz, and W. Link. 1997.
Zuchterische Brau'chbarkeit von Intrapool-und Interpool
Kreuzungen des mHteleuropSischen und mediterranen Genpools be! der Fababohne (Vida faba L). Vortr.
PflanzenzOchtung 38:127-145.
Schubert, I., Rieger, R., Michaelis, A. 1983. A method for direct production of definite aneuploids of Vida faba L FABIS
Newslett 7:13-18.
Sirks, HJ. 1931. Beitrage zur einer genotypischen Analyse der Ackerbohne. Vida faba L Genetics 13:209-631.
Sjddin, J. 1971. Induced translocation in Vida faba L Hereditas 68:1*34
Torres, A.M., Weeden, N.F., Martin, A.
1993.
Linkage among
isozyme, RFLP and RAPD markers InVida faba. Theor, Appl.Genet. 85:937-945.
Torres, A.M., Satovic, Z., Canovas, X, Cobos, S., and Cubero, XI.
1995, GeneOcs and mapping of new isozyme loci In Vida
fabaL using trisomies. Theor. Appl. Genet 91:783-789. Van de Ven, W.T.G., R. Waugh, N. Duncan, G. Ramsay, N- Dow, and
W. Powe). 1991. Development of genetic linkage map in
Vida faba using molecular and biochemical techniques. Aspects Appl. Bioi. 27:49-54.
Vaz Patto, M.C., A.M. Torres, and XL Cubero. 1998. Genetic
mapping in
Vida faba
L. using trisomies.
3rd European
Conference on Grain Legumes. Valladolid. p.64-65.
Vaz Patto, M.C, A.M. Torres, A. Koblizkova, J. Macas, and XL Cubero. 1999. Development of a genetic composite map of
Vida fabausing F2 populations derived from trisomic plants. Theor. Appl. Genet 98:736-743.
Williams XG.K, A.R.Kubelik, KJ. Uvak, XA. Rafalski, S.V.Tingey.
1990, DNA polymorphisms amplified by arbitrary primers are useful as genetic markers. Nucleic Acids Res. 18 : 6531-6535.