Adaptive Traffic Signal Control for Mixed Traffic
Conditions
Budi Yulianto
*, Sutanto
+ *Department of Civil Engineering
University of Sebelas Maret, Surakarta, Jawa Tengah, Indonesia [email protected]
+
Department of Mathematic
University of Sebelas Maret, Surakarta, Jawa Tengah, Indonesia [email protected]
Abstract
Traffic signal controls are used to regulate the movement of traffic on each leg of the intersection to avoid an accident and vehicle delay. All of signalised intersections in Indonesia is Fixed Time Control (FTC). FTC has a weakness, in which it cannot accommodate high traffic flow fluctuations. This would result in increased vehicle delays. It is necessary for the use of traffic signal control that are responsive to the traffic demands such as Vehicle Actuated Control (VAC) and Self Optimising Control. However, this technology is not suitable for traffic conditions that exist in Indonesia, where the traffic is heterogeneous, untidy and number of motorcycles is very high (50% -80%).
This paper describes the design and evaluation of an adaptive traffic signal controller based on fuzzy logic for an coordinated intersection with specific reference to mixed traffic in developing countries. The Fuzzy Logic traffic Signal Control (FLTSC) is designed to be responsive to real-time traffic demands.
The effectiveness of the proposed FLTSC was examined and analysed by the simulation program VISSIM. The performance of this controller is to be contrasted with the FT on validated simulated coordinated intersection. The simulation results indicate that the performance of the proposed FLTSC is generally better than the FTC in overall road network in terms of delays, travel time and speed.
Key words – Traffic signal control, fuzzy logic, mixed traffic .
I. INTRODUCTION
Traffic signal control is a measure that is commonly used at road intersections to minimise vehicular delays. Traffic signal control at road intersections allows vehicle movements to be controlled by allocating time intervals, during which separate traffic demands from each approach to the intersection can make use of the available road space. There are three traffic signal control types for isolated intersections [1], namely Fixed Time Control (FTC), Vehicle Actuated Control (VAC) and Self Optimising Control. Under FTC, all signal timing parameters are pre-computed and kept constant. These parameters are calculated based on historical traffic data. This method usually shows good results in normal traffic conditions, but sometimes FTC fail to cope with complex, time varying traffic conditions [2, 3, 4 and 5].
VAC represents an improvement over FTC. It has ability to extend the length of green time for a particular stage, based on traffic demand as registered by vehicle actuated detectors
on the intersection approaches. However, this method has a disadvantage in that the extension of green is determined by traffic demand from the stage having right of way, without considering traffic demand from the stages having red [6]. This leads to extending the green stage inefficiently, particularly when there are long queues waiting at red signals. In general, VAC performance deteriorates with heavy traffic conditions [7].
Self Optimising or Adaptive Traffic Signal Control (ATSC) is designed to address those deficiencies. ATSC adjusts the length of green time for a particular stage, based both on traffic demand from the stages having right of way, and having red. The algorithm of the controller is usually developed using a complex conventional mathematical model. A number of approaches have been proposed for the design and implementation of ATS control systems, such as TOL [8] and MOVA [9]. Due to the complexity of finding the optimum signal setting parameters using conventional mathematical models, researchers have applied artificial intelligence techniques to address the problems.
Fuzzy logic is one of the artificial intelligence techniques shown to offer a very promising mathematical approach to modelling traffic and transportation processes which are characterised by subjectivity, uncertainty and imprecision. It was first suggested by Zadeh [10]. The first work on the application of fuzzy logic to traffic signal control was done by Pappis and Mamdani [11]. Since then, fuzzy logic has been used widely to develop an ATSC that is both theoretical and practical, because it is adequate for qualitative modelling of complex systems, which are not easy to solve using conventional mathematic models [3, 12 and 13] and the controller uses the fuzzy rule base (i.e. ‘IF – THEN’ rules), which is easy to develop and modify [14], instead of using complex conventional mathematical models. Research on the application of the fuzzy logic to traffic signal control has generally reported better performance from the Fuzzy Logic Traffic Signal Controller (FLTSC) when compared to the FTC and certain VAC [3, 4, 5, 7, 11, and 13].
traffic signal control such as VAC and ATSC (including FLTSC) has been developed for non-mixed traffic conditions (i.e. in developed countries), considering only motor vehicles in clearly defined lanes, neglecting motorcycles. This is quite different to mixed traffic conditions (i.e. in developing countries), where traffic composition in the roadway is heterogeneous, consisting of different vehicle types with widely varied static, dynamic and operating characteristics, and with a particularly high proportion (30% - 70%) of motorcycles. All types of vehicle share in, and compete together for, the same road space at intersections. This combined flow of all vehicle types generates different vehicular interaction and stream flow behaviour. Due to lack of lane discipline, queues at intersections are based on optimum road space utilization, which means vehicles may occupy any position across the road based on the space available. Figure 1 shows queue is built up during red signal in mixed traffic conditions.
It is obvious that traffic behaviour in mixed traffic conditions is different from that in non-mixed traffic conditions. Hence, there is a need for a new ATSC that can operate at intersections taking account of the mixed traffic in developing countries. The main objective of this research is to develop an ATSC based on fuzzy logic for an intersection, with reference to the mixed traffic in developing countries, including a high proportion of motorcycles. Simulations are used to examine and analyse the effectiveness of the proposed FLTSC. Then, the performance of coordinated intersection under the control of the proposed FLTSC is contrasted to that under FTC. The performance criteria used for comparison are the average delay of vehicles, average travel time of vehicles and average speed of vehicles.
II. OVERVIEWOFTRAFFICSIGNALCONTROL
A. Fixed Time Control
FTC uses a preset cycle and green times to change the signals. The design of a signal timing plan in Indonesia is carried out using techniques set out in the Indonesian Highway Capacity Manual [15]. The equations used to calculate the cycle length and green time were adapted from the Webster [16] model. The cycle length (seconds), according to the Indonesian Highway Capacity Manual (IHCM), is calculated by:
CRIT FR LTI C
¦
1
5 5 . 1
(1)
where
LTI is the lost time per cycle (seconds) FR is ratio of flow to saturation flow (Q/S)
FRCRITn is the maximum value of FR among the signal group for the same stage
6FRCRIT is the summation of FRCRITn for all N stages in the cycle
6 ¦N
n FRCRITn
CRIT FR
1 (2) The green time of nth stage is calculated by:
CRIT FR
n CRIT FR LTI C n g
¦
)
( (3)
B. Fuzzy Logic Traffic Signal Control
Design Criteria
In designing the proposed FLTSC system the following criteria are defined:
x The intersection is three-way or four-way signalised intersection with turning movements on each leg of intersection.
x The signal has two stages.
Structure of the Proposed Fuzzy logic Traffic Signal Control
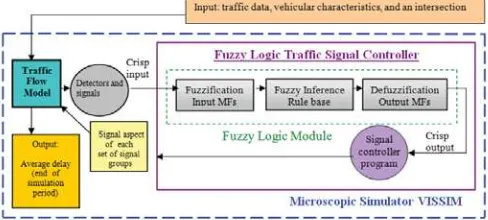
The structure of the proposed FLTSC system is illustrated in Figure 1. During the simulation period, the traffic flow model simulates traffic operation and every second it produces traffic information through vehicle detectors. This information is used as a crisp input for the fuzzy logic module at the end of the cycle. The fuzzy logic module consists of three parts, namely fuzzification, fuzzy inference and defuzzification. The crisp output from the fuzzy logic module is used by the signal controller program to determine the signal status for the following cycle, and returns this information to the traffic flow model. At the end of the simulation period, output values (i.e. measures of performance) will be obtained, namely the average delay of vehicles. This process is carried out in the simulation package VISSIM.
Fig. 1 Structure of the proposed FLTSC and traffic flow modelling
As an adaptive traffic signal controller, the proposed FLTSC needs vehicular detectors to provide accurate information of the prevailing traffic conditions in real time. This information is used as input data for the controller. In this research, advanced video image processing (VIP) was used to collect traffic parameters.
give meaningful information about actual traffic flow. Factors which influence the data selected include the setting of the signal group, (i.e. red or green) and the placement of the detection area (17). The proposed FLTSC uses two input fuzzy variables as follows:
1. Maximum Queue Length (metres). Queue length is defined as the distance in metres from the stop line over which vehicles are queueing (18). During the red period, the VIP records the longest tail of queue (i.e. maximum queue length) irrespective of the lane in which it occurs, every second. Then the maximum queue length at the onset of green periods is used as an input.
2. Average Occupancy Rate (%). The detection area is placed one metre downstream of the stop line of each approach, to record occupancy rate. During the green period, the VIP records the occupancy rate every second and the average occupancy rate for that period is used as an input.
The output fuzzy variable of the proposed FLTSC is Weight. Weight (a value between 0 and 100) is an indicator of the degree of need that the signal group (SG) requires green.
Fuzzy Control Strategy
Figure 2 shows the process of calculation of new green time values for the next cycle, using traffic data from the previous cycle. The proposed FLTSC uses traffic information about maximum queue lengths and average occupancy rates collected during the previous cycle, in order to estimate the number of seconds of green time required by each set of signal groups (stage) during the next cycle. This control strategy is designed for signal control with two stages.
Fig. 2 Calculation of new green time value for the next cycle using traffic data from the previous cycle
The fuzzy logic module uses the input fuzzy variables maximum queue length and average occupancy rate collected during the previous cycle, to derive weight value of each SG using the fuzzy rule base. Then weight values of stage 1 (W1) and stage 2 (W2) are used to calculate the green time in a cycle. The weight values of stages are used to estimate the duration of green time that stages require in the next cycle. The green time of each stage is calculated using conventional calculation.
The green time of each stage is calculated by using Equations 4 and 5, depends on the weight value.
For case: the weight value < 90:
5
For case: the weight value > 90:
5
Min1 and Max1 are minimum and maximum weight value, namely 0 and 200 respectively
Med1 is medium weight value
Min2 and Max2 are minimum and maximum green time value in a cycle
Med2 is medium green time value in a cycle
i is stage index
Fuzzification and Membership Functions
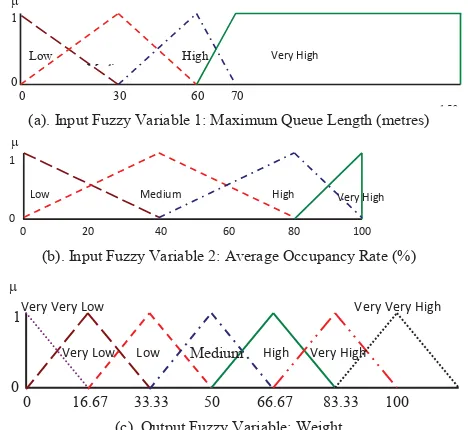
In this research, the triangular and trapezoidal types of membership function are used because of their computational simplicity and efficiency. The number of fuzzy partitions for the input and output linguistic variables is determined by a common sense, trial and error method [19, 20]. Membership functions of each input and output fuzzy variable of the proposed FLTSC are as follows: Maximum Queue Length and Average Occupancy Rate have {Low, Medium, High and Very High} and Weight has {Very Very Low, Very Low, Low, Medium, High, Very High and Very Very High} linguistic labels, respectively. The graphical representation of the membership functions of these linguistic variables is shown in Figure 3.
(a). Input Fuzzy Variable 1: Maximum Queue Length (metres)
Very High
(b). Input Fuzzy Variable 2: Average Occupancy Rate (%)
16.67 33.33 50 66.67 83.33 100
(c). Output Fuzzy Variable: Weight
The configuration of these membership functions is done according to expert observation of the system; the membership functions are tuned by studying the performance of the controller under various traffic conditions, to improve the performance of the controller [7 and 17].
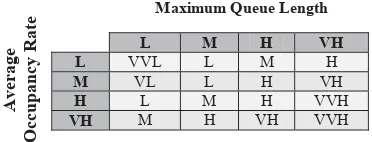
Fuzzy Rule Base
The basic function of the fuzzy rule base is to represent expert knowledge in a form of If-Then rule structure. The fuzzy rule base is a set of fuzzy rules. It maps the combination of fuzzy inputs to the fuzzy output. The number of rules is equal to the number of input combinations derived from the number of membership functions per input [21]. The proposed FLTSC has two inputs, each having four membership functions; so the number of fuzzy rules will equal sixteen.
In this research, the fuzzy rule base was adjusted based on the trial and error method [11]. Using trial and error, it has been found that the input fuzzy variable maximum queue length is more sensitive to the performance of the controller than the average occupancy rate. Therefore, the fuzzy rule base was designed to give more priority to the input fuzzy variable maximum queue length. The configuration of the fuzzy rules in the matrix structure of the proposed FLTSC is shown in Figure 4.
Fig. 4 Fuzzy rule base in matrix structure to derive a weight value for each signal group
Fuzzy Inference Engine and Defuzzification
Fuzzy inference evaluates the control rules stored in the fuzzy rule base. The fuzzy inference system used in this research is the Mamdani and Assilian [22] method, because of its computational simplicity and efficiency.
Defuzzification is a process to convert the fuzzy output values of a fuzzy inference to crisp output values. According to Driankov et al [22], the Centre-of-Sum (CoS) defuzzification method gives better performance in term of continuity, disambiguity, plausibility, computer complexity and weight counting. In this research, therefore, the CoS method was used to defuzzify the fuzzy output variable weight.
III.SIMULATIONSTUDIES A. Case Study
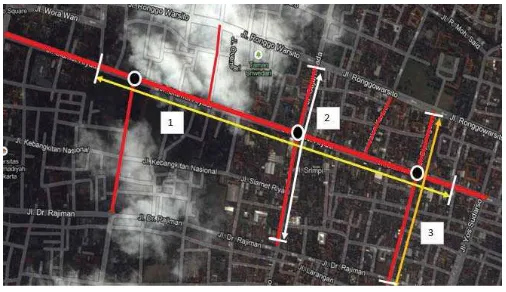
In this research, the evaluation of intersections and road network performance is done on three consecutive intersections along Slamet Riyadi street, namely a. Sriwedari Intersection, b. Ngapeman Intersection and c. Pasar Pon
Intersection. Figure 5 and 6 shows the road network and geometric intersections under studies. Traffic flow used is based on real data on those three intersections during peak hour. Traffic composition and traffic volume on the road network are presented in Tables 1 and 2.
Fig. 5 Coordinated Intersections
Fig. 6 Geometric of Intersections
Table 1 Traffic composition (%) used in the simulation
Vehicle Type Motorcycle Light Vehicle Heavy Vehicle Bus Percentage 73,9% 24,9% 0,8% 0,4%
L M H VH
L VVL L M H
M VL L H VH
H L M H VVH
VH M H VH VVH
Maximum Queue Length
A
v
er
age
O
cc
u
p
an
cy R
Table 2 Traffic volume (vehicles) used in the simulation
Intersection West (in)
South (in)
South (out)
North (in)
North (out) Sriwedari 5107 1894 1493 - - Ngapeman 5583 - 2792 2667 694
Pasar Pon 4737 2267 - - 1719
The measure of performance used for the comparison are: • Average delay of vehicles (second) that occur at
intersection,
• Average travel time of vehicles (second) that occur at section and
• Average delay (seconds), total travel time (hours) and the average speed (km/h) that occur on the road network.
B. Parameter Controllers
In the case of the FTC, signal timing remains fixed during the simulation time. The signal timing for the FTC was calculated using the IHCM method. The cycle time and green time were calculated using the Equations 1 and 3, respectively. Table 3 shows signal timing used for the FTC.
Table 3 Cycle time and green time used for the FTC
Intersection
Green Time
(Seconds) Amber All Red
Cycle Time Stage 1 Stage
2
(Seconds) (Seconds) (Seconds)
A.Sriwedari 22 18 3 2 48
B.Ngapeman 45 27 3 2 82
C.Pasar Pon 40 32 3 2 82
In the proposed FLTSC, minimum and maximum values of total green time in a cycle are imposed to avoid extremely long and short cycle length. These values determine the upper and lower limits of the cycle length. The minimum and maximum values of total green time in a cycle for the proposed FLTSC are 10 seconds and 62 seconds, respectively. For all controllers, the amber and all red periods are the same. Amber and all red periods are 3 seconds and 1 second respectively.
C. Simulation Results
Identical simulations are run for approximately one-hour periods on the FTC and proposed FLTSC to produce the output value i.e. delay and travel time of vehicles. The output value of the proposed FLTSC is then compared with the FTC. Comparison of the average delay of vehicles at intersections between the FTC and proposed FLTSC can be seen in Table 4.
Table 4. Average delay of vehicles
Intersection FTC (Second)
FLTSC
(Second) Improvement
Sriwedari 28.4 27.3 4.0%
Ngapeman 50.7 50.1 1.3%
Pasar Pon 36.3 23.6 35.0%
The simulation results show that the average delay is better with the proposed FLTSC than the FTC, in all intersections. The proposed FLTSC produces an improvement of 1.3-35% in the average delay against the FTC.
Figure 7 shows the travel time sections for the evaluation. Comparison of the average travel time at sections between the FTC and proposed FLTSC can be seen in Tables 5. The proposed FLTSC produces an improvement of 0.4-25.5% in the average travel time against the FTC.
Fig. 7 Travel time sections
Table 5. Average travel time of vehicles
Section FTC (Second)
FLTSC
(Second) Improvement
Section 1 225.0 224.1 0.4%
Section 2 185.5 138.4 25.4%
Section 3 96.8 93.0 3.9%
Table 6 shows the comparison of the average delay, average speed and total travel time of the entire road network between the FTC and proposed FLTSC. Simulation results show that by using the FLTSC, the average delay and travel time overall road network decreased by -20.3% and -6.5% consecutively, compared to that the FTC. By using the FLTSC, the average speed increased by 7.3% compared to that the FTC.
Table 6. Road Network Performance
Measure of Performance FTC FLTSC Improvement
Average delay (sec) 74.4 89.4 -20.3%
Total Travel Time (sec) 678.4 722.2 -6.5%
Average Speed (km/hr) 26.0 24.1 7.3%
The performance of the FLTSC is affected by the geometric of the intersection. The simulation results show that the proposed FLTSC improvement on Sriwedari and Ngapeman intersection is minimal compared to that on the Pasar Pon intersection. This can be explained that the number of lane on minor road of Sriwedari and Ngapeman intersection has two lanes while Pasar Pon intersection has three lanes. Therefore the number of vehicles discharged during the effective green time (saturation flow) on minor road of Sriwedari and Ngapeman intersections lower than Pasar Pon Intersection. As consequence more queue vehicles and delay occur on minor road of Sriwedari and Ngapeman intersections than Pasar Pon Intersection.
IV.CONCLUSIONS
This research is a pioneering effort in applying fuzzy logic to an ATSC for coordinated intersections suitable for mixed traffic in developing countries, including a high proportion of motorcycles. Video image processing is used to capture maximum queue length (in meters) and average occupancy rate (in %) from each approach of the intersection as an input data for the proposed FLTSC. The proposed FLTSC uses input data collected during the previous cycle, in order to estimate the length of green time required by each stage during the next cycle. This enables the framework signal plan to be adapted on a cycle-by-cycle basis.
The effectiveness of the FTC and proposed FLTSC are analysed using VISSIM model. The simulation results indicate that the performance of the proposed FLTSC is generally better than the FTC in terms of average delay and travel time.
Saturation flow value is very important traffic parameter to inform the traffic density. To improve the effectiveness of the proposed FLTSC, therefore, this parameter need to be included as an input data of the controller.
REFERENCES
[1] Strobel, H, Computer Controlled Urban Transport, Ed. John Wiley, 1982. [2] Kell, J.H. and Fullerton, I.J., Manual of traffic signal design – Chapter 7:
Detectors. Institute of Transportation Engineers, Prentice Hall, Englewood Cliffs, New Jersey, 1991.
[3] Lee, J.H., Lee, K.M. and Leekwang, H., Fuzzy controller for intersection group. International IEEE/IAS Conference on Industrial Automation and Control, Taipei, Taiwan, 1994, pp. 376-382.
[4] Trabia, M.B. and Kaseko, M.S., A fuzzy logic controller for a traffic signal. IASTED International Conference on Applications of Control and Robotics, Orlando, Florida, January 1996, pp. 117-122
[5] Kim, J., A fuzzy logic control simulator for adaptive traffic management, IEEE International Conference on Fuzzy Systems, vol. 3, 1997, pp. 1519-1524.
[6] Bell, M.G.H., Future directions in traffic signal control. Transportation Research Part A, Vol. 26A, No. 4, 1992, pp. 303-313.
[7] Trabia, M.B., Kaseko, M.S. and Ande, M., A two-stage fuzzy logic for traffic signals. Transportation Research Part C, Vol. 7, No. 7, 1999, pp. 353-367.
[8] Bång, K.L., Optimal control of isolated traffic signals. Traffic Engineering and Control, Vol. 17, No. 7, July, 1976, pp. 288-292. [9] Vincent, R.A. and Young, C.P., Self-optimising traffic signal control
using microprocessors – the TRRL MOVA strategy for isolated intersections. Traffic Engineering and Control, Vol. 27, No. 7, 1986, pp. 385-387.
[10]Zadeh, L.A., Fuzzy sets. Information and Control, Vol. 8, 1965, pp. 338-353.
[11]Pappis, C.P. and Mamdani, E.H., A fuzzy controller for a traffic junction. IEEE Transactions on Systems, Man, and Cybernetics, Vol. SMC-7, No. 10, 1977, pp. 707-717.
[12]Kou, K.Y., A fuzzy model of change and clearance intervals at a signalised intersection. PhD Thesis, The University of Texas at Arlington, USA, 1995.
[13]Niittymaki, J. and Pursula, M., Signal control using fuzzy logic. Fuzzy Sets and System, 116, 2000, pp. 11-22.
[14]Sayers, T.M., Anderson, J. and Clement, S., The multi-objective optimisation of a traffic control system. Abbreviated Presentation Sessions of the 14th International Symposium on Transportation and Traffic Theory. Jerusalem, Israel, 20-23 July 1999, pp. 153-176.
[15]Indonesian Highway Capacity Manual, Directorate General Bina Marga Indonesia, 1997.
[16]Webster, F., Traffic signal settings. Road Research Tehnical Paper No. 39, London, 1958.
[17]Sayers, T.M., Bell, M.G.H., Meiden, T. and Busch, F., Traffic responsive signal control using fuzzy logic – a practical modular approach. Proceedings EUFIT 1996, Aachen, Germany, September 2-4, 1996, pp. 2159-2163.
[18]Sutomo, H., Appropriate saturation flow at traffic signals in Javanese cities: a modelling approach. PhD Thesis, Institute for Transport Studies, University of Leeds, UK, 1992.
[19]Lee, C.C., Fuzzy logic in control systems: fuzzy logic controller – Part I. IEEE Transactions on Systems, Man, and Cybernetics, Vol. 20, No. 2, March/April, 1990, pp. 404-418.
[20]Kim, S., Applications of petri networks and fuzzy logic to advanced traffic management systems. PhD Thesis, Polytechnic University, USA, 1994.
[21]Driankov, D., Hellendoorn, H. and Reinfrank, M., An introduction to fuzzy logic. Second Edition, Springer-Verlag Berlin Heidelberg, 1996. [22]Mamdani, E.H. and Assilian, S., An experiment in linguistic synthesis