THE INFLUENCE OF FINANCIAL RATIOS TOWARD INITIAL PUBLIC OFFERING IN BANKING SECTOR WHICH LISTED IN INDONESIA STOCK
EXCHANGE 2006-2009
Proposed by: Faw zia Am elia 107081103371
Int ernat ional Undergraduat e Program Syarif Hidayat ullah St at e Islamic Universit y Jakart a
i
9. E-mail : [email protected]
II.
EDUCATIONAL BACKGROUND1. TK Manaratul Ulum 1993-1995
2. SDN Kramat Pela 01 1995-1999
3. SDN Sirnabaya III 1999-2001
4. SMPN 1 Karawang 2001-2004
5. SMAN 5 Karawang 2004-2007
6. Undergraduate Universiti Utara Malaysia (BIBM) 2009-2011
7. Strata 1 UIN Syarif Hidayatullah Jakarta (Management) 2007-2011
III.
ORGANIZATIONAL BACKGROUND1. Member of Indonesian Student Committee in UUM
ii
Abstrak
Rasio keuangan dapat digunakan sebagai perubahan pendapatan, pendapatan masa depan, kegagalan perusahaan, evaluasi dan harga penawaran. Objeksi dari penelitian ini adalah ingin identifikasi pengaruh dari rasio keuangan terhadap harga penawaran perdana saham yang terdaftar di Bursa Efek Indonesia.
Sampel di penelitian ini adalah perusahaan yang terdaftar di pasar modal. Sampel adalah perusahaan yang bergerak di perbankan. Sampel diambil berdasarkan tanggal terdaftar mereka tahun 2006-2009. Di skala tahun ini terdapat 10 perusahaan.
Hasil dari penelitian ini menemukan bahwa rasio keuangan berpengaruh lemah terhadap harga perdana saham di perbankan.
iii
Abstract
Financial ratios can be used as earning change prediction, future earning, company failure or bankruptcy, performance evaluation and offering price. The objective of this research wants to identify the influence of financial ratio to offering price of stock that listed in Indonesia Stock Exchange.
Sample in this research are companies those listed their stock in capital market. Sample are companies those run in banking sector. Samples are taken based on their listed date from 2006-2009. In this scale year, listed banking are 10 companies.
The result of this research found that financial ratio influenced weakly the offering price of stocks for all sample in banking sector.
iv
PREFACE
Assalamualaikum, wr.wb
Firstly thanks to Allah SWT because of His blessing the writer can finished this proposal.
Shalawat and Salam also give to the guidance prophet Muhammad SAW also to his best
friends.
In this chance, writer wants to say thanks for supporting and helping from every party to
writer in finishing this proposal. So, thankful would be for:
Writer’s family, Father, Mother, Sister and my big family who always support me, pray
me, and inspired me, also be my big motivation for writer herself, so can make the writer
in high spirit to finish this thesis.
Mr. Indoyama Nasaruddin, SE, MAB, first guidance who already gives me so much
suggestion, opinion, and helps me in doing this thesis.
Mr. Arief Mufraini, Lc, M.Si the head og International Program and as my second
guidance who already kindly helping me in doing the thesis, gives me so many supports
and suggestion.
Prof Dr . Abdul Hamid, MS as a Dean of Economic and Business Faculty.
All Lecturer who already give their knowledge for me and I can’t mention their name by
name, wish Allah replying your all kindness.
All the staffs of Faculty of Economic and Business, thanks for helping, simplicity, and all
v Alditya Aris Rinandy, for so much helping and supporting.
My friends in Islamic State University for the togetherness and friendships.
My internship friends in Bank Muamalat Indonesia Icha, Lucky and Lia who already
support me in finishing this thesis while I’m doing internship there.
My friends in Universiti Utara Malaysia who already given me support and shoulder to
cry on.
My dual degree friends Ariningtyas, Pramayassya, Weldan, Dewi, and Fitra as a struggle
friends in UUM.
With the humbleness, this thesis is still far from the perfection because of the limited
ability and knowledge that the writer has. Thus, writer wish for suggests and critics also
responses from all parties toward the better thesis and can be useful for everyone else who read
it. In the end, writer wishes that this thesis can be useful for reader and parties who need it.
Jakarta, 6 June 2011
vi
CHAPTER 1 INTRODUCTION A. Background ... 1
B. Research Problem ... 3
C. Research Quest ion ... 5
D. Research Object ive ... 5
E. Populat ion and Research Sam ple ... 6
CHAPTER 2 THEORITICAL FRAM EW ORK A. Lit erat ure Review ... 8
CHAPTER III RESEARCH M ETHODOLOGY A. Dat a Collect ion M et hod ... 50
vii
C. Variable Definit ion and M easurem ent of Operat ional ... 51
D. Populat ion and Sam ple ... 52
E. Dat a Collect ion Techniques ... 53
F. Classic Assum pt ion ... 54
G. Hypot hesis Test ... 57
CHAPTER IV ANALYSIS AND FINDING A. General Descript ion of Research Object ... 62
B. Descript ive St at ist ic ... 64
C. Pre- Analysis (Classic Assum pt ion) ... 80
D. Hypot hesis Test ... 85
E. Int erpret at ion ... 91
CHAPTER V CONCLUSION A. Conclusion ... 93
B. Recom m endat ion ... 93
C. Im plicat ion ... 94
D. Lim it at ion ... 94
REFERENCES ... 95
viii LIST OF TABLES
No. Description
3.1 D Test Durbin W atson : decision rule ... 56
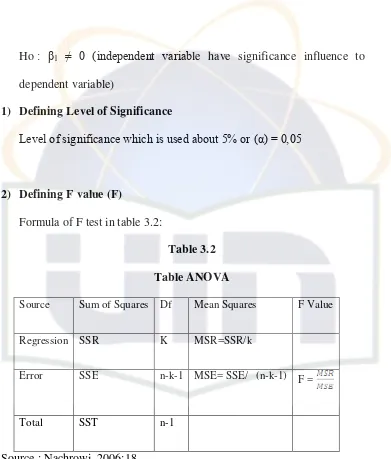
3.2 Table Annova ... 59
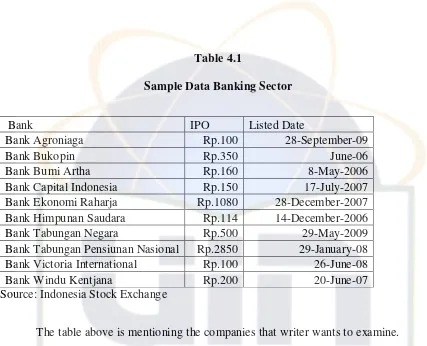
4.1 Sample Data Banking Sector ... 65
4.2 M odel Summary of Durbin W atson ... 82
4.3 M odel Summary of F test ... 84
4.4 M odel Summary of T Test... 85
ix LIST OF FIGURES
No. Description
2.1 Interaction of Company and Financial M arket ... 12
2.2 Theoretical Framew ork ... 46
2.3 IPO M odel ... 47
4.1 CFCL Data ... 68
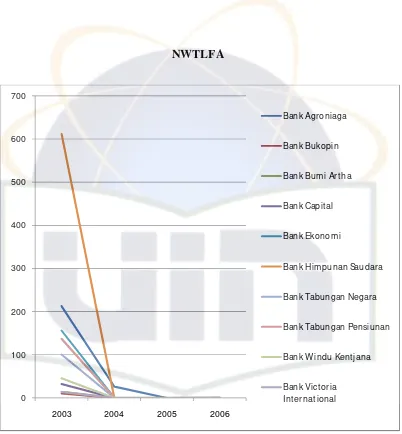
4.2 NW TLFA Data ... 70
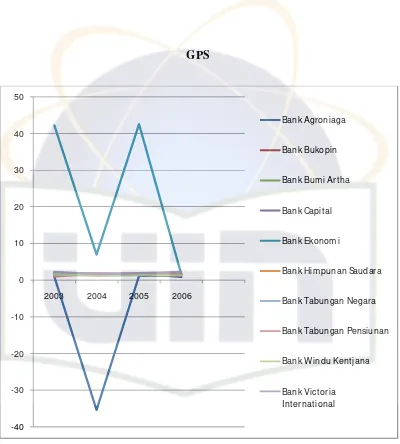
4.3 GPS Data ... 72
4.4 NIS Data ... 74
4.5 OITL Data ... 76
4.6 NW S Data ... 78
4.7 NITL Data ... 79
4.8 NINW Data ... 80
4.9 NW TL Data ... 81
1 CHAPTER I
INTRODUCTION
A. Background
Capital Market is a place to look for liquid money to increase
business activity so can produce much more profit. Fresh money that exists
in capital market is come from society who is called as investor. Investor
doing some kind of analysis technique to determine where the investment
place have higher chance to produce profit and have less risk will faced by
higher demand of investors to invest in the company. In order we can get
fund from stock market, emittent has to fulfill the requirement which is
applied by stock market. The most important requirement for demand the
fund from stock market is emittent has to provide their financial report
which is describing its financial position. What it means by financial report
is it’s balance sheet.
Financial report is financial information notes of a company to an
accounting period of time which can be used to describe affectivity of
company performance. Financial report is part of financial reporting
process. Complete financial report consist of balance sheet, statement in
changes in equity.
Elements that related directly to financial position measurements
2
performance measurement in balance sheet is income statement. Financial
report is usually reflecting to the elements of balance sheet and profit loss
statement.
Profit can be considered to be differentiate between the purchase
price and the cost of bringing to market whatever it is that is accounted as
an enterprise (whether by harvest, extraction, manufacture or purchase) in
terms of the component cost of delivering goods and or service and other
operating or other expenses.
Financial report define as information about financial position in a
period of time which beneficial for take any economic decision, also
management responsibilities for managing economic source which applied
by owner to the company. In the base of financial report, users in this case
investor can predict the situation of your financial company currently and
future. In order to predict the present financial situation and for future can
be used some variables. One of them is financial ratio.
From some of the researches one of them is Marian Vorek (2009),
he said that financial ratio can be used to predict financial position
currently and future. Thus, this research take variables which same as the
earlier research that is financial ratio, but those financial ratios used to
predict the first stock price that offered in initial public offering. Based on
the explanation, writer was attract to research how the influence of
3
banking sector those listed in Jakarta Stock Exchange. Thus, title of this
research is “THE INFLUENCE OF FINANCIAL RATIOS TOWARD
INITIAL PUBLIC OFFERING IN BANKING SECTOR WHICH LISTED IN INDONESIA STOCK EXCHANGE 2006-2009”
B. Research Problem
As the background stated above, we want to know the relationship
between financial ratios to IPO of banking industry.
Mas’ud Machfoedz (1994:114) classifying financial ratio in 9 group of financial ratio which are :
1. Short term liquidity:
It consists of Cash to Current Liabilities, Cash Flow to Current
Liabilities, Quick Asset, Current Asset
2. Long term solvency
It consists of Current Asset to Total Liabilities, Net Worth and Long
Term Debt to Fixed Assets, Net Worth to Fixed Assets.
3. Profitability
It consists of Operating Income to Net Income Before Taxes, Earnings
Before Taxed to Sales, Gross Profit to Sales, Operating Income to
4
4. Productivity
Inventory to working capital, cost of goods sold to inventory, sales to
quick assets, sales to cash, sales to account receivable, cash flow to
total asset, current asset to total asset, quick asset to inventory,
inventory to sales, sales to total asset, working capital to total asset
5. Indebtedness
It consists of Total liabilities to current asset, operating income to total
liabilities, current liabilities to total asset,
6. Investment intensiveness
It consists of Cash flow to total Liabilities, Sales to Fixed Assets,
Working Capital to Asset, Current Assets to Sales, Quick Asset to
Total Asset, Net Worth to Sales, Working Capital to Sales, Inventory to
Total Assets, Cash Flow to Sales.
7. Leverage
It consists of Net Worth to Total Assets, Current Liabilities to
5
8. Return on investment
It consists of Earning before taxes to net worth, net income to fixed
assets, net income to net worth, earning before income taxes to total
assets, Net Income to Total Assets
9. Equity
It consists of Sales to Current Liabilities, Net Income to Total
Liabilities, Current Liabilities to Net Worth, Net Worth to Total
Liabilities.
That can be counted be 49 financial ratios. From 49 ratios can be
used as 9 ratios to predict the future profit changes of a company. From
that 9 ratios, there is a significant in a significance level 5% which consists
from profitability ratio group that are Gross Profit to Sales, Income to
Sales, Income to Sales and Net Income to Net Worth. The research result
also found out that financial ratio can predict future profit for one period of
time.
C. Research Question
In attempting to achieve the objectives above, this study seeks to
address the following research question what does the influences of
financial information to the initial public offering for banking industry in
6 D. Research Objective
This research is aimed to know the influence of financial ratios
partially and simultaneously (x) toward the initial public offering in
banking industry in Indonesia Stock Exchange.
1. Usage of Research
Usages of this research are:
a. Academic
Theoretically it can be used as knowledge development and
expand the references about influence of financial ratios to
initial public offering in Stock Exchange Jakarta.
b. Investor
Whish this research can give any suggestion to investor,
co-investor and companies about factors that can be influence the
initial public offering.
c. Writer
This research is a media to applied knowledge that has been
gotthen from, thus writer would know the difference and
7 d. Stock Exchange
Wish this research can give any advice to stock exchange as a
transaction place about factors which influence initial public
8 CHAPTER II
THEORITICAL FRAMEWORK
A. Literature Review
1. Bank:
According to (duhaime :2011) definition of bank is a corporation
empowered to deal with cash, domestic and foreign, and to receive the
deposits of money and to loan those monies to third-parties.
Bank definition authentically has been arranged in law of banking
1967. Which means that bank is financial institution that the main business
is giving credit and services in financial traffic and money spreading.
Rachmadi Usman (2003:59).
2. Financial
Financial management is concerned with the maintenance and
creation of economic value or wealth. This focuses on decision making
with an eye toward creating wealth. As such, we will deal with financial
decision such as when to introduce a new product, when to invest in new
assets, when to replace existing assets. When to borrow from banks, when
to issue stocks or bonds, when to extend credit to a customer, and how
9
In learning finance, well managed company in financial side can be
used for fulfill goal of the firm such as profit maximization and
maximization for shareholder wealth.
In companies, finance division is kind of important division
because it is measuring whether the company has health financial or not. It
can be measured by providing financial statement such as net income,
balance sheet, and cash flow.
Companies can raise fund through several ways and one of them is
by financial market.
3. Financial Market
Financial Market the place where financial assets are
exchanged. Although the existence of a financial market is not
necessary condition for the creation and exchange of a financial asset,
in most economies financial assets are created and subsequently traded
in some type of organized financial market structure (Fabozzi, J Frank
& Franco Modigliani : 2009)
They also considered that financial market can be classified in
10
a. First is according financial claim. The claims are traded in a
financial market may be either for a fixed dollar amount or a
residual amount.
b. Second way is according to the maturity of the claims. Financial
market for the short term financial assets called money market,
and the one for longer maturity financial assets is called the
capital market. The traditional cut off between short term and
long term is one year. A financial asset with a maturity of more
than one year is part of the capital market. Thus, the debt
market can be divided into debt instruments that are part of the
capital market, and those that are part of the capital market,
depending on the number years to maturity.
c. Third way to classify financial market is by whether the
financial claims are newly issued. The market for newly issued
financial asset is called the primary market. After a certain
period of time, the financial is bought and sold (i.e., exchanged
or traded) among investors. The market where this activities
takes place is referred to as the secondary market.
According to Roberto G. Medina(1988) Capital Market is that
portion of the financial market which deals with longer term loanable
funds, the money market in contrast deals with short term funds. The
11
time. Money market deal with short term fund which is for a year the
maturity date and capital market deal with long term maturity date
which is more than a year.
There, in financial market where the traded place for all
financial claims (securities). Financial claims could be divided into:
a. Financial Asset is claims for future payment by one economic unit
on another (Arthur J. keown : 2009). Financial asset serves
economic functions which is transfer funds from those parties who
have surplus funds to invest to those who needs funds to invest in
intangible assets. (Fabozzi, J Frank & Franco Modigliani : 2009)
b. Real Assets is tangible assets such as houses, equipment, and
inventories. ( Arthur J. keown : 2009).
One of company goal is raising fund and it can be done through
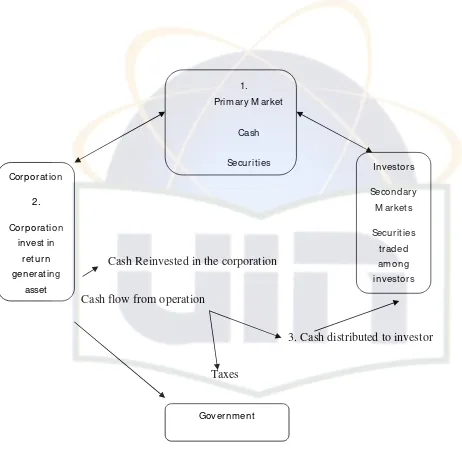
financial market. Let us take a look the flow of capital through the financial
12
Cash Reinvested in the corporation
Cash flow from operation
3. Cash distributed to investor
Taxes
Figure 2.1 : Interaction of corporation and financial market
Figure above is explaining about relationship among government,
individuals, and corporation. Initially corporation raising funds in the
financial markets by selling securities. Corporation receives cash in return
for securities-stocks and debt. Corporation then invests this cash in
return-generating assets new projects for example and the cash flow from this
13
assets is then either reinvested in the corporation; given back to the
investors in the form of dividens or interest payments, or used to
repurchase stock, which cause the stock price to raise; or given to the
government in the form of tax payments. (Arthur J. Keown : 2009)
Table above, we can see the financial market elements just like
primary market and secondary market. A primary market is a market in
which new, as opposed to previously issued, securities are traded. Once
the newly issued stocks in the public’s hands. It then begin the trading
in the secondary market. Arthur J. Keown (2009:11). In primary
market, there is the trading of initial public offering begin.
4. Initial Public Offering (IPO)
Primary market which is the primary trading of claims, initial public offering of company also happen there.
According to Achleitner (2002 ; .242) Initial Public Offering (IPO)
means initial placing of enterprise’s shares on an organized capital
market.
According from Richard P. Kleeburg (2005) said that initial
public offering is the process many business owners go through in the
hope of becoming extremely wealthy. The IPO marks the beginning of
14
change the structure of the business, once the decision is made to sell
stock to the public.
It must be ascertained if an IPO is really the best strategy of the
company. In deciding whether going public is the right thing to do,
managers must weigh the benefits against and drawbacks. The most
appealing benefits and opportunities are these:
Enhanced financial condition
Increase in shareholder value
Diversification of current shareholders portfolios
Additional capital to perpetuate growth
Higher market value for the company
Improved opportunities for future financing
Greater potential for mergers and acquisition
Enhanced corporate image and increased employee
Stock exchange listing
While the drawbacks are:
Loss of company control
Sharing the company’s success
Loss of control over information
15 Extensive periodic reporting and accountability
Initial and continuing expense
Limits on major shareholder
New fiduciary responsibilities
Stocks are first issued to investors through what is known as the
primary or new issues market.
In Initial Public Offering (2005:30) According to (Alon Brav :1999)
Typically, companies are founded by one or few entrepreneurs and initially
held by a small number of investors. At some point the company decides to
raise capital by offering shares to the general public. This is known as an
initial public offering (IPO). The company may decide to raise more capital
through selling shares in the future. These subsequent offerings are called
seasoned equity offerings (SEO). IPOs and SEOs together form the equity
primary market. In most cases companies enlist the help of an investment
bank for conducting these offerings. The bank handles the distribution of
shares to investors. Sometimes they also provide companies with a
guarantee to sell a certain number of shares in exchange for a fee. Investors
purchase stocks for their returns. These returns come in the form of:
capital gains - the appreciation in value over time, and 3 dividends - most
companies pay periodic dividends. Investors will be reluctant to purchase a
16
stocks. This allows them to realize capital gains and to obtain liquidity
independently of the payout policy of the company. Provision of a resale
mechanism is the function of the stock exchange (also known as the
secondary market). Investors are able to buy and sell stocks through the
stock exchange. Investors trade between themselves on these exchanges.
The company is not a party to the transaction and receives no funds as a
result of these transactions. Conversely, investors can liquidate their
investments for consumption purchases without forcing the company to
liquidate investments. This feature of a secondary market is crucial for
economic development: companies can plan their investment policies
independently of the consumption patterns of their investors.
In Initial Public Offering (2005:29) a study of 1,526 IPOs from
1984-1995 performed by Charles J. Kaplan (1997) found that from opening
to close of the first trading day, IPOs produced an average return of 16.4
%. Kaplan also found that for three years after the IPO, for over 80% of the
stocks, the valuation underperformed market expectations. He concludes,
in fact, that on average an investor would have been ended up with only 83
cents compared to a dollar invested in the similar non IPO firms.
There is no formula or universal rule to determine whether a
company is sufficiently large, mature, or profitable to go public, but a
review of recent successful offerings illuminates some useful
17 a. Size
Underwriters have their own rules of thumb, based primarily on
revenue and net earnings, for what constitutes adequate company
size to support a public offering. Today, however, size is often
measured in terms of market capitalization or float.
If a company appears to lack the sales volume or the earnings to
support a successful public offering, there are other avenues to
explore. Management might look for another company in the same
industry that also is too small for an IPO. The result could be an
amalgamated company whose combined assets, earnings, and
management make a public offering feasible.
b. Growth
Underwriters and investors look for a consistent record of high
growth as well as demonstrated potential for continuing that growth
in the future. That means growth of 15 to 25 percent per year for the
next several years. Unless a company has that kind of momentum
going when it goes public, investor will turn to more promising
opportunities and offering may fizzle. An innovative product,
significant market share, or proven potential in a new market that is
part of an emerging industry all contribute to the company’s real
18 c. Profitability
Many companies that have successful IPOs have a track record of
stable revenue and earnings. In exceptional cases where companies
have excellent earnings trends lines, investors may trade off
prospects for exceptional growth and price appreciation for lower
risk and reliable dividend stream.
There are no hard-and-fast rules. Each company must evaluate its
present circumstances and its prospects, bearing in mind that few
elements in overall picture will impress the investor as much as
momentum. Nevertheless, every year, start-up companies in
“glamour” or “hot” industries go public. Many of these companies
have never posted a profit. Some have never even reported
revenues.
Although a positive trend line is optimal, it certainly is not always
necessary. Even mature companies with aberrations in their
earnings trends have successfully executed their IPO strategies,
particularly if the aberration was caused by some unusual, one-time,
or nonrecurring change that is unlikely to affect future operating
result. In the final analysis, the critical success factor is not
short-term earnings but the ability to sustain financial performance over
19 d. Management Capabilities
Underwriters and investors carefully consider size, growth, and
profitability in evaluating a company but weaknesses in any of
these areas will not necessarily preclude a public offering. The issue
on which underwriters and investors are most reluctant to
compromise is management strength. Strong management thus
translates into the most important intangible element in any IPO
investor confidence.
Senior executives must be painfully honest in analyzing whather
they can comfortably adjust to public scrutiny of their actions on
behalf of the company. Are they ready to cope with the inevitable
loss of freedom and privacy? Are they ready to admit outsiders to
the decision-making process? Do they have the leadership
capability to grow as the company grows?
Go Public is a public offering to sell the stock in stock
exchange, company has to fulfill these requirement:
a. Financial report has to be corrected by Public Accountant that has
been listed in Bapepam and get fair opinion without exception for
the last annual year
20
c. Compulsory to listing all stocks that has been fully stored, as long as
not contradict with provision about stock belonging presentation by
foreign investor.
d. Company has been established and operated minimal for 3 years
e. In the late two years, company get operating income and net income.
f. Has total wealth minimum 20 billion rupiah, own capital Rp 7.5
billion and stored capital minimum Rp 2 billion
g. Commissioner and directors of the company has to be in good
reputation
5. Financial Reporting
The prospectus for the company’s IPO generally include
audited financial statements for the previous three years, although that
requirement is reduced in certain circumstances, such as for small
business issuers under Regulation S-B. It also may require selected
financial information for the previous five years. These disclosure
requirements apply only for years the company has been existence.
(Kleburg P. Richard: 2005)
A company will not be allowed go public if its financial
statements have not been audited. Sometimes, two- or three-year audits
can be performed in anticipation of a public offering but these may
cause unforeseen delays and turn up unexpected adjustments to
21
Public companies are subject to certain SEC disclosure
requirements, such as specified data by industry segment. To prepare
for these disclosures, the company should fine-tune its financial
reporting system to provide the necessary data, which should in any
case be reviewed by the auditor. Many internal reporting system
already provide industry segment data in some form, but the method
they use may not correspond to the one prescribed by the SEC or by
Statement No. 14, “Segment Reporting” issued by the Financial
Accounting Standards Board (FASB). By making the necessary
changes in accounting practices early, the company can avoid the
inconvenience of having to implement then when they will distract
from the IPO, or, worse, having to delay the offering
A company also can run into problems if in the two three years
preceding a public offering, it acquires a significant business that saw
not previously audited. Because the financial statements of unaudited
subsidiaries affect the consolidated financial statements, and also
because of the SEC requirement of separate audited financial
statements for significant acquired companies, a company that makes
such an acquisition may not be able to go public until the needed audits
done. Any company that is planning a public offering of securities in
the next two or three years will want to keep SEC audit requirements in
22
Many private companies have annual audits even if they are not
otherwise required. This puts them in a position to go public on the
short notice. An audit improves the credibility and reliability of the
company’s financial statements and will help in dealings with external
lenders and suppliers and improve internal management.
Another benefit is that an independent auditor who is
knowledge-able about the business may come up with creative
solutions to the business needs of the company. These ideas, whether
communicated in personal meeting or in management letters, can lead
to cost-effective ways to improve internal controls. Effective and
timely internal financial reporting and a good system of internal
controls may be crucial for public companies but they are also highly
important for a private company.
In addition to their professional and advisory services, the
auditors will help determine whether the accounting practices used are
appropriate for a public company. Sometimes, SEC interpretations of
GAAP may necessitate a change in accounting practices and
disclosures by a company about to go public. Alternatively, companies
may desire to conform their accounting policies to those more
commonly used by other public companies in their industry and thereby
to enchance the value of the IPO. By making the necessary changes
23
public. Such changes may also have tax implications that need to be
taken into account.
Once the company is publicly held, the SEC sets limits in the
sale of “restricted” stock, generally shares issued in private placements
and shares held by controlling shareholders. Existing shareholders may
sell any portion of their holdings without technical restriction as part of
the IPO the only “restriction” then is a practical concern that the
offering not be perceived as a bailout of existing shareholders.
However, if one of the goals of the public offering is to make shares of
controlling shareholders salable in aftermarket advance planning can
reduce the impact of these SEC restriction (Hensler, Rutherford and
Springer, 1997) put in initial public offering by Richard P. Kleeburg
(2005: 35)
Initial public offering pricing fixed based on agreement between
emittent company with underwriter. Important role of underwriter is
fixed the public offering price. For considering stock price fairness,
underwriter have to pay attention how big the basic of company power,
how much the demand of stocks that will be offered and how big the
power and weaknesses of market today. Underwriter have to set the fair
price for issuers and also attracted for investor (Dalton, 1993) put in
24
There are two things that need to get issuers attention in doing
public offering for the stocks, which is when the offering will be did
and in what price the stocks will be offered. Both factors determine the
succeed of issuers get the fund in capital market which signed with
selling all offered stocks (Shahaluddin Haikal, 1996)
Settlement of company stock price is a point that determine in
get the fund from stock public offering in initial market which is known
as (Initial Public Offering). In this step, company hasn’t have guidance
about beneficial capital market price for issuer or investor. Stock value
have to refer to the real company value and monetary value which
wished will be got from IPO based company capitalization. To
determine stock value, emission guarantor do earlier scoring which
usually compared with similar company emission which listed in stock
exchange. Rating will be done with deeper analysis of financing
projection of issuer candidate.
Stock price settlement in prospectus in huge amount that have
to paid by investor in stock offering time with using offering buying
form through appointed bank. Settled stock price in offering period is
the real amount that has to be paid by investor. If there is a differentiate
of stock price with the highest limit settled in offering, so there will be
25
Determination of initial price is a the most difficult matter for
issuer and issuer guarantor. If the price is too high, so the stocks wont
be fully sold out, otherwise if the price is too low, the share holder face
the possibility of loss.
Determination of initial stock price hasn’t done through supply
and demand mechanism which proceed through auction opening in
stock exchange, but done together between emission guarantor and
issuer trough negotiation process. Initial stock price valuation
theoretically can be measured with using these analyses:
a. Income approach
Stock intrinsic approach determined based on payback period from
stock infestation which determined using fairness ratio from capital
market and earnings per share which known with Price to Earnings
Ratio (PER), with this formulation:
PER: stock price: earning per share
In this appraisal model first issuer determine the wanted PER and
next multiply with EPS projection at that year.
b. Net Tangible Assets Approach (NTA)
In this approach, the value of stock determined by net asset
company divided of issuing shares. Net that recognized by listed
company in financial report or company balance sheet. NTA can be
26
total of liability divided the issuing stocks. Explanation of
intangible asset is capital asset that has no physical appearance and
the value dependant to the right in their holder.
For doing analytic and choosing stock there are two
approaching which are, Fundamental Approaching and Technical
Approaching.
a. Analytic Approaching
Technical analytic is a study about action market supported
by certain graphic. This analytic is made by seeing market
price, market fluctuation, also estimation with using pattern that
made by graphic and or mathematic calculating about past price
movement can be predict for the future price (Ahmad Rodoni,
2008:62).
b. Fundamental Approaching
This approaching is analytic which done toward that
company which related with prospectus and ability to get
profit which including three analytic steps, which are (1)
macro economy (2) industry and (3) company (Ahmad
Rodoni, 2008:70).
Fundamental analytic trying to estimate future stock
27
1) Estimating value of fundamental factors which
influencing future stock price.
2) Applied those variable relationship so get the
estimation stock price.
This model often called as share price forecasting model,
and often used in Securitas analytic (Suad Husnan, 2008:307).
Initial stock price settlement not merely measured by
calculation of fundamental data of a company and also considering
ability of capital market when general offering. Nonetheless initial
stock price settlement has to be encouraged with calculation of
issuer financial fundamental data.
Fundamental Factor :
a. Company Characteristic
According (Ahmad Rodoni, 2008:70) said that this analytic
aimed to see company situation for company aspect like company
financial condition, marketing condition, production and marketing.
1) Return on Assets (ROA). This ratio is used to measure
asset efficiencies that used by company to produce
profit. This ratio is calculated with dividing available net
28
2) Asset Turn Over (ATO). This ratio is used to show the
efficiency level of und using which restrained in asset.
This ratio is calculated with comparing between net
sales with company total asset.
3) Price to Earning Ratio (PER). This ratio is used to show
how big the investor gets per rupiah from reported
profit. This ratio is calculated with comparing between
stock price to earnings per share.
4) Market to book ratio (MBR). This ratio give indication
about how investor appreciate stocks of a company. This
ratio comparing between earning per share to book value
per share.
5) Price to Sales Ratio (PSR). This ratio is used to showing
how big investors want to pay per rupiah from reported
selling. This ratio comparing between market value of
total shares to selling.
b. Industry
This analytic is more specific and aim to see the relation of
industry to company, like the development of competitor.
Industry standard and market growth (Ahmad Rodoni, 2008:70)
Besides, there are some ratios which is publicized in
29
additional information in financial report: price to Earning Ratio
(PER), Price to Book Value (PBV), Dividend Payout, Dividend
yield, Current Ratio, Debt to Equity Ratio, Leverage Ratio, Gross
Profit Margin, operating Profit Margin, Net Profit Margin,
Inventory Turnover, Total Assets Turnover, Return on Investment
and Return on Equity.
According Sunariyah (1997; 85-100) for analyze stock price and infestation in stock can be used 2 approaching, which are
traditional approaching and modern port folio management.
Traditional approaching consist of 2 approaching which are
technical and fundamental approaching (this approaching is same as
one that explained by Suad Husnan). Modern portfolio approaching
pushed in exchange psychology aspect with hypothesis assumption
about exchange which is market efficient hypothesis. Efficient
market means that stock prices reflecting whole information in
exchange. This approaching needs accurate analysis, therefore
needs framework. Framework is an analysis step that has to be done
systematically which consists of 3 analysis steps which are:
a. Economic analysis
Economic analysis aiming to know the kind also business
30
company profit. If economic growth of a country is low,
generally achieved profit of a company also low. In economic
analysis many variables has macro characteristic like: national
income, monetary policy and fiscal, interest rate and etc.
b. Industry Analysis
In Industry analysis we have to know the strengths and
weaknesses of relevant economy. Adequate knowledge about
industry dynamic from relevant company will help analyst or
investor in doing industry analysis. The referred of company
analysis is group of homogenous company.
c. Company analysis (issuer)
The proposed company analysis to knowing the company
performance. Investor needs relevant information about company as
a basic invest decision. That information include external and
internal information of a company, which are information about
financial period in a certain period. Besides, solvency can be
analyzed, profitability and liquidity of a company. Other important
information is expected information about financial projection or
forecasting. Reminds that information necessity based on
consideration that stock price determined by past company
31 6. Financial Ratios
According to Chunhui Liu and Grace O’Farrell (2009;5) Ratio analysis is an integral part of the analysis of financial statements, which
is a critical step before makin g any foreign investment (Reuvid & Li,
2000), because it quantifies a company’s performance in many aspects
such as the company’s ability to make a profit (profitability), ability to
pay off debts due within a year (liquidity), ability to pay off debts due
after a year (solvency or stability), and the ability to manage financial
resources (activity or efficiency).
According to Mas’ud Machfoedz (1994;12) there are nine financial
ratios those can be used to predict future profit significantly.
Those nine ratios are:
a. Cash flow to current liabilities
Is a measurement of a company’s ability to cover current
liabilities. A value of one would indicate the company can cover its
current liabilities with cash flow and as a “rule of thumb” a value of
one over desired. If the operation cash flow to current liabilities
ratio keeps increasing, it may indicate the cash inflows are
increasing and needs to be invested. The operation of cash flow to
32
analysis spreadsheets highlighted in the left column which provide
formulas, calculation, charts and explanation of each ratio.
The formula is:
CCFL = × 100 %
b. Net Worth and Total Liabilities to fixed assets (NWTLFA)
In business, net worth (sometimes called net assets) is the
total assets minus total outside liabilities of an individual or a
company. For a company this is called shareholders preference and
maybe referred to as book value. Net worth is stated as at a
particular year in time. In the case of an individual, the term estate
is used in relation to decease individuals in probate. For businesses,
the term is used in the context of fraudulent law and on the
dissolution of the company. In personal finance, net worth (or
wealth) refers to an individual’s net economic position; similarly, it
uses the value of all assets (long term assets) minus the value of all
liabilities
NWTLFA = × 100 %
c. Gross Profit to Sales (GPS)
In accounting, gross profit or sales profit is the difference
33
service , before deducting overhead, payroll, taxation and interest
payment. This ratio shows the portion of profit which get from the
selling effort. Bigger the ratio, so the profit would be higher from
the sold effort.
GPS = × 100 %
d. Net Income to Sales (NIS)
This ratio shows the portion of net profit which get from
company’s sells. Higher the ratio is, bigger the net profit which got
from the sales.
NIS = × 100 %
e. Operating Income to Total Liabilities (OITL)
This ratio shows profit portion of a company to the total
liability. Higher the ratio is, the profit that comes from main
business company to the liability also higher.
OITL = × 100
f. Net Worth to Sales (NWS)
This ratio shows profit portion of their self capital for the sales
that happen in a company. Higher the ratio is, higher the net worth
to company sales.
34 g. Net Income to Total Liabilities (NITL)
This ratio shows the net profit portion to the total liabilities.
Higher the ratio is, higher the net profit that get from company total
liabilities.
NITL = × 100%
h. Net Income to Net Worth (NINW)
The ratio shows the net income portion to the net worth. Higher
the ratio is, the expectation of owner to get profit also higher.
NINW = × 100 %
i. Net Worth to Total Liabilities (NWTL)
This ratio shows the portion of company owner importance to
total liabilities of third parties. Higher the ratio is, the portion of net
worth could be higher.
NWTL = × 100%
Financial ratios have some usefulness in predicting the company situation.
Which are:
a. Comparison Performance
Financial ratio can be used as in two different but equally
useful ways. You can use them to examine the current
35
time, from the prior quarter to years ago. Frequently, this can
help you to identify problems that need fixing. Even better, it
can direct your attention to potential problems that can be
avoided. In addition, you can use these ratios to compare the
performance of your company against that of your competitors
or other members of your industries (ziosbank 1999:5).
b. Risk and Return Investment
As financial ratios are used extensively in the corporate
financial reports, it is now a common understanding that if
corporate financial reporting is to be adequately supportive of
investment decision making, then clearly it must provide
information useful to the information of risk and return
investment (farelly, et al.,1985) taken from Richard P. Kleeburg
(2005:25).
In Richard P. Kleeburg (2005:12) there is a statement
from (Ritter (1991), and Loughran and Ritter (1995)said that
firms conducting initial and seasoned equity offerings have
historically experienced relatively low long-run equity returns.
Additionally, these returns covary with firm characteristics such
as size and book-to-market (Brav and Gompers (1997) and
36
phenomena have been offered. The first is predicated on
rational investor behavior and argues that the low average
returns are commensurate with the issuing firms’ risk
characteristics, as captured, for example, by size and
book-to-market. The second argues that firms are able to time their
equity offerings and raise capital by selling overvalued equity.
Thus, the poor long-term performance of the equity issues
reflects the gradual correction of asset prices to their true
fundamental value and any correlation with firm characteristics
is more indicative of security mispricing, as opposed to
additional dimensions of systematic risk.
Firms conducting initial and seasoned equity offerings
have historically experienced relatively low long-run equity
returns. To date, there is lack of consensus as to whether low
average returns are due to mispricing or that these returns
rationally reflect the risk characteristics of the issuing firms. By
examining how institutional lenders perceive the risk of issuing
and non-issuing firms we are able to shed new light on this
issue. We have examined how institutional lenders perceive the
risk of equity-issuing firms relative to non-issuing firms by
focusing on the pricing and contract structure of loans to these
37
otherwise similar non-issuing firms face comparable yields on
their loans, even after adjusting for default risk and accounting
for potential endogeneity between the various components of
the loan contract. (Alon Brav : 2006)
c. Earning Change
In Mujeeb-u-Rehman-Bhayo (2011:2) there is a statement
from Jordan et al. (2009) and Ou and Penmen (1989) found that
a larger proportion of the variation in E/P ratios among
companies is explained by traditional financial statement ratios.
Published financial statements are a principal source of
firm-specific information concerning the result of a firm‟s
wealth creating activities (i.e., sales, production, investment and
financing activities). These financial statements present
extensive and low-cost information that assists external
monitoring by outside stakeholders such as shareholders and
banks, and provide a foundation for various contractual
arrangements such as private lending agreements and
employment contracts.
d. Future Earning
The stock price and the earnings per share determine the
value of the ratio. P/E increases when investors are willing to
38
P/E also grows when both the stock price and the earnings per
share increase, however, the increase of stock price must be
sharper than the increase in the earnings per share. Another
scenario of increasing P/E take place, when stock price remain
stable despite there is a decrease in the earnings per share. The
price earnings ratio does not change when there is a balance
between the growth of the stock price and the earnings per
share. (Marian Vorek :2009)
e. Company Failure or Bankruptcy
Bankrupt firms has indicated their worse financial
position for a considerable time before they actually went
bankrupt It is widely believed that profitability and liquidity
ratios can predict bankruptcy to a certain extent I also proved
that the Japanese bankrupt firms had indicated their worse
financial position for a considerable time before they actually
went bankrupt (Cindy Yoshiko Shirata: 1998)
"Failure" is defined as the inability of a firm to pay its
financial obligations as they mature. Operationally, a firm is
said to have failed when any of the following events have
occurred: bankruptcy, bond default, an overdrawn bank
39
A "financial ratio" is a quotient of two numbers, where both
numbers consist of financial statement items. A third term,
predictive ability, also requires explanation but cannot be
defined briefly. The emphasis upon financial ratios does not
imply that ratios are the only predictors of failure. The primary
concern is not with predictors of failure per se but rather with
financial ratios as predictors of important events-one of which is
failure of the firm. Further, the primary concern is not with the
ratios as a form of presenting financial-statement data but rather
with the underlying predictive ability of the financial statements
themselves. The ultimate motivation is to provide an empirical
verification of the usefulness (i.e., the predictive ability) of
accounting data (i.e., financial statements) (William H. Beaver :
1966)
The next task was to identify those firms in Moody's that
had failed during the time period being studied (1954 to 1964,
inclusive). In the front of Moody's there appears a list of
firms-firms on whom Moody's has formerly reported but no longer
does so. There are many reasons why a firm; may be
dropped-name change, merger, liquidation, lack of public interest, and,
most importantly, failure. The list of several thousand names
40
Supplementing this basic list was a list of bankrupt firms
provided by Dun and Brad- street. The final list of failed firms
contained 79 firms on which financial- statement data could be
obtained for the first year before failure (William H. Beaver :
1966)
f. Offering Price
Once we control for IPO fundamentals (such as, income,
sales, book equity, growth opportunities, insider retention, and
investment banker prestige) and allow for different valuation of
these fundamentals across different time-periods,average
valuations of IPOs in the recent boom and crash periods were
not statistically different from those of the late 1980s. A naïve
interpretation of this result would be that valuations of the IPOs
in the late nineties were not excessive compared to the late
eighties. We would caution against such an interpretation, since
we find that fundamentals, especially income and sales, were
valued quite differently in the late nineties.
7. Previous Research
Liquidities ratioattempts to measure a company’s ability to pay off
its short term liabilities the better as it is a clear signal that a company can
pay its debt that are coming due in the near future and fund still in its
41
should rise a red flag for investor as it may be a sign that a company will
have difficulty meeting in running its operations, as well as meeting its
obligations.(investopedia 2010;2)
Lubika Lesakova (2007;3) management wants to increase its ROE,
and we have presented three important levers of financial performance:
profit margin, asset turn over, and financial leverage. We concluded that
whether company is a big one or small one, careful management of these
levers is a challenging managerial task, involving an understanding of the
nature of the company’s business and the interdependencies among the
levers.
Lubika Lesakova (2007;3) thought ratio analysis can provide useful
information concerning a company’s operations and financial condition, it
has some limitations. Potential problem are listed below:
a. Many large firms operate a number of different activities in quite
different industries, and in such cases it is difficult to develop a
meaningful set of industry averages for comparative purposes. This
tend to make ratio analysis more useful for small, narrowly-focused
firms than for large, multidivisional firms.
b. Most firms want to be better than average (although half will be above
42
necessarily good. As a target for high level performance, it is preferable
to look at the industry leaders ratio.
c. Inflation can badly distort firms balance sheet –recorded values are
often substantially
An initial public offering (IPO), referred to simply as an “offering” or
flotation”, is when a company (called the issuer) issues common stock or
shares to the public for the first time. They are often issued by smaller,
younger companies seeking capital to expand, but can also be done by large
privately owned companies looking to become publicly traded
(Wikipedia:2010).
Current profitability and cash flow realizations provide information
about the firm’s ability to generate funds internally. Given the poor historical
earning performance of value firms, any firm currently generating positive
cash flow or profits is demonstrating capacity to generate funds through
operating activities. Relationship between earning and cash flow levels is also
considered, earnings driven by positive accrual adjustment is a bad signal
about future profitability and returns. (Sloan:1996)
Sanjai Bhagat and Srinivangans Rangan (2001:8) there are statement
from Kim and Ritter (1999), hereafter KR, investigate the relation between
43
sample of 190 IPOs completed in the years 1992-1993. KR document that
firm-level and industry-level PE ratios are positively related, but that the
adjusted R2 of their regression is only five percent. Their model’s explanatory
power improves when they consider forecast earnings for the next year instead
of pre-IPO historical earnings. They conclude that industry comparables based
on historical accounting information are of limited value for understanding
IPO pricing.
In Sanjai Bhagat and Srinivangans Rangan (2001:9) there are statement
from Beatty, Riffe, and Thompson (2000), hereafter BRT, question KR’s
conclusion regarding the low relevance of historical accounting information in
the pricing of IPOs. Because KR use only industry multiples in their
regression, their model captures only time and industry variation in pricing
relations and thus does not speak to the value relevance of firm-specific
accounting information. Using a sample of 2,577 IPOs with positive pre-IPO
income and positive book value of equity from the years 1987-1998, they
document that the explanatory power of earnings, book value, and revenues for
offer value is about fourteen percent. Also, they find that when all the variables
in their model are deflated by book value of equity or sales or when all
variables are log-transformed, the model’s explanatory power ranges from
sixty percent to ninety percent.
In Sanjai Bhagat and Srinivangans Rangan (2003:10) there is a
44
years 1997-1999 whose pre-income book value of equity is positive and
income before non-recurring items is negative. Using a logarithmic
specification, he finds that IPO valuation (based on offer price and first-day
closing price) is positively and linearly related to the pre-income book value of
equity, but negatively and concavely related to income before non-recurring
items. Consistent with the argument that large R&D and marketing costs are
intangible assets and not period expenses, he documents that offer values are
increasing and concave in R&D and marketing costs. Further, IPO values are
unrelated to sales and cost of goods sold expenses.
In Sanjai Bhagat and Srinivangans Rangan (2003:8) there are statement
from Bartov, Mohanram, and Seethamraju (2002), hereafter BMS, focus on the
valuation of 98 internet IPOs and 98 offer-date and size-matched non-internet
IPOs that were completed during 1996-1999. Their conclusions are based on
per share regressions. For internet IPOs, they find that cash flows, sales, and
sales growth are significantly related to offer prices (at the filing date and at
the offer date). In contrast, earnings, book value of equity, and R&D per share
do not bear a significant relation to offer prices. 7 When they consider first-day
closing prices, they find that, with the exception of sales growth and R&D per
share, investors do not value the financial statement variables reported by
internet firms.
In Wan Nordin Wan Husen journal (2006:4) there is study from
45
countries, higher cash flow rights attached to the largest controlling
shareholders are associated with a higher market valuation, measured by the
market-to-book ratio of assets. In contrast, higher control rights are associated
with a lower valuation. Furthermore, a large wedge between cash flow rights
and control rights leads to value losses.7 In sum, the results suggest that (1)
there is a positive incentive effect associated with high cash flow rights in the
hands of the controlling shareholders and (2) the risk of expropriation is
particularly severe when the discrepancy between cash flow rights and control
rights is high. When the sample is segmented based on the types of ultimate
owner (family-controlled, statecontrolled, widely held financial institution or
widely held corporation), the results on expropriation are found to be strongest
for family owned companies, moderate for state–controlled companies and
46
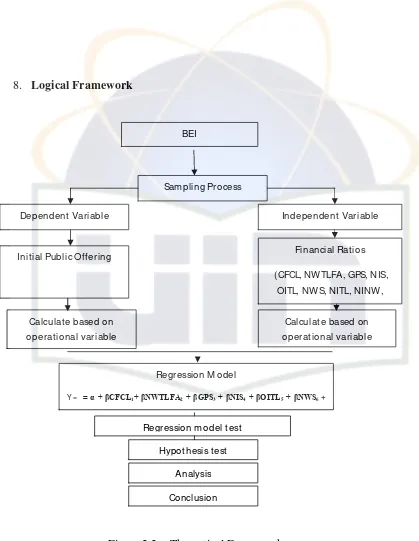
8. Logical Framework
Figure 2.2 : Theoretical Framework
Sam pling Process
Dependent Variable Independent Variable
Init ial Public Offering Financial Rat ios (CFCL, NWTLFA, GPS, NIS,
OITL, NWS, NITL, NINW, NWTL)
Calculat e based on operat ional variable
Calculat e based on operat ional variable
Regression M odel
Y = = α + βCFCL1+ βNWTLFA2+ βGPS3+ βNIS4+ βOITL5+ βNWS6 +
Regression m odel t est Hypot hesis t est
Analysis Conclusion
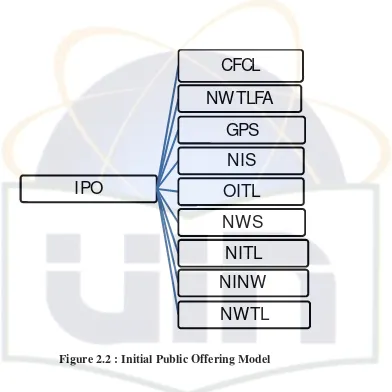
47 Figure 2.2 : Initial Public Offering Model
IPO
CFCL
NWTLFA
GPS
NIS
OITL
NWS
NITL
NINW
48 9. Hypothesis
Hypothesis have been developed for this study based on dependent and
independent variables are given below:
H1: Cash Flow to Current Liabilities has an influence toward Initial
Public Offering
H0 : Cash Flow to Current Liabilities doesn’t have an influence
toward Initial Public Offering
H2: Net Worth and Total Liabilities to fixed Asset has an influence
toward Initial Public Offering
H0 : Net Worth and Total Liabilities to fixed Asset doesn’t have an
influence toward Initial Public Offering
H3: Gross Profit to Sales has an influence toward Initial Public
Offering
H0 : Gross Profit to Sales doesn’t hav an influence toward Initial
Public Offering
H4: Net Income to Sales has an influence toward Initial Public
Offering
H0 : Net Income to Sales doesn’t have an influence toward Initial
49
H5: Operating Income to Total Liabilities has an influence toward
Initial Public Offering
H0 : Operating Income to Total Liabilities doesn’t have an influence
toward Initial Public Offering
H6: Net Worth to Sales has an influence toward Initial Public
Offering
H0 : Net Worth to Sales doesn’t have an influence toward Initial
Public Offering
H7: Net Income to total Liabilities has an influence toward Initial
Public Offering
H0 : Net Income to total Liabilities doesn’t have an influence
toward Initial Public Offering
H8: Net Income to Net Worth has an influence toward Initial Public
Offering
H0 : Net Income to Net Worth doesn’t have an influence toward
Initial Public Offering
H9: Net Worth to Total Liabilities has an influence toward Initial
Public Offering
H0 : Net Worth to Total Liabilities doesn’t have an influence toward
50 CHAPTER III
METHODOLOGY
A. Data Collection Method
A type of data used is secondary data. Data is used in this study
were obtained from financial report those gotten from Indonesia Stock
Exchange.
B. Research Scope
This research is quantitative data used are secondary data. The
sample used was data from the initial public offering (Y), and financial
ratios (X) with sub variables are Cash Flow to Current Liabilities (X1) ,
Net Worth and Total Liabilities to Fixed Assets (X2), Gross Profit to Sales
(X3), Net Income to Sales (X4), Operating Income to Total Liabilities
(X5), Net Worth to Sales (X6), Net Income to Total Liabilities (X7), Net
Income to Net Worth (X8) and Net Worth to Total Liabilities (X9).
In this research will be used ratio that was used by previous
research (Mas’ud Machfoedz) which 9 ratios where the ratios have
significant influence to predict company future profit. Those ratios are
Total Go Public company that listed in Stock exchange Jakarta are 422