REAL TIME INFRA-RED TOMOGRAPHY FOR PIPELINE FLOW MEASUREMENT
DANIAL BIN R. AZMI
This report is submitted in partial fulfilment of the requirements for the award of Bachelor of Electronic Engineering (Industrial Electronics)
With Honours
Faculty of Electronic and Computer Engineering University Teknikal Malaysia Melaka
ii
UNIVERSTI TEKNIKAL MALAYSIA MELAKA
FAKULTI KEJURUTERAAN ELEKTRONIK DAN KEJURUTERAAN KOMPUTER
BORANG PENGESAHAN STATUS LAPORAN
PROJEK SARJANA MUDA II
Tajuk Projek : REAL TIME INFRA-RED TOMOGRAPHY FOR PIPELINE FLOW MEASUREMENT
Sesi Pengajian : 11/12
Saya DANIAL BIN R. AZMI
mengaku membenarkan Laporan Projek Sarjana Muda ini disimpan di Perpustakaan dengan syarat-syarat kegunaan seperti berikut:
1. Laporan adalah hakmilik Universiti Teknikal Malaysia Melaka.
2. Perpustakaan dibenarkan membuat salinan untuk tujuan pengajian sahaja.
3. Perpustakaan dibenarkan membuat salinan laporan ini sebagai bahan pertukaran antara institusi pengajian tinggi.
4. Sila tandakan ( √ ) :
SULIT*
(Mengandungi maklumat yang berdarjah keselamatan atau kepentingan Malaysia seperti yang termaktub di dalam AKTA RAHSIA RASMI 1972)
TERHAD* (Mengandungi maklumat terhad yang telah ditentukan oleh organisasi/badan di mana penyelidikan dijalankan)
TIDAK TERHAD
Disahkan oleh:
__________________________ ___________________________________
(TANDATANGAN PENULIS) (COP DAN TANDATANGAN PENYELIA)
Alamat Tetap: No 5 Fasa 1D3 Bdr Baru Sri Manjung
32040 Manjung,
Perak Darul Ridzuan
iii
“I hereby declare that this report is the result of my own work except for quotes as cited in the references.”
Signature : ………...
Author : DANIAL BIN R. AZMI
iv
“I hereby declare that I have read this report and in my opinion this report is sufficient in terms of the scope and quality for the award of Bachelor of Electronic
Engineering (Industrial Electronics) With Honours.”
Signature : ………...
Supervisor’s Name : MR. ADIE BIN MOHD KHAFE
v
“This project report dedicated to the memory of my late beloved father, (May Allah grant him Jannah, Aameen)
and to my affectionate mother who always encouraged, motivated
and inspired me
vi
ACKNOWLEDGEMENT
I would like to take this opportunity to express my sincere gratitude to my supervisor of this project, Mr. Adie Bin Mohd Khafe for providing me guidance, comments, and patience in accomplishing my project and thesis.
Besides that, I would like to thank Universiti Teknikal Malaysia Melaka for providing me facilities to carry out my project and to complete this work. Not forget, to all my friends and course mates that have provided whether an idea or support, I tremendously acknowledge their direct or indirect supports and help.
vii
ABSTRACT
viii
ABSTRAK
ix
CONTENTS
CHAPTER TITLE PAGES
PROJECT TITLE i
DECLARATION FORM ii
DECLARATION iii
SUPERVISOR DECLARATION iv
DEDICATION v
ACKNOWLEDGEMENT vi
ABSTRACT vii
ABSTRAK
CONTENT
viii ix – xii
TABLE LIST xiii
FIGURE LIST xiv – xv
x
I INTRODUCTION
1 – 7
1.1 Background of problems 3 – 4
1.2 Problems statement
4 – 5 1.3 Objective of the project
6 1.4 Scope Of study
6 1.5 Methodology
7
II LITERATURE REVIEW 8 – 30
2.1.0 What is Process Tomography 8 – 10 2.1.1 Tomography Sensors 10 – 11 2.1.2 Electrical Capacitance Tomography 11 – 12 2.1.3 Electrical Resistance Tomography 13 2.1.4 Electrical Impedance Tomography 14 – 15 2.1.5 Ultrasonic Tomography 15 – 16
2.1.6 X-ray Tomography 16
2.1.7 Optical Tomography 17 2.1.8 Electrical Charge Tomography 18 – 19 2.1.9 Microwave Tomography 19 2.1.10 Mutual Inductance Tomography 20 – 21 2.2 Applications of Process Tomography 21 – 24 2.3 Infra-red Characteristics
24 – 25
2.4 Optical Projection 26 – 28
xi
III RESEARCH METHODOLOGY 31 - 45
3.1 Signal Conditioning Unit 31 – 32
3.2 PCB Layout 33
3.3 PCB Development 34 – 35
3.4 Linear Back Projection 35
3.5 The Optical Attenuation Model 36
3.6 Hardware Development 37 – 38
3.7 Software Development 38 – 45
3.7.1 Initialize Software with Data Acquisition 40 – 41
3.7.2 Acquiring Data 41
3.7.3 Processing Data 42 – 43 3.7.4 Image Construction 43 3.7.5 The Complete Program 44 – 45
IV RESULT AND DISCUSSION 46 – 57
4.1 Introduction 46
4.2 Circuit Simulation 47 – 48
4.3 Receiver Circuit Test 48 – 49
4.4 Receiver Circuit PCB Test 49
4.5 The Measurement System Test 50 – 54
4.5.1 Result for no object 51
4.5.2 Result for test object one 52 4.5.3 Result for test object two 53 4.5.4 Result for test object three 54
4.6 Real-time Performance 55
xii
V CONCLUSION AND RECOMMENDATION 58 – 59
5.1 Conclusion 58 –59
5.2 Recommendation 59
REFERENCES 60 – 61
xiii
TABLE LIST
TABLE TITLE PAGES
4.1 Simulation result 48
4.2 Result for circuit construction 49
4.3 Output for receiver circuit 49
4.4 Voltage reading for test no object 51
xiv
FIGURE LIST
FIGURE TITLE PAGES
1.1 Flow Chart of Research Methodology 7
2.1 An electrical capacitance tomography system 12 2.2 Diagram showing the electrical model of EIT 15
2.3 Block diagram of a typical EMT system 20
2.4 The electromagnetic spectrum 24
2.5 Types of projections for optical tomography. 27 - 28
3.1 Schematic of receiver circuit 32
3.2 Circuit of receiver and transmitter design using Proteus 32 3.3 PCB design for receiver and transmitter circuit 33
3.4 PCB fabrication step 34
3.5 PCB for receiver and transmitter circuit. 35
3.6 Block diagram 37
3.7 The Data Translation VI role 39
3.8 Flow of Programming 40
3.9 DT Get Board Selection VI 40
3.10 DT Shutdown VI 41
3.11 DT AI Sample Channels VI 41
3.12 Processing Block 42
3.13 Summing Loop Block 43
xv
3.15 The Complete Program 45
4.1 The simulation circuit for receiver 47
4.2 The simulation circuit for sender 47
4.3 Circuit when infra red is trigger 48
4.4 Circuit when infra red is not trigger 48
4.5 The measurement system 50
4.6 Reconstructed image for no object 51
4.7 Reconstructed image for test object one 52
4.8 Reconstructed image for test object two 53
4.9 Reconstructed image for test object three 54
4.10 Voltage output Vs Infra red intensity 56
A-1 LM358 Datasheet (a) 62
A-2 LM358 Datasheet (b) 63
A-3 LM358 Datasheet (c) 64
xvi
LIST OF ABBREVIATIONS
Tx - Receiver
Rx - Transmitter
CT - Computed tomography
PIC - Peripheral Interface Controller ECT - Electrical Capacitance Tomography SNR - Signal to Noise Radio
ERT - Electrical Resistance Tomography EIT - Electrical Impedance Tomography ECT - Electrical Charge Tomography LBP - Linear Back Projection
EMT - Electromagnetic Tomography
MRI - Magnetic Resonance Imaging
Hz - Hertz
PET - Position Emission Tomography NMR - Nuclear Magnetic Resonance
TV - Television
PCB - Printed Circuit Board
LV - LabVIEW
VI - Virtual Instruments
DDK - Driver Development Kit
NI - National Instrument
CHAPTER I
INTRODUCTION
1.0Introduction
2
The word ‘tomography’ is derived from the Greek words, where ‘tomo’ meaning ‘to slice’/’section’ and the word ‘graphy’ means image. In the year 1970 all the possibilities in the 30’s became true when this technique utilized the x-rays to form images of tissues based on their x-ray attenuation coefficients. However, this technique does not stop at the medical studies area and it was successfully developed into the industrial field and commonly known as the Industrial Process Tomography (IPT). This technique aims to measure the location concentration, phase proportions, and velocity measurement (Chan, 2003) retrieved from the quantitative interpretation of an image or, more likely, many hundreds of images corresponding to different spatial and temporal conditions using direct measurement/real time due to the dynamic changes of internal characteristic.
3
There are many parameters such as 2D and 3D images, velocity, and Mass Flow Rates (MFR) which can be retrieved from the tomography visualizing techniques within the processor or unit operation. Hence, the latter parameters give the information of the distributions of material in a pipeline. Therefore, from the knowledge of material distribution and material movement, a mathematical model can be derived and it can be used to optimize the design of the process (Tapp et.al, 2003).
1.1 Background of problems
Process Tomography has become one of the vast growing technologies nowadays The tomographic imaging of objects offers a unique opportunity to unravel the complexities of structure without the need to invade the object (Beck and Williams, 1996). It is a diversification from the original research on x-ray tomography, which focused on how to obtain 2-D cross-section images of animals, human, and non-living things (Syed Salim, 2003). Process Tomography can be applied to many types of processes and unit operation, including pipelines (Neuffer et al., 1999), stirred reactors (Wang et.al, 1999), fluidized bed (Halow and Nicoletti, 1992), mixers, and separator (Alias, 2002). Process tomography is an essential area of research involving flow imaging (image reconstruction) and velocity measurement. For example in the research that was carried out by Ibrahim (2000), the Linear Back projection (LBP) algorithm which was originally designed for x-ray tomography was used to obtain the concentration profiles of bubbles in liquid contained in a vertical flow rig. This project investigated the two-phase flow (solid particle and air) using a vertical pneumatic conveyor flow rig.
4
LBP algorithm is the most popular technique that was originally applied in medical tomography. Research conducted by Chan (2003) improved flow imaging using 16 alternating fan-beam projections with an image reconstruction rate of 20 fps, but this image reconstruction rate not is sufficient to achieve an accurate measurement of velocity. Generally, this project performed an investigation on how to improve the sensing method developed by Abdul Rahim (1996) which used fiber optics in flow visualization. Instead of using one light source, this project focused on using individual light source meaning one infra-red LED emitter for one photodiode. This method was then combined with an infra-red tomography system which consist of a hardware fixture, a signal conditioning system, and a data acquisition system by synchronizing the whole process operation.
Furthermore, image reconstruction in the spatial domain and frequency domain were investigated for this project. Generally, the information retrieved from the measurement system can be used to determine both the instantaneous volumetric and velocity of solids over the pipe cross section.
1.2Problem Statement
Now days, various types of tomography pipeline are used in process, and it is mostly using harmful radioactive that might be effect the usage and also dangerous to handle. Not only that, the data can only be viewed offline which is also difficult to the user.
5
This process tomography system requires the knowledge of various disciplines such as instrumentation, process, and optics to assist in the design and development of the system. Generally, the solutions to the problems that were carried out in this project are:
Development of a suitable sensor configuration for the selected infra-red emitter and receiver. Design of the fixture must be able to avoid the infra-red sensor from being exposed to any kind of ambient light (day light, lamp etc) and placed around the boundary of pipe so that light emitted from the emitter will be the only one that is in contact with the solid particle in the pipeline.
Selecting the suitable signal conditioning and electronic controller. The characteristic of the component used will determine the whole measurement result, such as power consupmtion, offset current, input impedance, slew rate, and common mode input voltage range (Tan, 2002).
Increasing the number of sensor measurement (32 pairs of infra-red transmitter and receiver for upstream and downstream planes). The number of measurement and projection angle subsequently affect the quality of the image reconstructed (Ibrahim, 2000).
6
1.3Objective of the Project
The objectives of this investigation are:
To construct hardware and software for real time infra red based tomography system in order to obtain cross section profile of conveying pipe.
To create a low cost and an unharmful tomography system.
1.4Scope of study
The aim of the study is to investigate the image reconstruction in pipe due to dropping particles. The scope of study includes:
Design and fabricate infra-red based signal conditioner circuit.
Design and fabricate prototype of infra-red based tomography system with conveying pipe.
Design and construct software to obtain cross section profile of flowing object inside the conveying pipe using LabVIEW.
7
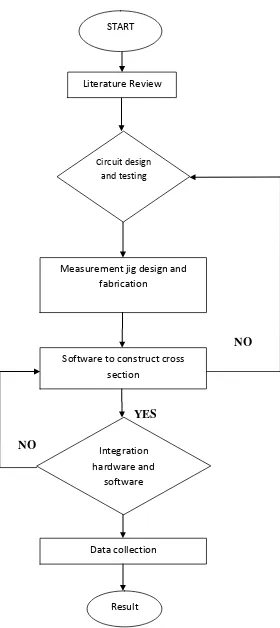
1.5Methodology
NO
YES
NO
Figure 1.1: Flow Chart of Research Methodology
Data collection Software to construct cross
section
Measurement jig design and fabrication
Integration hardware and
software Literature Review
START
Circuit design and testing
CHAPTER II
LITERATURE REVIEW
2.1.0 What is Process Tomography?
The use of “Process Tomography” is analogous to the application of medical tomographic scanners to examine the human body, but applied to an industrial process (tank, pipe, etc.) because there is a widespread need for the direct analysis of the internal characteristics of process plants in order to improve the design and operation of equipment. The computerized tomography (CT) methods used in medical imaging provide useful means for obtaining instantaneous information on distribution of components on a cross section of the pipe, and thus lead to the possibility of a much more accurate measurement (Beck et al., 1986).