SPECTRUM ANALYSIS OF SPEECH RECOGNITION VIA
DISCRETE TCHEBICHEF TRANSFORM
Ferda Ernawan
1and Nur Azman Abu, Nanna Suryana
2 1Faculty of Information and Communication Technology Universitas Dian Nuswantoro (UDINUS)
Semarang, Indonesia
2
Faculty of Information and Communication Technology Universiti Teknikal Malaysia Melaka
(UTeM)
Melaka, Malaysia
1e-mail: [email protected] ,
2e-mail: [email protected], [email protected]
ABSTRACT
Speech recognition is still a growing field. It carries strong potential in the near future as computing power grows. Spectrum analysis is an elementary operation in speech recognition. Fast Fourier Transform (FFT) is the traditional technique to analyze frequency spectrum of the signal in speech recognition. Speech recognition operation requires heavy computation due to large samples per window. In addition, FFT consists of complex field computing. This paper proposes an approach based on discrete orthonormal Tchebichef polynomials to analyze a vowel and a consonant in spectral frequency for speech recognition. The Discrete Tchebichef Transform (DTT) is used instead of popular FFT. The preliminary experimental results show that DTT has the potential to be a simpler and faster transformation for speech recognition.
Keyword-Speech recognition, Fast Fourier Transforms, Discrete Cosine Transform and Discrete Tchebichef Transform.
1. INTRODUCTION
Speech signal methods using Fourier transform are commonly used in speech recognition. One of the most widely used speech signal methods is the Fast Fourier Transform (FFT). FFT is a basic technique for digital signal processing applicable for spectrum analysis. The FFT is often used to compute numerical approximations to continuous Fourier. However, a straightforward application of the FFT to computationally often requires a large FFT to be performed even though most of the input data to the FFT may be zero [1].
Another transformation is Discrete Cosine Transform (DCT). DCT is a discrete transform whose kernel is defined by the cosine function. It is not popular to use in speech recognition, although it produces a clear speech signal representation and spectrum analysis. DCT does not produce clear efficient third formant F3in speech recognition.
The Discrete Tchebichef Transform (DTT) is another transform method based on discrete Tchebichef polynomials [2][3]. DTT has a lower computational complexity and it does not require complex transform unlike continuous orthonormal transforms. DTT does not involve any numerical approximation. DTT has been applied in several computer vision and image processing application in previous work. For example, DTT is used in image analysis [4][5], texture segmentation [6], multispectral texture [7], pattern recognition [8], image watermarking [9], monitoring crowds [10], image reconstruction [2][11][12], image projection [13] and image compression [14]-[16].However,DTT has not been used in audio processing.
FFT is an efficient algorithm that can perform Discrete Fourier Transform (DFT). FFT is applied in order to convert
time domain signals into the frequency domain . The sequence of complex numbers , … , represents a
given time domain signal. The following equation defines the Fast Fourier Transform of :
(1)
where , … , , is the sample at time index and is the imaginary number √ . is a vector of values
at frequency index corresponding to the magnitude of the sine waves resulting from the decomposition of the time indexed signal.The inverse FFT is given in the following equation:
(2)
The FFT takes advantage of the symmetry and periodicity properties of the Fourier Transform to reduce computation time. In this process, the transform is partitioned into a sequence of reduced-length transforms that is collectively performed with reduced computation [17].
The FFT technique also has performance limitation as the method. FFT is a complex transform which operates on an imaginary number and especial algorithm. It is a complex exponential that defines a complex sinusoid with frequency and it has not changed or upgraded.
2.2 Discrete Cosine Transform
The Discrete Cosine Transform has been used in frequency spectrum analysis, data compression, convolution
computation and image processing [18]. For example, let , , … , , with denoting column vector,
represents a frame of speech samples applied as an input to a speech coder. is transformed into a vector
, , … , , where denotes the number of coefficients.
cos (3)
, , … ,
where all the coefficients are real numbers and
√
, , … ,
The inverse of DCT (IDCT) is given in the following equation:
(4)
, , … ,
2.3 Discrete Tchebichef Transform
For a given positive integer (the vector size) and a value in the range , , the order orthonormal
Tchebichef polynomials , , , … , is defined using the following recurrence relation [11]:
, (9)
, (10)
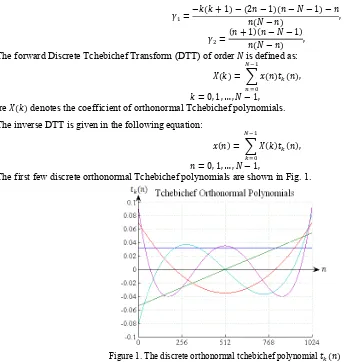
The forward Discrete Tchebichef Transform (DTT) of order is defined as:
, (11)
, , … , ,
where denotes the coefficient of orthonormal Tchebichef polynomials.
The inverse DTT is given in the following equation:
, (12)
, , … , ,
The first few discrete orthonormal Tchebichef polynomials are shown in Fig. 1.
Figure 1. The discrete orthonormal tchebichef polynomial for , , , and .
3. EXPERIMENTAL RESULT
The voice used is a male voice based on standard voice of vowel. The sounds of the vowel ‘O’ and the consonant ‘RA’ are used from the International Phonetic Alphabet [19]. A speech signal has a sampling rate frequency component at about 11 KHz. The sample sound of the vowel ‘O’ is shown in Fig. 2.
3.1Silence detector
Speech signals are highly redundant and contain a variety of background noise. At some level of the background noise which interferes with the speech, it means that silence regions have quite a height zero-crossings rate as the signal changes from one side of the zero amplitude to the other and back again. For this reason, the threshold is included to remove any zero-crossings. In this experiment, the threshold is . . This means that any zero-crossings that start and end within the range of , where . . , are not included in the total number of zero-crossings in that window.
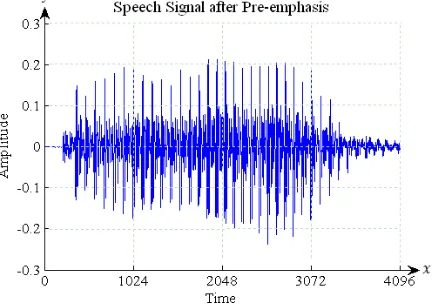
3.2 Pre-emphasis
Pre-emphasis is a technique used in speech processing to enhance high frequencies of the signal. It reduces the high spectral dynamic range. Therefore, by applying pre-emphasis, the spectrum is flattened, consisting of formants of similar heights. Pre-emphasis is implemented as a first-order Finite Impulse Response (FIR) filter defined as:
(13) where is the pre-emphasis coefficient, the value used for is typically around 0.9 to 0.95. is the sample data
which represents speech signal with is , where is the sample size which represent speech signal. The
speech signals after pre-emphasis of the vowel ‘O’ [19] is shown in Fig. 3.
Figure 3. Speech signals after pre-emphasis of the vowel ‘O’.
3.3 Windowing
Speech Recognition via FFT uses windowing function. A windowing function is used on each frame to smooth the signal and make it more amendable for spectral analysis.
Hamming window is a window functions used commonly in speech analysis to reduce the sudden changes and undesirable frequencies occurring in the framed speech. Hamming window is defined as:
. . cos (14)
where represents the width of and is an integer, with values . The resulting windowed segment is
defined as:
(15) where is the signal function and is the window function. Whereas, DTT consists coefficient of DTT, therefore the window is inefficient when the sample data are multiplied by a value close to zero. Any transition occurring during this part of the window will be lost so that the spectrum is no longer true real time.
3.4 Spectrum analysis
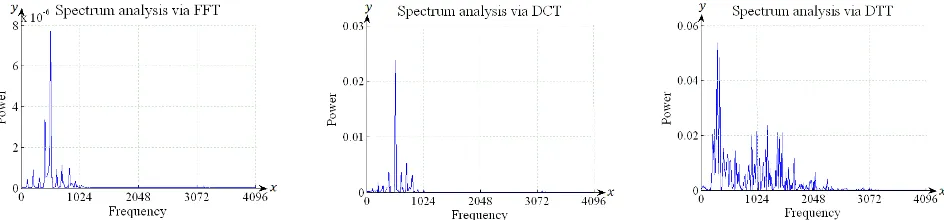
The spectrum analysis via FFT and DCT can be generated as follows:
| | (16)
The spectrum analysis via FFT and DCT of the vowel ‘O’ and the consonant ‘RA’ [19] is shown on the left and middle of Fig. 6 and Fig. 7. The spectrum analysis via DTT can be defined as:
| | (17)
(18)
where is the coefficient of DTT, is the sample data at time index and is the computation matrix of
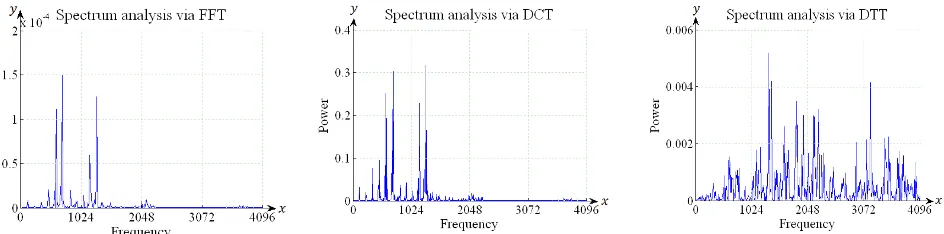
orthonormal Tchebichef polynomials. The spectrum analysis via DTT of the vowel ‘O’ and the consonant ‘RA’ is shown on the right of Fig. 6 and Fig. 7. The frequency formants of the vowel ‘O’ and the consonant ‘RA’ [19] via FFT, DCT and DTT as numerically are shown in Table I and Table II respectively.
Figure 4. Imaginary part of FFT (left), coefficient of DCT (middle) and coefficient of DTT (right) for speech signal of the vowel ‘O’.
Figure 5. Imaginary part of FFT (left), coefficient of DCT (middle) and coefficient of DTT (right) for speech signal of the consonant ‘RA’.
Figure 7. Imaginary part of FFT (left), coefficient of DCT (middle) and coefficient of DTT (right) for spectrum analysis of the
The conventional method of depicting formants F1 and F2 only does not sufficiently represent the multi-dimensional nature of the vowel quality. Delattre [20] showed that the third formant significantly influenced listener’s judgments of the vowel quality and the combination of higher formants carry a relatively significant influence on vowel perception.
More recent studies have examined the spectral features suggesting that the differences (F3-F2) are a more accurate way of identifying vowel frontends. Syrdal and Gopal [21] have shown that the separation between back and front vowels is more closely linked to the differences (F3-F2) than (F2-F1). However, it is important to recognize that F3 and F4 vary more than F1 and F2 as a result of the speaker characteristics. Nevertheless, they are relatively stable across vowel categories in contrast to F1 and F2, which vary greatly as a result of the vowel quality. The higher formants are therefore less effective carriers of phonetic information than the lower formants [22].
The speech signal of the vowel ‘O’ via DCT as illustrated on the middle of Fig. 4 showed that speech signal is clearer than FFT and DTT. On one hand, the speech signals of the vowel ‘O’ via DTT produces more noise than FFT and DCT. On the other hand, speech signals of the consonant ‘RA’ via FFT on the left of Fig. 5 produces a clearer from the noisy speech signal than DCT and DTT.
Spectrum analysis of the vowel ‘O’ via FFT on the left of Fig. 6 produces a lower power spectrum than DCT and DTT. On one hand, power spectrum via DTT on the right of Fig. 6 is higher than FFT and DCT. On the other hand, spectrum analysis of the consonant ‘RA’ via DCT on the middle of Fig. 7 is higher power spectrum than FFT and DTT. Spectrum analysis of the consonant ‘RA’ via DTT on the right of Fig. 7 produces more noise than FFT and DCT in a frequency spectrum. It is also capable to capture the third formant unlike DCT. The experimental result showed that the formants F1, F2 and F3 among FFT, DCT and DTT were identically similar.
5. CONCLUSION
formants via FFT, DCT, and DTT are compared. They have produced relatively identical outputs in term of speech recognitions.
REFERENCES
[1] D.H. Bailey and P.N. Swarztrauber, “A Fast Method for Numerical Evaluation of Continuous Fourier and Laplace
Transform,” Journal on Scientific Computing, vol. 15, no. 5, Sep. 1994, pp. 1105-1110.
[2] R. Mukundan, “Improving Image Reconstruction Accuracy Using Discrete Orthonormal Moments,” Proceedings of
International Conference on Imaging Systems, Science and Technology, Jun. 2003, pp. 287-293.
[3] R. Mukundan, S.H. Ong, and P.A. Lee, “Image Analysis by Tchebichef Moments,” IEEE Transactions on Image
Processing, vol. 10, no. 9, Sep. 2001, pp. 1357–1364.
[4] C.-H. Teh and R.T. Chin, “On Image Analysis by the Methods of Moments,” IEEE Transactions on Pattern
Analysis Machine Intelligence, vol. 10, no. 4, Jul. 1988, pp. 496-513.
[5] N.A. Abu, W.S. Lang, and S. Sahib, “Image Super-Resolution via Discrete Tchebichef Moment,” Proceedings of
International Conference on Computer Technology and Development (ICCTD 2009), vol. 2, Nov. 2009, pp. 315– 319.
[6] M. Tuceryan, “Moment based texture segmentation,” Pattern Recognition Letters, vol. 15, Jul. 1994, pp. 659-668.
[7] L. Wang and G. Healey, “Using Zernike Moments for the Illumination and Geometry Invariant Classification of
Multispectral Texture,” IEEE Transactions on Image Processing, vol. 7, no. 2, Feb. 1998, pp. 196-203.
[8] L. Zhang, G.B. Qian, W.W. Xiao, and Z. Ji, “Geometric invariant blind image watermarking by invariant
Tchebichef moments,” Optics Express Journal, vol. 15, no. 5, Mar. 2007, pp. 2251-2261.
[9] H. Zhu, H. Shu, T. Xia, L. Luo, and J.L. Coatrieux, “Translation and scale invariants of Tchebichef moments,” Journal of Pattern Recognition Society, vol. 40, no. 9, Sep. 2007, pp. 2530-2542.
[10] H. Rahmalan, N. Suryana and N. A. Abu, “A general approach for measuring crowd movement,” Malaysian
Technical Universities Conference and Exhibition on Engineering and Technology (MUCEET2009), Jun. 2009, pp. 98-103.
[11] R. Mukundan, “Some Computational Aspects of Discrete Orthonormal Moments,” IEEE Transactions on Image
Processing, vol. 13, no. 8, Aug. 2004, pp. 1055-1059.
[12] N.A. Abu, N. Suryana, and R. Mukundan, “Perfect Image Reconstruction Using Discrete Orthogonal Moments,”
Proceedings of The 4th IASTED International Conference on Visualization, Imaging, and Image Processing
(VIIP2004), Sep. 2004, pp. 903-907.
[13] N.A. Abu, W.S. Lang, and S. Sahib, “Image Projection Over The Edge,” International Conference on Industrial and
Intelligent Information (ICIII 2010), Proceedings 2nd International Conference on Computer and Network
Technology (ICCNT2010), Apr. 2010, pp. 344-348.
[14] R. Mukundan and O. Hunt, “A comparison of discrete orthogonal basis functions for image compression,”
Proceedings Conference on Image and Vision Computing New Zealand (IVCNZ 04), Nov. 2004, pp. 53-58.
[15] W.S. Lang, N.A. Abu, and H. Rahmalan, “Fast 4x4 Tchebichef Moment Image Compression,” Proceedings
International Conference of Soft Computing and Pattern Recognition (SoCPaR2009), Dec. 2009, pp. 295‒300.
[16] N.A. Abu, W.S. Lang, N. Suryana, and R. Mukundan, “An Efficient Compact Tchebichef moment for Image
Compression,” 10th International Conference on Information Science, Signal Processing and their applications (ISSPA2010), May 2010, pp. 448-451.
[17] S. Rapuano and F. Harris, “An introduction to FFT and time domain windows,” IEEE Instrumentation and
Measurement Society, vol. 10, no. 6, Dec. 2007, pp. 32-44.
[18] J. Zhou and P. Chen, “Generalized Discrete Cosine Transform,” Pacific-Asia Conference on Circuits,
Communications and Systems, May 2009, pp. 449-452.
[19] J.H. Esling and G.N. O'Grady, “The International Phonetic Alphabet,” Linguistics Phonetics Research, Department of Linguistics, University of Victoria, Canada, 1996.
[20] P. Delattre, “Some Factors of Vowel Duration and Their Cross-Linguistic Validity,” Journal of the Acoustical Society of America, vol. 34, Aug. 1962, pp. 1141-1143.
[21] K. Syrdal and H.S. Gopal, “A perceptual model of vowel recognition based on the auditory representation of