ISSN 0854-5804
ANALYSIS ON SHRIMP TRADE
BETWEEN INDONESIA
AND
BELGIUM
By Suharno
ABSTRACT
Tulisan ini menganalisis faktor-faktor yang mempengaruhi pasokan ekspor udang Indonesia ke pasar Belgia dan faktor-faktor yang mempengaruhi permintaa~l impor pasar Belgia terhadap udang Indonesia. Analisis didasarkan pada analisis partial dengall menggunakan model perdagangan satu negara. Pada penelitian diketallui bahwa nilai tukar Rupiah terhadap dollar Amerika Serikat merupakan faktor dengall pengaruli terbesar yang nlenentukan ekspor udang Indonesia ke pasar Belgia. Pada sisi impor diketahui bahwa tingkat pendapatari perkapita di Belgia nierijadi faktor yang paling penting menentukan pernlintaan impor pasar Belgia terhadap udang Indonesia. Hasil prakiraan tentang pola ekspor impor udang antara Belgia dan Indonesia nlenunjukkan ballwa dalam kurun sepulull tahun mendatling, sampai tahun 2000, volunle ekspor udang Indonesia ke pasar Belgia akan tumbuli dellgall rata-rata pertunlbuhan per tahun sebesar 9.8 persen, ceteris paribus.
I . Introduction
To increase foreign currencies tlirougli no11 oil and natcral gas commodities, s l i r i n ~ p has heen chosen by the Indonesian authority to be an export oriented comnlodity. The clioice is based upon several reasons :
I . Sl~rililp is already accepted on tlir intertiatiorul marker.
3. Shrimp has a Iiigll earning power to generate foreign excha~~ge.
3. luternational market for shrimp is relatively more stable and resistant than for other agricultural products.
There are two factors whicli can introduce potential problems regarding tlie shrimp comniodity : the strong dependence on the Japanese market and fast growth of the shrimp production conling from aquaculture operation.
These two potential problems lead to tlle need of creating or searching a new market. One potential market for the Indonesian shrimp is the European
market. For the moment the most potential market for the Indonesian shrimp is the Western European market.
The Western European market a s a matter of fact, is a conglomerate of a separate nations with pronounced differences in taste, preference, duties, regu- lations, purchasing power and so on. Therefore the overseas exporters must enter tlie Western European market on a country by country basis.
Because of that reason, the current study is focused on one of the potential markets of Europe, namely Belgium.
2. Objective and Significance of the Study
The objective is to assess issues on the trade relation between Indonesia and Belgium for the shrimp. More specifically, the objective is to analyze the factors affecting export and import.
1. to analyze the factors affecting the Belgian import of Indonesian shrinip 2. to analyze the effect of variation of important factor(s) affecting the import 3. to analyze the factors affecting the Indonesian export to the Belgian market 4. to analyze the effect of variation of important factor(s) affecting the export
supply.
5. to predict the import and export of Indonesian shrimp on the Belgian market. The result of this study will be valuable especially for the trade policy related to the Indonesia-Belgium relation. In addition, this present study niay present some perspectives for the further study on related areas.
3. Approach and Operational Model
To attain these objectives, the import demand and export supply functions of lrido~iesiari shrinip on the Belgian market are specified and empirically estimated. From the estimation sonie coefficients will be found. Analysis will be undertaken on tlie found estimates.
Following the work of Gor~arsyah (1983), there are three sets of empirical niodels for assessnierit of export - iniport relation between two countries. They are a single country model, a two country model and three country model. These three set of niodels are basically based on above discussed theoretical model.
For the purpose of this study one country n~odel is employed. The niodels are represented by equation (1) and (2).
ISSN 0854-5804 59
IMP = a.
-
a,MPB-
a,ERB+
a,PFB-
a4QSB+
a,YI+
a,QMB+
p,...
(1) EXP = bo+
blPBI+
b,PMI-
b YI+
b4QSI+
b,ERI+
p,...
(2)3
Signs of the parameters (a's and b's) indicate the direction of the relationship as hypothesized.
Due to the nature of the specification, the single-country models were es- timated using the ordinary least square technique. The model was estimated in linear forms, because the existence of the additive identity equation prevents the use of logarithmic forms.
4.
METHODOLOGY
Tlie analysis consists two parts a literary and an empirical analysis are carried out.
The literature analysis describes tlie productions, the consumptions, the portlimport patterns and policy related to the shrimp commodity.
The empirical approach is carried out by correlation and multiple regression analysis of the tinie series data.
In this paper on1 y empirical analysis is presented.
Definition and measiremcnt for the variables used iri this study are represent-
ed i n table 1 .
5. Result
and Discussion
5.1 Export of the Indonesian Shrimp on the Belgian Market
The estimated Coefficients for the export supply is demonstrated in Table 2. Table 2 shows us some important indications:
Tlie statistical fitness of the estinlatiori is good. This isshown by the high value of R' (0.985) meaning that 98 percent of variation of the export supply of the Indonesian shrimp 011 die Belgian market can be explained by the variables in
tlie model simultaneously.
"
But the estimated model also suffers from n~ulticoilinearity in any degree.The overall outcome of that circumstance is that there are only two variables which significantly can explain the variation of the export supply of the Indo- nesian shrimp on the Belgian market. These variables are the exchange rate of the Indonesian Rupiah to the US Dollar (90 percent level of confidence) and the per capita income in Indonesia (80 percent level of confidence). The production level o f shrimp in Indonesia does influence insignificantly.
Table I . Definition, Measurenlent and Source of Data Used in the Study
Table name Definition and Measurement Source of data IMP Belgian shrimp import from DGF- RI*
Indonesia (thousand of kg)
NB Number of population in NIS** Belgium (million persons)
PBI Price of Shrimp in the DGF - RI world market (US$/kg)
ERB Exchange rate for BFR to NBB* * *
us
$ (BFR/USS)MPB Price of Shrimp in Belgian NIS (BF/k9)
YB Belgian GDP per capita NBB
(BF 1000/capita)
QS B Shrimp production in NIS
Belgium (1000 kg )
P FB Average price of Fish other NIS than Shrimp in Belgium (BF/kg)
EX P Indonesian shrimp Export to DGF - RI Belgium (thousand kg)
PM I Price of meat in Indonesia BI - RI****
(Rp/kg)
YI Indonesian GDP per capita BI - RI (US $/capita)
ERI Exchange rate for Indonesian BI - RI Rupiah to US$
Qs
I Production of Shrimp in DGF - RI Indonesia (thousand kg)QMB Meat supply in Belgium NIS
(1000 kg)
* D.G. Fishery of Republic of Indonesia
* * Nationaal Instituut voor Statistiek Belgi&
* * *
Nationaal Bank van BelgiE* * * * Bank of Indonesia
ISSN 0854-5804
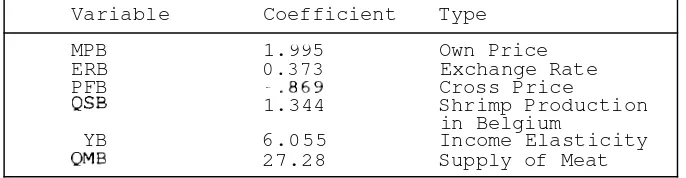
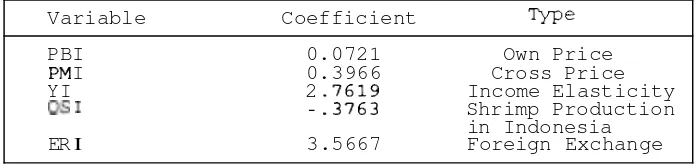
The clearer indication is shown by the estimated elasticity coefficients pre- sented in table 3. From this table it is evidence that the exchange rate is the most influencing factor for the export supply of the Indonesian shrimp to the Belgian market. This finding is slightly in line with the result found by Retnowati.
Table 2. Estimated Export of Indonesian Shrimp to Belgium
Variable Estimate t statistic
Constant - 5807.5623
PB I 10.6141 0.043
PM I 0.0981 0.196
YO 5.8097 1.170*
QS I - .0021 - .I92
ER I 2.6992 2.203**
Rsquare 0.9850
F table 5.79
F ratio 26.302
Table 3. Estimated Elasticities For Export of Indonesian Shrimp on The Belgian Market
Variable Coefficient ?Lpe
PB I 0.0721 Own Price
PM I 0.3966 Cross Price
YI 2 -7619 Income Elasticity
Qs
I - .3763 Shrimp Productionin Indonesia
ER I 3.5667 Foreign Exchange
la investigating the Japanese market for Indonesian shrimp, Retnowati found that the export supply of the Indonesian sllrimp o n the Japanese market is signifi- cantly affected by. 1. tile excl~ange rate of the Indonesian Rupiah to the US Dollar, 2. the production level of shrimp in Indonesia. The price of shrimp in the world market was also found not to be influencing.
Fronl the finding i t is obvious that tile exchange rate of the Indonesian Rupiah to the US Dollar is of important factor determining the Indonesian shrimp in for- eign market.
1 . The export supply of the Indonesian shrimp to the Belgian market has a posi- tive-significant relationship with the exchange rate, the price of meat in Indo- nesia, and the production level of shrimp in Indonesia.
2. The export supply of lndonesian shrimp to the Belgian market lias a negative
-
insignificant relation with the per capita income in Indonesia.3. The export supply of Indonesian shrimp to Belgian market dependent upon the exchange rate of Indonesian Rupiah to US dollar, the price of meat in Indone- sia, The production level of shrimp in Indonesia, the per capita of these vari- ables the exchange rate was found to be tlie most affecting factor.
4. The prediction of the export supply indicates that, by the year 2000, the export supply of the lndonesian shrimp to the Belgian niarket is expected on the average growth of 9.8 percent per annum.
5.2
The Import lndonesian Shrimp
byThe Belgian Market
With respect to the iniport demand of the l~idorlesian shrimp of the Belgian nlarket, tlie finding are as follows:
I . The import demand of tlie Indooesian slirinip on the Belgian nlarket lias a positive-signiticant relationship with tlie price of meat in Belgium, the price of fish in Belgium, and the per capita income in tlie country. Negative relations were found between the import denlalid of tlie lndorlesian shrimp and the production level of shrimp in Belgium.
2. All the variables mentioned above are intluencing simultaneously the iniport deliland of the lrido~~esiari shrimp by tlie Belgian niarket. Of all these variables per capita income in Belgium was found to be the niost intluerlcing factor for the import demand of Indonesian shrimp by the Belgiarl market.
3. On the basis of the annual growth of per capita income in Belgium, it is pre- dicted that the import demand of the Indonesian shrimp on the Belgian niarket will be 6014.73 ton by the year 2000. The expected average growth of the import demand for the coming decade is 8.9 per cent.
I S S N 0854-5804
Table 4. Estimated Demand for Indonesian Shrimp in Belgium
Variable Estimate T value
Const ant -11402.5481
MPB 334.3151 5.404**
ERB 8.6539 0.846
PFB -11.0142 -2.548*
QS B -2.1380 5.062**
YB 0.0132 21.7660***
QMB 0.110 1.815
Rsquare 0.9996
F table (0.05) 13.75
F ratio 455.524
* * * significant at 95 % level of confidence * * significant at 90 % level of confidence * significant at 80 % level of confodence
Table 5. Estinlated Elasticity for Import of Indoensian shrimp in Belgium
Variable Coefficient Type
MPB 1.995 Own Price
ERB 0.373 Exchange Rate
P FB - .869 Cross Price
QSB 1.344 Shrimp Production
in Belgium
YB 6.055 Income Elasticity
QMB 27.28 Supply of Meat
6. Policy Implication
Since domestic production of shrimp in Indonesia is found to be insignif- icant with shrimp export of Indonesia it implies that production a p p r o ~ c l l in Indonesian shrimp industry should he revised comprehensively. In other words production policy in Indonesian shrimp industry sliould be followed closely with marketing policy in finding new market.
7 .
Conclusions
On the basis of regression analysis, i t was found that the five proposed va- riables. - tlie exchange rate. shrimp production level in Indonesia, price of shrinip in world niarket, the per capita income in Indonesia. and the price of nieat in Indonesia, are simultaneously significantly influencing the export supply of Indone- sian slirinip in Belgian niarket, in a simultaneous way.
Of these five variables, exchange rate o f lndonesian Rupiah to the US dollar. was found to he the most affecting variable tlie export supply of tlie Indonesian slirinip into the Belgian niarket.
Using the estimates of export function as a predictor. it is predicted that up to the year 2000, the export supply of Indonesian slirinip to the Belgian niarket will he growing with the expected average growth of 9.8 percent per annuni.
Concerning iniport the demand model, some conclusions can be drawn from the correlation.a~lalysis.
Accordingly. the import deniarld of Indonesian slirinip by the Belgian market lias a positive -significant relationship in respect wit11 tile following variables :
- price of nieat in the Belgiuni niarket; - price of fish o n the Belgian niarket; - per capita income of Belgiuni.
Tlie relatiorisliip of iniport demand of Indonesian slirinip by the Belgian niarket was found to be negatively significant correlated in with a exclia~ige rate of Belgian Frank to the US Dollar, and negatively insignificant the slirinip produc- tion in belgiuni.
0 1 1 the basis tlie regression a~lalysis, i t was found that the iniport deniand of tile Indonesian shrinip o n the Belgian market is significantly affected by the varia- tion of tile exchange rate, the price of nieat in Belgium, the price of fish in Bel- gium, arid the production level of slirinip in Indonesia.
Of the six variables which are proposed in the n~odel i t was found that, per capita income in Belgium is tile most significant variable in affecting the variation in iniport deniand of the Indonesian shrimp by Belgium.
These findings also suggest that fish and nieat are the substitute for shrimp, and slirinip is a normal good, because the demand is increasing with respect to the increase in the per capita income.
Using the per capita income of Belgian Frank to The US dollar as an predic- tor, i t is estimated that up to the year 2000, the import deniand of Indonesian shrinip by the Belgian market is expected to be growing with the expected average growth of 8.9 percent per annum.
REFERENCES
Ackefors, Hans. A Regional Survey of the Agriculture Sectors in Eastern and Northwestern Europe. United Nations Development Program
-
Food and Agriculture Organization of the United Nations, Rome 1989.Bank Bumi Daya
-
Economic Review. Vol. XVINo 4 Decmmber 1990.Biro Pusat Statistik. Indikator ekonomi : Indeks harga. January 1991, BPS, 1991.
Bijzondere Raadgevende Commissie voor de Visserij. De evolutie an de Bel- gische Visserij sector in 1989. Centrale Raad voor Het Bedrijfsleven, Oostende, 1990.
Djojohadikusumo, S. Perkembangan Ekononli Indonesia selama enlpat Tahap Pelita 1969170
-
1988189. Canter for Policy Studies (CPS). Jakarta. 1991.Ferdouse. F. Asian Shrimp Situation : Infofish International 1/90 Kuala Lumpur. 1990.
FIIU. International Trade in Fish and Fishery Products INFOFSH Marketing Digest No I I 87, Kuala Lumpur 1987.
Gonarsyah. I. M Econonletric Analysis of the US
-
JAPAN-
KOREA Market for US White Wheat. Departnlerlt of Agricultural and resource Econonl- ics - OREGON STATE UNIVERSITY 1983.Gu~larsson. M. Changing Ground fish patterns in Europe. Infofish International 5 / 90, Kuala Lumpur, 1990.
Iman, R.L. and Conove. W.J. Modern Business Statistics John Willey and Sons. Inc. Singapore, 1983.
Ku-Chai Chong : Asian Shrimp Aquaculture at cross road Infofish International
5 190, Kuala lumpur. 1990.
Kotler. P. Principle of marketing, third Edition Prentice hall International editions, Englewood cliffs, New jersey, 1986.
Can1hert.R. Value added shrimp Product in Europe Info fish International 5 190. Kuala Lumpur. 1 990.
National lnstituut voor de Statistic. STATISTICS TIJDSCHRIFT, Nummer 6.77r jaargang. Brussels, 199 I.
National lnstituut voor de Statistiek : Landhouw Statistirken Maand- scrift. Juli-Drcrnihrr 1991. Brussrls, 1991.
Rackowr. R. Shrimp
-
slower growth toward 1990. Info fish Marketing Digest No 1 ; 53. Kuala Lumpur, 1983.Rrtnowati. N. A ~ i a l y s r s rkononii Udang Indonesia di pasar Jrpang Tesis Fakultas Pasca sarjana. lristitut Perta~~iari Bogor, 1990.
S~iiitli ii11CI Ravel Saltz. Fishery Trade hetwerri the EEC and Drveloping
Coul~trirs. I~ifo tisli I ~ ~ t e r ~ ~ a t i o ~ i a l 5 1 87. Kuala Lumpur 1987.
Tonirk, W.
G.
and Rohinsori, K.L. Agricultural Product Prices. Second Edi-tiolis.
Van Eys,S. Shrimp Market Trends and Cl~aracteristics
-
USA and Europe, Info fish Marketing Digest No 6 186. 1986.Sullarto. Analisa Permintaan dari Ekspor Tell Indonesia Tesis. akultas Pasca Sarjana. U11iversitas Gajah Mada . Yogjakarta. 1989.
Van Eys.S. The Shrimp l~idustry in the Asia 1 Pacific region Info fish Marketing D i p s t 110 1 / 85. Kuala (lumpur). 1985.
The Indonesian Economy. An11ua1 review vol. X I no 1. January 1991. Canter for Policy Studies (CPS). Jakarta. 1991.
Indonesian Foreign Trade Statistics, Jilid I VOL. 1 . 1988 and 1989. Biro Pusat Statistik. Jakarta, 1989.
Laporari Bulanan April & Agustus 1990. Direktorat Jrndral Perikanar~ Depanemen Pertanian RI. Jakarta. 1990.
ISSN 0854-5804 67
Statistik Ekonomi Keuangan Indonesia. vol XXIII No 02 Feb 1991. Bank Indonesia, 1991.
Sea fishery Service. Ministry of Agriculture Oostendtt. 1991.
ISSN 0854-5804
ANALYSIS ON SHRIMP TRADE
BETWEEN INDONESIA
AND
BELGIUM
By Suharno
ABSTRACT
Tulisan ini menganalisis faktor-faktor yang mempengaruhi pasokan ekspor udang Indonesia ke pasar Belgia dan faktor-faktor yang mempengaruhi permintaa~l impor pasar Belgia terhadap udang Indonesia. Analisis didasarkan pada analisis partial dengall menggunakan model perdagangan satu negara. Pada penelitian diketallui bahwa nilai tukar Rupiah terhadap dollar Amerika Serikat merupakan faktor dengall pengaruli terbesar yang nlenentukan ekspor udang Indonesia ke pasar Belgia. Pada sisi impor diketahui bahwa tingkat pendapatari perkapita di Belgia nierijadi faktor yang paling penting menentukan pernlintaan impor pasar Belgia terhadap udang Indonesia. Hasil prakiraan tentang pola ekspor impor udang antara Belgia dan Indonesia nlenunjukkan ballwa dalam kurun sepulull tahun mendatling, sampai tahun 2000, volunle ekspor udang Indonesia ke pasar Belgia akan tumbuli dellgall rata-rata pertunlbuhan per tahun sebesar 9.8 persen, ceteris paribus.
I . Introduction
To increase foreign currencies tlirougli no11 oil and natcral gas commodities, s l i r i n ~ p has heen chosen by the Indonesian authority to be an export oriented comnlodity. The clioice is based upon several reasons :
I . Sl~rililp is already accepted on tlir intertiatiorul marker.
3. Shrimp has a Iiigll earning power to generate foreign excha~~ge.
3. luternational market for shrimp is relatively more stable and resistant than for other agricultural products.
There are two factors whicli can introduce potential problems regarding tlie shrimp comniodity : the strong dependence on the Japanese market and fast growth of the shrimp production conling from aquaculture operation.
These two potential problems lead to tlle need of creating or searching a new market. One potential market for the Indonesian shrimp is the European
market. For the moment the most potential market for the Indonesian shrimp is the Western European market.
The Western European market a s a matter of fact, is a conglomerate of a separate nations with pronounced differences in taste, preference, duties, regu- lations, purchasing power and so on. Therefore the overseas exporters must enter tlie Western European market on a country by country basis.
Because of that reason, the current study is focused on one of the potential markets of Europe, namely Belgium.
2. Objective and Significance of the Study
The objective is to assess issues on the trade relation between Indonesia and Belgium for the shrimp. More specifically, the objective is to analyze the factors affecting export and import.
1. to analyze the factors affecting the Belgian import of Indonesian shrinip 2. to analyze the effect of variation of important factor(s) affecting the import 3. to analyze the factors affecting the Indonesian export to the Belgian market 4. to analyze the effect of variation of important factor(s) affecting the export
supply.
5. to predict the import and export of Indonesian shrimp on the Belgian market. The result of this study will be valuable especially for the trade policy related to the Indonesia-Belgium relation. In addition, this present study niay present some perspectives for the further study on related areas.
3. Approach and Operational Model
To attain these objectives, the import demand and export supply functions of lrido~iesiari shrinip on the Belgian market are specified and empirically estimated. From the estimation sonie coefficients will be found. Analysis will be undertaken on tlie found estimates.
Following the work of Gor~arsyah (1983), there are three sets of empirical niodels for assessnierit of export - iniport relation between two countries. They are a single country model, a two country model and three country model. These three set of niodels are basically based on above discussed theoretical model.
For the purpose of this study one country n~odel is employed. The niodels are represented by equation (1) and (2).
ISSN 0854-5804 59
IMP = a.
-
a,MPB-
a,ERB+
a,PFB-
a4QSB+
a,YI+
a,QMB+
p,...
(1) EXP = bo+
blPBI+
b,PMI-
b YI+
b4QSI+
b,ERI+
p,...
(2)3
Signs of the parameters (a's and b's) indicate the direction of the relationship as hypothesized.
Due to the nature of the specification, the single-country models were es- timated using the ordinary least square technique. The model was estimated in linear forms, because the existence of the additive identity equation prevents the use of logarithmic forms.
4.
METHODOLOGY
Tlie analysis consists two parts a literary and an empirical analysis are carried out.
The literature analysis describes tlie productions, the consumptions, the portlimport patterns and policy related to the shrimp commodity.
The empirical approach is carried out by correlation and multiple regression analysis of the tinie series data.
In this paper on1 y empirical analysis is presented.
Definition and measiremcnt for the variables used iri this study are represent-
ed i n table 1 .
5. Result
and Discussion
5.1 Export of the Indonesian Shrimp on the Belgian Market
The estimated Coefficients for the export supply is demonstrated in Table 2. Table 2 shows us some important indications:
Tlie statistical fitness of the estinlatiori is good. This isshown by the high value of R' (0.985) meaning that 98 percent of variation of the export supply of the Indonesian shrimp 011 die Belgian market can be explained by the variables in
tlie model simultaneously.
"
But the estimated model also suffers from n~ulticoilinearity in any degree.The overall outcome of that circumstance is that there are only two variables which significantly can explain the variation of the export supply of the Indo- nesian shrimp on the Belgian market. These variables are the exchange rate of the Indonesian Rupiah to the US Dollar (90 percent level of confidence) and the per capita income in Indonesia (80 percent level of confidence). The production level o f shrimp in Indonesia does influence insignificantly.
Table I . Definition, Measurenlent and Source of Data Used in the Study
Table name Definition and Measurement Source of data IMP Belgian shrimp import from DGF- RI*
Indonesia (thousand of kg)
NB Number of population in NIS** Belgium (million persons)
PBI Price of Shrimp in the DGF - RI world market (US$/kg)
ERB Exchange rate for BFR to NBB* * *
us
$ (BFR/USS)MPB Price of Shrimp in Belgian NIS (BF/k9)
YB Belgian GDP per capita NBB
(BF 1000/capita)
QS B Shrimp production in NIS
Belgium (1000 kg )
P FB Average price of Fish other NIS than Shrimp in Belgium (BF/kg)
EX P Indonesian shrimp Export to DGF - RI Belgium (thousand kg)
PM I Price of meat in Indonesia BI - RI****
(Rp/kg)
YI Indonesian GDP per capita BI - RI (US $/capita)
ERI Exchange rate for Indonesian BI - RI Rupiah to US$
Qs
I Production of Shrimp in DGF - RI Indonesia (thousand kg)QMB Meat supply in Belgium NIS
(1000 kg)
* D.G. Fishery of Republic of Indonesia
* * Nationaal Instituut voor Statistiek Belgi&
* * *
Nationaal Bank van BelgiE* * * * Bank of Indonesia
ISSN 0854-5804
The clearer indication is shown by the estimated elasticity coefficients pre- sented in table 3. From this table it is evidence that the exchange rate is the most influencing factor for the export supply of the Indonesian shrimp to the Belgian market. This finding is slightly in line with the result found by Retnowati.
Table 2. Estimated Export of Indonesian Shrimp to Belgium
Variable Estimate t statistic
Constant - 5807.5623
PB I 10.6141 0.043
PM I 0.0981 0.196
YO 5.8097 1.170*
QS I - .0021 - .I92
ER I 2.6992 2.203**
Rsquare 0.9850
F table 5.79
F ratio 26.302
Table 3. Estimated Elasticities For Export of Indonesian Shrimp on The Belgian Market
Variable Coefficient ?Lpe
PB I 0.0721 Own Price
PM I 0.3966 Cross Price
YI 2 -7619 Income Elasticity
Qs
I - .3763 Shrimp Productionin Indonesia
ER I 3.5667 Foreign Exchange
la investigating the Japanese market for Indonesian shrimp, Retnowati found that the export supply of the Indonesian sllrimp o n the Japanese market is signifi- cantly affected by. 1. tile excl~ange rate of the Indonesian Rupiah to the US Dollar, 2. the production level of shrimp in Indonesia. The price of shrimp in the world market was also found not to be influencing.
Fronl the finding i t is obvious that tile exchange rate of the Indonesian Rupiah to the US Dollar is of important factor determining the Indonesian shrimp in for- eign market.
1 . The export supply of the Indonesian shrimp to the Belgian market has a posi- tive-significant relationship with the exchange rate, the price of meat in Indo- nesia, and the production level of shrimp in Indonesia.
2. The export supply of lndonesian shrimp to the Belgian market lias a negative
-
insignificant relation with the per capita income in Indonesia.3. The export supply of Indonesian shrimp to Belgian market dependent upon the exchange rate of Indonesian Rupiah to US dollar, the price of meat in Indone- sia, The production level of shrimp in Indonesia, the per capita of these vari- ables the exchange rate was found to be tlie most affecting factor.
4. The prediction of the export supply indicates that, by the year 2000, the export supply of the lndonesian shrimp to the Belgian niarket is expected on the average growth of 9.8 percent per annum.
5.2
The Import lndonesian Shrimp
byThe Belgian Market
With respect to the iniport demand of the l~idorlesian shrimp of the Belgian nlarket, tlie finding are as follows:
I . The import demand of tlie Indooesian slirinip on the Belgian nlarket lias a positive-signiticant relationship with tlie price of meat in Belgium, the price of fish in Belgium, and the per capita income in tlie country. Negative relations were found between the import denlalid of tlie lndorlesian shrimp and the production level of shrimp in Belgium.
2. All the variables mentioned above are intluencing simultaneously the iniport deliland of the lrido~~esiari shrimp by tlie Belgian niarket. Of all these variables per capita income in Belgium was found to be the niost intluerlcing factor for the import demand of Indonesian shrimp by the Belgiarl market.
3. On the basis of the annual growth of per capita income in Belgium, it is pre- dicted that the import demand of the Indonesian shrimp on the Belgian niarket will be 6014.73 ton by the year 2000. The expected average growth of the import demand for the coming decade is 8.9 per cent.
I S S N 0854-5804
Table 4. Estimated Demand for Indonesian Shrimp in Belgium
Variable Estimate T value
Const ant -11402.5481
MPB 334.3151 5.404**
ERB 8.6539 0.846
PFB -11.0142 -2.548*
QS B -2.1380 5.062**
YB 0.0132 21.7660***
QMB 0.110 1.815
Rsquare 0.9996
F table (0.05) 13.75
F ratio 455.524
* * * significant at 95 % level of confidence * * significant at 90 % level of confidence * significant at 80 % level of confodence
Table 5. Estinlated Elasticity for Import of Indoensian shrimp in Belgium
Variable Coefficient Type
MPB 1.995 Own Price
ERB 0.373 Exchange Rate
P FB - .869 Cross Price
QSB 1.344 Shrimp Production
in Belgium
YB 6.055 Income Elasticity
QMB 27.28 Supply of Meat
6. Policy Implication
Since domestic production of shrimp in Indonesia is found to be insignif- icant with shrimp export of Indonesia it implies that production a p p r o ~ c l l in Indonesian shrimp industry should he revised comprehensively. In other words production policy in Indonesian shrimp industry sliould be followed closely with marketing policy in finding new market.
7 .
Conclusions
On the basis of regression analysis, i t was found that the five proposed va- riables. - tlie exchange rate. shrimp production level in Indonesia, price of shrinip in world niarket, the per capita income in Indonesia. and the price of nieat in Indonesia, are simultaneously significantly influencing the export supply of Indone- sian slirinip in Belgian niarket, in a simultaneous way.
Of these five variables, exchange rate o f lndonesian Rupiah to the US dollar. was found to he the most affecting variable tlie export supply of tlie Indonesian slirinip into the Belgian niarket.
Using the estimates of export function as a predictor. it is predicted that up to the year 2000, the export supply of Indonesian slirinip to the Belgian niarket will he growing with the expected average growth of 9.8 percent per annuni.
Concerning iniport the demand model, some conclusions can be drawn from the correlation.a~lalysis.
Accordingly. the import deniarld of Indonesian slirinip by the Belgian market lias a positive -significant relationship in respect wit11 tile following variables :
- price of nieat in the Belgiuni niarket; - price of fish o n the Belgian niarket; - per capita income of Belgiuni.
Tlie relatiorisliip of iniport demand of Indonesian slirinip by the Belgian niarket was found to be negatively significant correlated in with a exclia~ige rate of Belgian Frank to the US Dollar, and negatively insignificant the slirinip produc- tion in belgiuni.
0 1 1 the basis tlie regression a~lalysis, i t was found that the iniport deniand of tile Indonesian shrinip o n the Belgian market is significantly affected by the varia- tion of tile exchange rate, the price of nieat in Belgium, the price of fish in Bel- gium, arid the production level of slirinip in Indonesia.
Of the six variables which are proposed in the n~odel i t was found that, per capita income in Belgium is tile most significant variable in affecting the variation in iniport deniand of the Indonesian shrimp by Belgium.
These findings also suggest that fish and nieat are the substitute for shrimp, and slirinip is a normal good, because the demand is increasing with respect to the increase in the per capita income.
Using the per capita income of Belgian Frank to The US dollar as an predic- tor, i t is estimated that up to the year 2000, the import deniand of Indonesian shrinip by the Belgian market is expected to be growing with the expected average growth of 8.9 percent per annum.
REFERENCES
Ackefors, Hans. A Regional Survey of the Agriculture Sectors in Eastern and Northwestern Europe. United Nations Development Program
-
Food and Agriculture Organization of the United Nations, Rome 1989.Bank Bumi Daya
-
Economic Review. Vol. XVINo 4 Decmmber 1990.Biro Pusat Statistik. Indikator ekonomi : Indeks harga. January 1991, BPS, 1991.
Bijzondere Raadgevende Commissie voor de Visserij. De evolutie an de Bel- gische Visserij sector in 1989. Centrale Raad voor Het Bedrijfsleven, Oostende, 1990.
Djojohadikusumo, S. Perkembangan Ekononli Indonesia selama enlpat Tahap Pelita 1969170
-
1988189. Canter for Policy Studies (CPS). Jakarta. 1991.Ferdouse. F. Asian Shrimp Situation : Infofish International 1/90 Kuala Lumpur. 1990.
FIIU. International Trade in Fish and Fishery Products INFOFSH Marketing Digest No I I 87, Kuala Lumpur 1987.
Gonarsyah. I. M Econonletric Analysis of the US
-
JAPAN-
KOREA Market for US White Wheat. Departnlerlt of Agricultural and resource Econonl- ics - OREGON STATE UNIVERSITY 1983.Gu~larsson. M. Changing Ground fish patterns in Europe. Infofish International 5 / 90, Kuala Lumpur, 1990.
Iman, R.L. and Conove. W.J. Modern Business Statistics John Willey and Sons. Inc. Singapore, 1983.
Ku-Chai Chong : Asian Shrimp Aquaculture at cross road Infofish International
5 190, Kuala lumpur. 1990.
Kotler. P. Principle of marketing, third Edition Prentice hall International editions, Englewood cliffs, New jersey, 1986.
Can1hert.R. Value added shrimp Product in Europe Info fish International 5 190. Kuala Lumpur. 1 990.
National lnstituut voor de Statistic. STATISTICS TIJDSCHRIFT, Nummer 6.77r jaargang. Brussels, 199 I.
National lnstituut voor de Statistiek : Landhouw Statistirken Maand- scrift. Juli-Drcrnihrr 1991. Brussrls, 1991.
Rackowr. R. Shrimp
-
slower growth toward 1990. Info fish Marketing Digest No 1 ; 53. Kuala Lumpur, 1983.Rrtnowati. N. A ~ i a l y s r s rkononii Udang Indonesia di pasar Jrpang Tesis Fakultas Pasca sarjana. lristitut Perta~~iari Bogor, 1990.
S~iiitli ii11CI Ravel Saltz. Fishery Trade hetwerri the EEC and Drveloping
Coul~trirs. I~ifo tisli I ~ ~ t e r ~ ~ a t i o ~ i a l 5 1 87. Kuala Lumpur 1987.
Tonirk, W.
G.
and Rohinsori, K.L. Agricultural Product Prices. Second Edi-tiolis.
Van Eys,S. Shrimp Market Trends and Cl~aracteristics
-
USA and Europe, Info fish Marketing Digest No 6 186. 1986.Sullarto. Analisa Permintaan dari Ekspor Tell Indonesia Tesis. akultas Pasca Sarjana. U11iversitas Gajah Mada . Yogjakarta. 1989.
Van Eys.S. The Shrimp l~idustry in the Asia 1 Pacific region Info fish Marketing D i p s t 110 1 / 85. Kuala (lumpur). 1985.
The Indonesian Economy. An11ua1 review vol. X I no 1. January 1991. Canter for Policy Studies (CPS). Jakarta. 1991.
Indonesian Foreign Trade Statistics, Jilid I VOL. 1 . 1988 and 1989. Biro Pusat Statistik. Jakarta, 1989.
Laporari Bulanan April & Agustus 1990. Direktorat Jrndral Perikanar~ Depanemen Pertanian RI. Jakarta. 1990.