A Simple Instrumentation System for Large Structure
Vibration Monitoring
Didik R. Santoso
Division of Instrumentation, Physics Department, Brawijaya University Jl. Veteran 2 Malang 65145; Telp. +62-341-575833, Fax. +62-341-575834
Email: [email protected]
Abstrak
Sistem instrumentasi tradisional yang digunakan untuk monitoring vibrasi bangunan infrastruktur skala besar seperti jembatan, rel kereta api, dan sejenisnya, umumnya mempunyai desain yang kompleks. Menjadikannya sederhana akan sangat bermanfaat baik dalam segi harganya yang murah maupun pemeliharaannya yang mudah. Makalah ini menjelaskan bagaimana mengembangkan sistem instrumentasi tersebut. Sistem dibangun berbasis jaringan sistem terdistribusi dengan topologi field-bus, menggunakan arsitektur single master multi slaves. Master merupakan unit pengendali, dibangun berbasiskan sebuah PC yang dilengkapi dengan antarmuka RS-485. Slave merupakan unit sensing, tiap-tiap unit slave dibangun dengan mengintegrasikan sebuah sensor vibrasi 3-sumbu dengan sistem akuisisi data berbasis mikrokontroler. Sensor vibrasi didesain menggunakan komponen utama sebuah MEMS accelerometer. Sementara perangkat lunak dikembangkan untuk dua fungsi; sebagai pengendali sistem perangkat keras dan pemrosesan data. Untuk menguji kinerja sistem instrumentasi yang dikembangkan, beberapa uji laboratorium telah dilakukan. Hasilnya menunjukkan bahwa sistem memiliki kinerja yang cukup baik.
Kata kunci: Sistem instrumentasi, MEMS accelerometer, Mikrokontroler, Sistem terdistribusi.
Abstract
A conventional instrumentation systems in monitoring vibration of large-scale infrastructure building such as bridges, railway, and others structural building, generally has a complex design. Makes it simple would be very useful both in terms of low-cost and easy maintenance. To make system become simple, low cost, and easy in maintenance, this paper proposes a distributed network for implementation system. The system consists of field bus topology, using single-master multi-slave architecture. Master is a control unit, built based on a PC equipped with RS-485 interface. Slave is a sensing unit; each slave is built by integrating a 3-axis vibration sensor within a microcontroller based data acquisition system. Vibration sensor is designed using the main components of a MEMS accelerometer. The software is developed for two functions; a control system hardware and a data processing. To verify performance of the developed instrumentation system, several laboratory tests have been performed. The result shows that the system has good performance.
Keywords: Instrumentation system, MEMS accelerometer, Microcontroller, Distributed system.
1. Introduction
The aim of structural health monitoring (SHM) is to provide periodic or continuous inspections of structural members to get current data for verification if the structure is under a load, behaves unusually, or damaged [1]. The SHM covers a broad field that encompasses a number of synergistic technologies that together can provide a system. Viewed from the aspect of instrumentation system, SHM at least has three main parts; sensor technology, data acquisition topologies, and network architecture [2].
advantage is its small size, compact, sensitive, lightweight, and relatively cheap [6], [7]. MEMS accelerometer is also available in commercial markets in various types, including those that had 3-axis sensing. And then measurement of vibration in three directions (XYZ) can be performed only by using a single MEMS sensor.
The other hand, the application of the microcontroller-based instrumentation system recently has been growing [8], [9]. In the development of modern instrumentation systems, the use of microcontrollers as the brains of the data acquisition system is commonly done. It has small size, programmable, simple, reliable and low-cost. The use of microcontroller in hardware design can improve performance, simplify design and implementation.
Furthermore, a commercial SHM Instrumentation system usually has complex design and then very expensive. Therefore, development of the system in the simple way and low-cost in budget is desirable and challenge for researchers. This is useful not only for in truth simple and low-cost application, but also to conduct research activities in the structural safety system. In this research,a simple and inexpensive instrumentation system, which may be useful for on-line distributed 3-axis structural vibration monitoring has been developed.
2. Description of the System
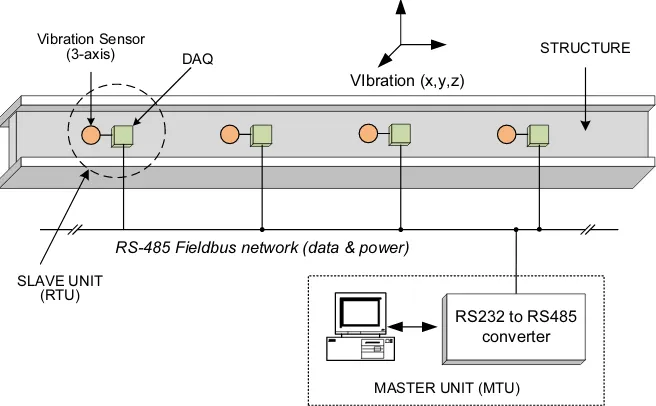
Usually SHM instrumentation using a distributed system architecture, it is an open and standardized system to bring varieties of sensors under one umbrella. The system is powerful for large area of measurement, due to distributed burden, easy system growth, lower possibility of data losses, and easiness of measurement of simultaneous events [10]. Figure 1 shows the architecture of the developed system. The system builds on a multi-drop network topology with single-master multi-slave architecture. It has consists of single master unit (called as master terminal unit, MTU), and several slave units (called as remote terminal unit, RTU). MTU is control unit and RTU is sensing unit. Communication between MTU and RTU is conducted through RS-485 bus system, which meets the requirements for a truly multi-point communications network, and the standard specifies up to 127 nodes even more on bus. Maximum cable length can be as much as 1200 m and can be either half-duplex or full-duplex. This architecture has the advantages such as high noise immunity and fast signaling rate, up to 115.200 kbps even more [11].
SLAVE UNIT (RTU)
RS-485 Fieldbus network (data & power) Vibration Sensor
(3-axis) STRUCTURE
VIbration (x,y,z)
DAQ
RS232 to RS485 converter
MASTER UNIT (MTU)
Figure 1: System architecture
that no more than one RTU transmits at any one time on the network. In this design, the MTU contacts a particular RTU by transmitting its address number, followed by a command, for example sampling time, number of data sampling, etc. All RTU hear the address number and ignore any command not addressed to them. RTU device with matching address sends its address to the MTU device as a confirmation of successful transfer and receives data, so lets the MTU know that it is alive and well. In case that RTU device does not send its address in some specified (time out) period, MTU will declare the RTU. After RTU get its correct address from MTU, then internal process for data acquisition is beginning soon. Figure 2 shows flow chart of communication procedure between MTU and RTU.
Start
PC Initialization
Sending RTU address (ID)
Check ACK
Sending commands
Check ACK
Start
Microcontroller Initialization
Receiving RTU address (ID)
Check ID No Sleep,
Yes No
Receiving commands Sending ACK
Yes
Sending data
Stop Internal process
for DAQ Sending ACK
Receiving data
Stop Yes No
MTU RTU
Until restart (RES)
Figure 2: Flowchart of the RTU-MTU communication procedure.
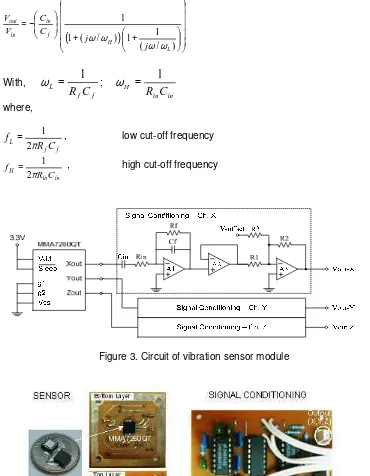
3. Design and Implementation 3.1. Vibration Sensor Module
(1.5, 2, 4 and 6g). Zero-g offset full scale span and filter cut-off are factory set and require no external devices. More detail about MMA7260QT can be found in [12].
For the purpose of signal filtering, amplifying, and level adjustment, it is necessary to build a suitable signal conditioning circuit. Signal conditioning circuit consists of a band pass filter (BPF), voltage buffer and amplifier, and voltage level adjustment (DC-offset). BPF circuit serves to eliminate the static DC output voltage of the sensor (it is sensor characteristics) and also blocks the high frequency noise. BPF transfer function of the circuit is given by:
(
)
+ + − = ) / ( 1 1 ) / ( 1 1 L H f in in out j j C C V V ω ω ω ω (1) With, f f LC
R
1
=
ω
; in in HC
R
1
=
ω
where, f f L C R fπ
2 1= , low cut-off frequency (2)
in in H C R f π 2 1
= , high cut-off frequency (3)
Figure 3. Circuit of vibration sensor module
Voltage level adjustment is used to make the conditions for the output signal from the sensor module in the range of 0-5 volts, as required by the data acquisition system. In addition, the signal conditioning circuit is made of 3 pieces for conditioning the output of each axis accelerometer, ie, X, Y, and Z. The prototype of 3-axis vibration sensor module, which consists of MEMS accelerometer and signal conditioners are given in Figure 4.
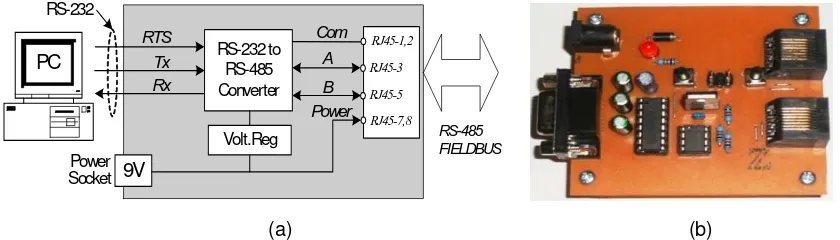
3.2. Hardware of the MTU
In the master-slaves architecture, MTU perform configures the system, hold controls activities in the whole system, display measuring data and status of the system. Hardware of the MTU is standard PC (with serial port RS-232) supported by RS-232 to RS-485 converter (Figure 5). The function of the RS-232 to RS-485 converter is to make possible serial port as multi-point communication ports. The RS-232 to RS-485 converter is made by using IC HIN232 (Intersil) and MAX485 (Maxim Semiconductor). In addition, if the PC has not RS-232 serial port (USB ports only) then it can be handled by using a USB to serial converter. This device can be found in the commercial market easily.
In half duplex communication procedure, organization of sending and receiving data must be regulated to avoid interference of data during transfer. So, the system must have a driver to determine flow control of the data, being sending or reception. In the proposed module, this is implemented by using the Request to Send (RTS) signal, which is one of the serial port signals. Setting the RTS signal to a high-state (logic 1) will enable the RS-485 driver. This means the MTU in the status of ‘sending’. Otherwise, setting the RTS signal to low state (logic 0) puts the driver into the tristate condition, this mean MTU in the status of ‘reception’. In addition, mechanical connection between MTU and RTU is performed by RJ-45 socket. This socket contains of six lines within a single UTP cable. To simplify the system, the power supply in this network is centrally powered by 9 volt from this unit. In the slave module, the voltage will be reduced and regulated to 5 volts corresponding to an electronic system. Figure 5b shows prototype board of the developed hardware. Mechanical connection between MTU and RTU is performed by RJ-45 socket. This socket contains 8-wires within single Unshielded Twisted Pair (UTP) cable, but only 6-wires used in the system, as explained above.
Power Socket
RS-232 to RS-485 Converter
Volt.Reg
A
B Com
Power Tx
Rx RTS
RS-232
RJ45-1,2 RJ45-3 RJ45-5 RJ45-7,8
9V
RS-485 FIELDBUS
PC
(a) (b)
Figure 5. The Master Unit (MTU): (a) Block diagram, (b) Prototype board
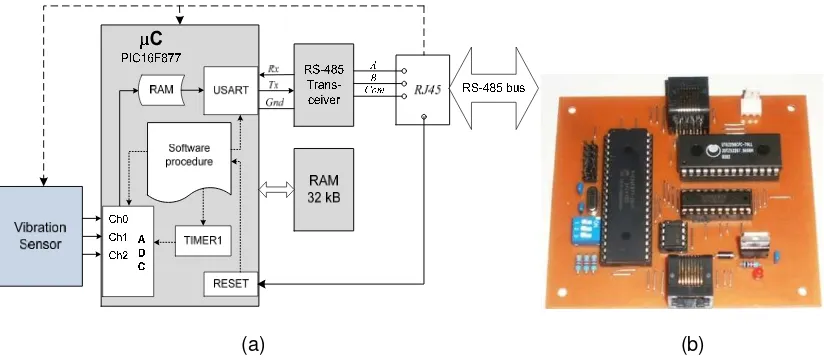
3.3. Hardware of the RTU-DAQ
The Slave Unit (RTU) plays key role of the system as a sensing unit. Hardware of the RTU can be divided into two modules, vibration sensor module (as described above) and data acquisition (DAQ) module. DAQ module developed based on PIC16F877 microcontroller. It has some features inside such as 8-channels ADC with 10 bits resolution, TIMER, USART, 8K x 14 words of flash program memory, 368 x 8 bytes of RAM and so on [13]. The RTU also equipped with RS-485 network interface to perform communication with master unit (MTU). Figure 6 shows the block diagram of the slave unit which is developed in this research.
Moreover, the RTU has the following assignments:
• Data acquisition module provides 3 analog channels input to serve the sensor output. The output voltage of the sensor (analog) is converted into a digital code with a resolution of 10 bits. Internal tasks, such sampling rate selection, are managed through microcontroller program procedures.
• The network communication interface is handled by IC MAX485 to perform RS-485 communication. Communication flow is regulated by microcontroller program procedure. • If necessary, digital data of vibration measurement can be stored temporarily in external
memory (RAM) before the data is sent to the Master Unit.
(a) (b)
Figure 6. The RTU-DAQ module: (a) Block diagram, (b) Prototype board
3.4 Software for Signal Processing
Software for signal processing offers procedures that capable to be used for amplitudes calculation and frequency determination.
3.4.1 Amplitudes calculation
Procedure for calculates amplitudes employ principle of peaks detection of the signals. Maximum and minimum peaks are first determined by scanning every data sampling. By make comparison one to another data sampling, maximum and minimum values of data sampling will be found. The amplitude value is differences between maximum and minimum voltage values. Therefore, in fact amplitude in this case is voltage from peak to peak (Vpp).
3.4.2 Frequencies determination
In the field of signals analysis, to change the signal from the time domain to the frequency domain usually uses the Fourier transforms. The role of Discrete Fourier Transform (DFT), N real data value in the time domain transform by DFT to N complex data value in the frequency domain, the DFT value X(k) is given by [14]:
∑
− = Ω −=
=
1 0)
(
)]
(
[
)
(
N n nT jk Dx
nT
x
nT
e
F
k
X
(4)If real and imaginer components are following:
∑
− =Ω
=
1 0)
cos(
)
(
)
(
N nT
kn
nT
x
k
R
, and∑
then by normalized, it is obtained
[
]
21 2
2
(
)
(
)
1
)
(
R
k
I
k
N
k
X
=
+
(6)Equation (6) is formula to coverts a signal from the time domain to the frequency domain, which is used in this project.
4. Results and Discussion
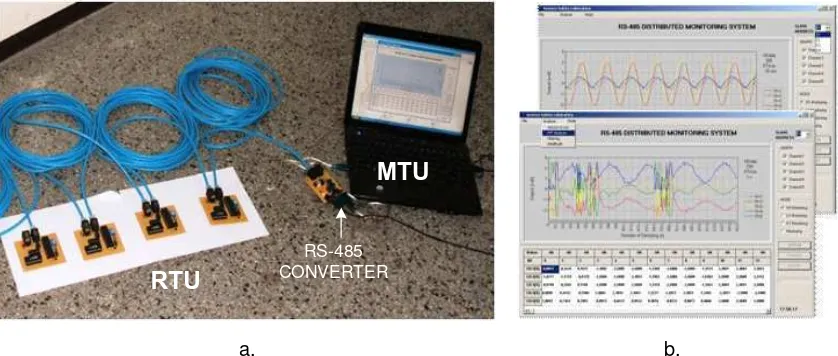
Figure 7a shows the photograph of the developed instrumentation systems as distributed network system. The system consists of one master unit and four slave units, which connect to each other in a fieldbus network. In this figure, master unit is performed by PC (laptop) equipped by RS-232 to RS-485 converter, while slave unit is performed based on microcontroller. Although it only four RTUs developed in this project, but the addition of the RTU can be easily carried out by giving the new address for the new RTU device by ‘plug and play’.
In figure 7b, monitoring display is shown. This figure is the measured data taken from RTU with address number {01}, these signals are produced by fatigue testing machine. While the lower display is the measured data taken from RTU with address number {04}, these signals are produced by hand made vibration. The sources of vibration signal in this case are just an example to prove that the developed instrumentation system has been functioning well.
MTU
RTU
RS-485 CONVERTER
a. b.
Figure 7. The developed instrumentation system and it’s display, (a) Photo of the developed instrumentation system, (b) monitoring display
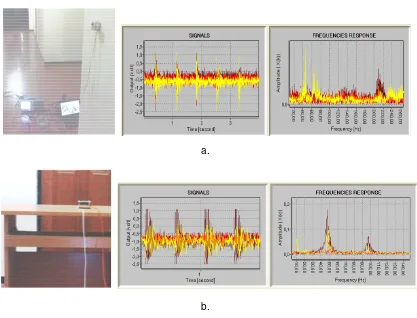
Furthermore, Figure 8 shows the experiment setup to determine the performance of vibration sensors. In this experiment, vibration sensors used to measure spring vibrations (Hook’s law). The purpose of this experiment is to know the performance of the sensor at low frequencies measurement. In the middle and right side of these figure are graph of experiments results. Graph of time series vibration can be monitored clearly on all three axes of vibration, simultaneously. Amplification 1X and 10X which is performed by signal conditioning circuit also function properly. And the last, developed software to determine the frequency of vibration has also been working well. With these results it can be concluded that the system work well, especially at low frequencies measurements.
measure the vibration on the table, sensors attached on the table with the position in as shown in Figure 9.
EXPERIMENT SETUP
3-Axis Vibration
Z-Axis, 1X Z-Axis, 10X
Figure 8. Vibration sensor performance test
a.
b.
Sources of vibration generated from the edge of the table in the longitudinal direction (X-axis) using the rubber hammer. Data were collected on all three axis vibration (X, Y, Z) simultaneously. To measure the vibration of the wall, the sensor attached to the walls of the building on eye side (Y-axis). Sources of vibration generated by using the rubber hammer in Z-axis direction of the sensor. Data were collected on all three Z-axis vibration (X, Y, Z) simultaneously, and recorded by using the developed system. Results of the experiments can be shown in Figure 9 at middle and right side of the figure. From the results of these experiments, it appears that the form of vibration signals on tables widened if its compared to vibration signal on the wall. This shows that the wall is more rigid compared to tables. However, for better analysis, of course, it is required more specific experiments.
5. Conclusions
Continuously operating instrumented structural vibration monitoring systems is becoming a practical alternative to replace visual inspection for assessment of large-scale structural condition. However, design instrumentation system in the simple way and low cost in budget is a great challenge for researcher. This paper offers simple and low cost instrument system for on line structural vibration monitoring. The system was built based on RS-485 network topology with single-master multi-slaves architecture. Physical parameters e.g. structural vibration is detected by using MEMS accelerometer based vibration sensor. Data acquisition system was developed based on microcontroller. Several tests have been carried out in laboratory scale. The system demonstrated has ability to measure and monitor three-direction, multi-places vibration of structural members by on line, as distributed instrumentation system.
References
[1] Omenzetter P, Brownjohn JMW, Moyo P. Identification of unusual events in multi-channel bridge monitoring data. Mechanical System and Signal Processing. 2004 18(5): 409-430. [2] Herman VA, Bart P. Sensor and systems for structural health monitoring, J. Structural
Control. 2003; 10(2): 117-125.
[3] Adewuyi AP, Wu ZS. Vibration-Based Structural Health Monitoring Technique Using Statistical Features from Strain Measurements. ARPN Journal of Engineering and Applied Science. 2009; 4(3): 38-47.
[4] Peter CC, Alison F, Liu SC. Review Paper: Health Monitoring of Civil Infrastructure. Structural Health Monitoring. 2003; 2 (3): 0257-267.
[5] Caleb W, Brendan W, Henry CH, Li, Israel H, Adrian PM. Vibration based structural health monitoring of adhesively bonded composite scarf repairs, 5th Australian Congress on Applied Mechanics (ACAM). Brisbane, Australia. 2007.
[6] Joel R, William L, Cleghorn, James KM. Design and analysis of a low frequency MEMS vibration sensor for automotive fault detection. International Journal of Vehicle Design. 2010; 54(2): 93-110.
[7] Jung YK, Soon WK, Hyun SY, Moon YC. Development of MEMS-Based Vibration Sensor for Tunnel Construction and Maintenance Monitoring System. 22th International Symposium on Automation and Robotics in Construction (ISARC), Ferrara, Italy. 2005. [8] Al-Dhaher AHG. Integrating hardware and software for the development of
microcontroller-based systems. Microprocessors and Microsystems. 2001; 25(7): 317-328.
[9] Miodrag B, Vujo D, Branko S. Distributed measurement and control system based on microcontrollers with automatic program generation. Sensor and Actuator A. 2001; 90(6): 215-221.
[10] Sandip P, Rakshit A. Development of network capable smart transducer interfaces for traditional sensors and actuators. Sensor and Actuator A. 2004; 112(8): 381-387.
[11] Maxim-Dallas Semiconductor. Using RS-485/RS-422 transceivers in Field bus networks. available on http://www.maximic.com.appnotes.cfinlappnote_numberl1833
[12] Freescale, MMA7260Q XYZ Three-Axis Low g Acceleration Sensor,
[13] Anonymous. PIC16F87X data sheet 28/40-pin 8-bit CMOS Flash Microcontroller. Microchip Technology Inc., 2001.