Proceedings of
the 34
th
Asian Conference on
Remote Sensing 2013
Bali – Indonesia, October 20 -24, 2013
Indonesian Remote Sensing Society
and
Editorial Boards:
Gatot H. Pramono
Dadan Ramdani
Baba Barus
Reiza M. Ariansyah
Reviewers:
Baba Barus (IPB)
Gatot H. Pramono (BIG)
Fahmi Amhar (BIG),
A. Anugrahadi (Univ Trisakti)
Albertus Deliar (ITB)
M. Rokhis Khomarudin (LAPAN)
Wikanti A (LAPAN)
Projo Danoedoro (UGM)
Mulyanto Darmawan( BIG)
Muhammad Evri (BPPT)
Yudi Setiawan (IPB)
Chusnul Trijudianto (LAPAN)
Dadan Ramdani (BIG)
Proceedings of the 34
thAsian Conference on Remote Sensing 2013
ISBN: 978-602-9439-33-5
Indonesian Remote Sensing Society
Masyarakat Ahli Penginderaan Jarak Jauh [MAPIN] Jl. Raya Jakarta – Bogor Km 46 Cibinong, Indonesia Phone: +62-(0)-812-110-3127
Foreword
The 34thAsian Conference on Remote Sensing 2013 is held from October 20 to 24, 2013 in Bali, a beautiful resort of Indonesia. The main theme of the 34th ACRS is “Bridging Sustainable Asia”. ACRS is one of the largest remote sensing conferences held once a year in Asia. This is the second time for Indonesia to organize ACRS. The last time was in 1987 in Jakarta. The Conference is jointly organized by Indonesian Society for Remote Sensing (ISRS/MAPIN) and Asian Association on Remote Sensing (AARS)
This year, the number of abstracts submitted to the 34th ACRS was over 1000. This reflects the expectation of the world remote sensing community to the 34th ACRS. Until to closing date of submission complete paper, we have received total 900 complete papers. All these complete papers are presented in this Volume 1 of Conference Proceeding. We will also produce the Volume 2 of Conference Proceeding to accommodate the remaining complete papers after the Conference.
This digital proceeding book contains all the complete papers derived from Sessions, Special Sessions, and Workshops, both oral and poster presentations. The topics of paper ranges from Sensor and Platform, Methods development and image processing, Environmental Science, Natural Resources, Hazards, Social economic sciences and policy, Health Science, Educations, Geographical information system & remote sensing, input, GPS and Global Navigation Satellite Systems, and Mapping.
Finally, we thank for all participants and colleagues who contribute in producing this Proceeding CD from paper authors, editors, printing and other. We realize that some parts of the CD content may be improperly managed, and we apologize for any mistakes. Hopefully, this digital proceeding may succeed in representing our remote sensing technology advancement and society in Asia and some other parts in the World.
Bali, 14 October 2013
Dewayany Sutrisno
ANALYSIS OF SETTLEMENT GROWTH BASED ON
POLYGON FRAGMENTATION AND ITS EFFECT ON DISCHARGE
IN THE UPPER CILIWUNG WATERSHED, BOGOR, INDONESIA
Khursatul Munibah1* and Boedi Tjahjono2
1
Department of Soil Science and Land Resources, Faculty of Agriculture, IPB. Jl.Meranti, Darmaga, Bogor. [email protected]
2
Department of Soil Science and Land Resources, Faculty of Agriculture, IPB. Jl.Meranti, Darmaga, Bogor. [email protected]
ABSTRACT
Most of Regional Spatial Planning (RTRW) in Indonesia has allocated settlement areas (including economic activities) along the road. The road of Bogor-Puncak situated in Upper Ciliwung Watershed is one of example, and by time the settlement has been growing rapidly. It can be seen clearly by comparing the settlement map from 1981, 1985, 1994, 2001, and 2010. The distribution of settlement from 1981 and 1985 has been mapped from aerial photographs, scale 1:50.000, whereas the others has been interpreted visually from Landsat images (1994, 2001, 2010) and supported by Ikonos images (2010) and ground check. The aims of this research were to analyze settlement growth using polygon fragmentation and its effect to river discharge in Upper Ciliwung Watershed. The Ciliwung river discharge data (1981, 1985, 1994, 2001 and 2010) has been collected from Katulampa’s hidrological station (Center for Ciliwung-Cisadane Water Resource Management), and settlement’s polygons fragmentation were analyzed using Patch Fragmentation Software. The result showing that coverage of settlement (CA) and polygon’s number (NumP) increased continually during from 1981 to 2010. It is indicate that the settlements has been growing in high fragmentation. But the size of settlement polygons was varying because of unbalance growth of every individual polygon. It was showed by the varying value of mean polygon size (MPS) and increasing value of polygon size standard deviation (PSSD). The polygons shape of settlement were not perfectly geometric (MSI >1) but tend to simplified by time indicated by decreasing value of mean perimeter/area ratio (MPAR). The distribution of settlement is quite well refering to RTRW’s law, since 86.4% of settlement polygons fit to RTRW’s law. However, the growth of settlement has significantly affected Ciliwung’s river discharge (surface runoff) on Katulampa station showing by the value of r2 = 0,894.
Keywords: Settlement, Fragmentation, Discharge, Upper Ciliwung Watershed
INTRODUCTION
In 1980’s the growth of settlement in the Upper Ciliwung Watershed increased rapidly. Consequently, impermeable land surface area has also grown significantly. This condition will affect in two aspects of hydrology i.e. the surface runoff or fluctuation of Ciliwung river discharge and decreasing the function of watershed as recharge area. The inundation disaster occuring every rainy season in Jakarta could be provoked by this situation.
The Upper Ciliwung Watershed, the so called Puncak Area, is one of well known places for tourism, possessing beautiful panorama, such as tea estate plantation and fresh air of montainous area. The place can be reached easily, since the Bogor – Bandung principal road, the so called “puncak road” pass by. As a tourism area, land use change along the road quite rapid dominated especially by settlement, although it fit with the Regional Spatial Planning (RTRW).
Wade et al. (2003) state that an object continuously breaks into an increasing number of smaller pieces by external driving, called fragmentation. Forest fragmentation, for example, is the process of breaking up large patches of forest into smaller pieces. Any land-use change can potentially result in fragmentation, but the extent of the impact will depend on the type of change, the degree of fragmentation, and the specie involved (Thomson, 2005). Patch fragmentation is relatively simple analysis, since it can be applied on the polygon or grid data. For this study the polygon data will be applied and the term of polygon fragmentation was used.
Proceedings of ACRS 2013
This research will just focus on settlement fragmentation analysis, since settlement is an irreversible land use or almost not rechange to the pervious land use. The research use remote sensing data from 1981, 1985, 1994, 2001 and 2010, and located in the Upper Ciliwung Watershed. The aim of this research were (1) to analyze the settlement growth based on polygon fragmentation and its distribution in conjuction with Regional Planning (RTRW), and (2) settlement growth effect on river discharge.
MATERIALS AND METHODS
Study Area
Figure 1. Location of study area
The study area (Fig. 1) is located in Upper Ciliwung Watershed (Bogor Regency and Bogor City), and has coordinate of 6° 37’ 48’’- 6° 46’ 12’’ S and 106° 49’ 48”-107° 0’ 0’’ E. The total area cover 14.920 ha, comprising several sub-Regency (Kecamatan), such as Ciawi, Cisarua, Megamendung, Sukaraja, Sukamakmur (Bogor Regency) and Bogor Timur (Bogor City). The outlet of Upper Ciliwung Watershed is marked by a small dam, namely Katulampa Dam. The discharge fluctuation data of Ciliwung river is available in Katulampa Hydrological Station (Gate).
Data and Data Processing
The settlement maps of 1981 and 1985 have been interpretated from Aerial Phofograph, scale of 1:50.000 and those of 1994 and 2001 derivated from Landsat images and were supported by Ikonos images of 2010. The discharge data of Upper Ciliwung Watershed (1981, 1985, 1994, 2001 and 2010) were
obtained from Katulampa Gate or Center for Ciliwung-Cisadane Water Resources Management (Balai
Pengelolaan Sumberdaya Air Ciliwung-Cisadane, Bogor), and Software of Arcview and Polygon
Fragmentation have been used for data processing. Briefly, all steps of research can be seen in Figure 2.
Figure 2. Flowchart of research
Proceedings of ACRS 2013
All remote sensing data were interpreted visually to obtain the settlement maps and the gound check has been done to support the result of interpretation. In this research the analysis of settlement growth has been done based on polygon fragmentation index, that can be seen in Table 1.
Table 1. Polygon Fragmentation Types
PolygonFragmentation types Definition
CA Class Area Sum of areas of all Polygones belonging to a given class (hectar)
Polygon Density & Size Metric:
NumP Number of Polygon
Total number of Polygones in the landscape if ‘Analyze by Landscape’ is selected, or Number of Polygones for each individual class, if ‘Analyze by Class’ is selected.
MPS Mean Polygon Size Average/mean Polygon size (hectar)
PSSD Polygon Size Standard Deviation Standard deviation of Polygon areas (hectar)
Edge Metric
TE Total edge Sum of perimeter of Polygones (metres)
MPE Mean Polygon Edge Average amount of edge per Polygon. MPE = TE/NumP
(metres/Polygon) Shape Metric
MSI Mean Shape Index
Shape Complexity.
MSI is greater than one, MSI = 1 when all polygones are circular (Polygon) or square (grids).
MSI = sum of each Polygones perimeter divided by the square root of Polygon area (hectares) for each class (Class Level) or all Polygones (Landscape Level), and adjusted for circular standard (Polygons), or square standard (grids), divided by the number of Polygones (McGaril and Marks 1994).
MPAR Mean Perimeter Area Ratio Shape Complexity. Sum of each Polygon perimeter/area ratio divided
by number of Polygon (metres/ha) Source: Manual of patch analysis software (http://flash.lakeheadu.ca/~rrempel/patch/.)
The analysis of fitness between actual settlement and the RTRW’s map obtained by Geographic Information System (GIS) overlaying processes, and correlation function were used for correlatiton analysis between settlement growth and discharge fluctuation.
RESULTS AND DISCUSSION
Setllement Growth based on Polygon Fragmentation Analysis
Figure 3. Class/Settlement Area
According to the result of analysis, the setllement in the Upper Ciliwung Watershed has been growing rapidly as indicated by the increasing of settlement area in 1981, 1985, 1994, 2001 and 2010 (Fig. 3). The highest of increasing area occured in 1994-2001, of about 578,7 ha with the speed of growing 82,7 ha/year, but the smallest one occured in 1981-1984, of about 105,5 ha with the speed of growing 26,4 ha/year. For 1984-1994 period, the increasing area were about 443 ha with the speed of growing 37,1 ha/year and for 2001-2010 the increasing area were about 381 ha with the speed of growing 42,3 ha/year.
Proceedings of ACRS 2013
It seem that the highest growing of settlement area in study area in accordance with Indonesian tourism promotion program, since study area is one of tourism destination. This settlement area growing was also represented by augmentation of total edge of polygon from 1981 to 2010 (Table 2).
In parallel with this phenomena, the settlement density has been augmented. It was represented by the increasing of settlement’s polygon. The augmentation of polygon’s number (NumP) can be seen in Table 2. In general there were an augmentation of NumP from 1981 to 2010, successively 160 polygons and 553 polygons. Increasing of area and number of polygon indicate that the settlement growing up in high fragmentation.
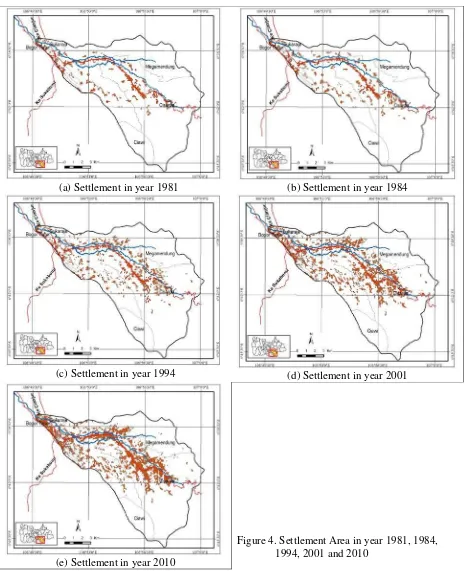
In period of 1981-1994 the growth of settlement dominantly indicated by new polygon, whereas in 1994-2010 showed by coalescent of polygons (Fig. 4). The value of mean polygon size (MPS) shows the same trend, where in 1981-1994 it tend to decrease but in 1994-2010 it gradually increase (Table 2). Spatially, the new polygons distributed away from the principal road (Puncak’s road), whereas coalescent of polygon just arround the principal road (Fig. 4). The different speed of growing between one place to another has also generated the variation of polygon size. These phenomena could be seen by the variation of standard deviation value (PSSD), where in 1981-1984 the value of PSSD decreased but in 1994-2010 it increased.
In connection with fragmentation, the polygon shape could be used for describing human intervention. Dewan & Yamaguchi (2009) in Giraldo (2012) indicate that in agricultural landscape, human intervention is seen as a progression toward geometrization and simplification of the ecosystem structure. The polygon shaped can be analyzed from MSI value, where if MSI value = 1 indicating that all polygon has circular shape, but if the MSI value > 1 it show others shapes (incircular). Regarding to the whole MSI has value > 1 (Table 2), it indicates that polygon edge is not simple or perfectly geometric, nevertheless, human high intervention of human could be seen from MPAR value tending to decrease by time. It indicate that polygon edge tend to simplification direction or still in progress.
In general it could be said that high fragmentation occurred in study area in parallel with settlement growth, where in period 1994-2010 the settlement growth fastly characterized by polygon coalescent along the principal road, whereas in previous period (1981-1994) the new polygon appear dispersedly. Spatial dynamic growth of settlement could be seen in Figure 4.
Table 2. Summary Statistics for the Polygon Fragmentation Types
Polygon Fragmentation Types 1981 1985 1994 2001 2010
CA Class/Setllement Area (hectar) 653,8 759,3 1093,3 1672,0 2053,1
Polygon Density & Size Metric
NumP Number of Polygon 160 236 387 482 553
MPS Mean Polygon Size (hectar) 4,1 3,2 2,8 3,5 3,7
PSSD Polygon Size Standard Deviation (hectar) 9,0 7,5 8,2 15,6 30,5
Edge Metric
TE Total Edge (metres) 172557,7 215417,7 335405,8 477764,6 506575,1
MPE Mean Polygon Edge (metres/Polygon) 1078,5 912,8 866,7 991,2 916,0
Shape Metric
MSI Mean Shape Index 1,756 1,754 1,737 1,752 1,747
MPAR Mean Perimeter Area Ratio (metres/hectar) 4,292 3,328 2,237 1,828 1,741
Figure 5 showed that most of actual settlement (86,4 %.) matched with land use allocation on RTRW map, and the rest scaterred in the protected forest area, the plantation area, the conservation forest area, and the annual crop area, successively 6,1%,5,6 %, 1.4% and 0,6%. The actual settlement in the protected forest area according to the national forest law (UU No.41/1999) should be rellocated to other place available but should refer to RTRW. Since the settlements and economic activities tend to grow along the road, the development of road in watershed should be minimized in order to protect the function of watershed as a recharge area.
Proceedings of ACRS 2013
(a) Settlement in year 1981 (b) Settlement in year 1984
(c) Settlement in year 1994 (d) Settlement in year 2001
(e) Settlement in year 2010
Figure 4. Settlement Area in year 1981, 1984, 1994, 2001 and 2010
Correlation between Settlement Area and Discharge
The maximum river discharge represented by rain intensity, the extent of watershed area, and coefficient runoff, where the values of the latter depend on land cover/use condition in watershed. According Coutu and Vega (2007) the urbanization tendency in the watershed entails significant increases in the production of surface runoff. Figure 6 represent the increasing tendency of surface runoff in relation to settlement growth in Upper Ciliwung Watershed, where the value of r2 = 0,894 representing a strong correlation.
Proceedings of ACRS 2013
Figure 5. Regional Spatial Planning Map (RTRW) compiled with actual distribution of settlement
Figure 6. Correlation between settlement area and river discharge
CONCLUSION
Based on the results and discussion above, it can be concluded:
1. The settlement in the Upper Ciliwung Watershed have already grown rapidly with high
fragmentation during periode year 1981 until 2010. It was showed by the increasing value of settlement area (CA) and the number of polygon (NumP).
2. The size of settlement polygons quite vary from one place to another because of unbalance growth of
individual polygon. It was showed by the various values of mean polygon size (MPS) and also
increasing polygon size standard deviation (PSSD) value.
3. Since to mean shape index value (MSI) > 1, it indicates that polygon edge of settlement is not simple or not perfectly geometric. Nevertheless, the intervention of human increase by time showed by decreasing value of MPAR, representing simplification of polygon edge going in progress. 4. For the growth of settlement significantly increasing the surface runoff, land conversion from
agriculture land to building areas in Upper Ciliwung Watershed should be limited in order to protect the function of watershed as recharge area.
REFERENCES
[1] Coutu W.G. and C.Vega, 2007, Impacts of land use changes on runoff generation in the east branch of the Brandywine Creek Watershed using GIS based hidrologic model. Midlle State of Geographer, (40) 142-149.
[2] Giraldo A.M, 2012, Spatial scale and land use fragmentation in monitoring water processes in the Colombian Andes. Applied of Geography, (34) 395-402.
[3]
McGarigal and Marks. 1994. Fragstats: Spatial pattern analysis program for quantifying
landscape structure. Reference manual. For. Sci. Dep. Oregon State University. Corvallis
Oregon 62 p.+ Append.
[4] Thomson M.J., 2005, Forest Fragmentation, Available online: http://www.ontarionature. org/discover/resources/PDFs/factsheets/fragmentation.pdf (accessed on 13 rd September 2013) [5] UU No. 41, 1999, about National Forest Law (Kehutanan), Jakarta.
[6] Wade Environmental Protection Agency, United State and Forest Service, Department of
Agriculture, 2003, Forest fragmentation: differentiating between human and natural cause, Available online: http://www.epa.gov/mrlc/pdf/forest-factsheet.pdf, (accessed on 13 rd September 2013)
Proceedings of ACRS 2013