ISSN 1881-4948
APPLIED HYDROLOGY
NO.23
2011
iF
3
セ
、bセ、bゥ、iセNッN
セ
セ
セ
Gイセ
セ
ZJ;
Applied Hydrology
No.23
セNァNLイLW ;I
:.-''1:-7
Iva-
.l'lh
,t:-
<I
iiIi!,je 'l\fj'tO):fif*'rilllJ
,. '"
··1セセJセJセセセセセセ
セセセセ
7I<#Ij!jj1!j ュセ
<I,
mAZョセZャZoIゥャセ'ill
Ji'!.i:jSj-fF4io704' -
セ ;llvjfaoIセCiiFQサ}HG[ZZQOiNQZイtャ^NBBBBBBBBᄋ11
NmJセセセN XュNᄆᄋNセ NᄋセュセN
Krissandi Wijaya .
,\II;
m!J..t£
jQ[[セmュAAZAjェui[Lェ・ヲャ}JセoIゥャjaゥャャゥptjャャゥゥャeZャZi[ZZT[エ
0 J&91;::
Pセ'c
21
..
QゥjヲゥA|ャエャTZィNヲヲャャGAGャGiiAセjAioiゥjヲセM・ZNMG_GM AjNNャJュセQxmᄋNャQLャャ|ZAjSfJl!&O)iTJ;l!?' A
ll!:illl:ill
;;::t
70
OO-j- A?' A?, AO)ftT,jeIth'Wl'lIH;::4;t ol>'I!'rill
l] 31セQゥjヲゥA|ャュセセiセセュ iセセヲオGセJセセ
ゥャゥャjiiセ^|ャcN
. 8mll\:M
ゥゥャeセoILェ・セゥャゥャ|NゥャG
6
jャNエZZA^ャュヲヲャLェ・ZゥャZoIセᆬサ、ェェ ···41セセクZNMGケケWケZNMG_Gセセセセ セ セAjSᄋlセュᄆ
OO±I'l'!;:::l
:.-'''tlv?,OyセセセエᄆJEft'l5z
セセセヲエJセセセセセN セセセD
MセゥᆬjエエヲャセZャhセiゥjiZmエュセoIャJAFoIヲャセェGエ 51
セwセJセセセN
セCJzᄋセセJセ
ゥゥャeセLェ・
'i{ilil\
セjQャ{ 0)t:-
It>
0)ll1',je lI!!i1I!ffl
'l:-71v
58
セQゥjヲゥA|ャi|yゥOャwiセセュ ゥャゥャjiiセ^|ャcN
.
iセNヲオXュャャ|ZmᄋセJセセ
mM£?'
aoIセセjjャeoIエセiエ^oIセLェ・iャjゥャゥ{セキイセDoIヲjAiセ·.. ·
·.. ·
·.. ·.. ·..
·67
ゥtセJセJセセᄃセセセiゥjヲセセ セセ セ
ゥtセJセセゥAhゥjャャACセM・O_GM
8JIIJ:m· <j;:mli5l*
ゥtセJセJDZセᄃセセセセセ inAZャセᆬ
ゥtセJDZセセN セセセM
Monitoring of Water Utilization and Water Balance on Agriculture Fields
in
nァ。ョェセEast Java, Indonesia
(4' /
r
-*
セWL'"
1"9 .l1,-j-:.-' '" "- /'
:7
±t!lllXl::::J3It 0 .l!J!IOlt!l1l\'O),jeflJffl I:: ,je1{](xO)llllI3!t)
76
jQエIェ[[セiJDZJセセゥQiANァNセセiゥjヲセC Liyantono
NmJDZセDZN Nセ セᄋL|ii[ュAjNNDᄋXュNᄆ
ltmJkxNo.n 2011 r:..-:.--.r.V?aTゥuNセNj
Applied Hydrology
Monitoring of Water Utilization and Water Balance on Agriculture Fields
in
Nganjuk, East Java, Indonesia
セセセJセWN
セセ_セセセセセセ
• •
セセセセ
• • •
JセJセヲヲャセ
JAFセセセセ
Liyantono·, Tasuku
KArn··,
Hisao KURODA··, Koshi YOSHIDA··• United Graduate School ofAgricultural Science, Tokyo University ofAgriculture and Technology (3-21-1, Chuuo,
Ami, lnashiki,lbaraki. 300-0393).
"Faculty ofAgriculture, Ibaraki University <3-21-1, Chuuo,Ami,lnashiki,lbaraki, 300(0393)
Liyantono' •
!JuHi1li"
,
ゥA|セrDB ,。セェャサᄆB'JI(:;;;:.!lI:k;;Ci!!il'Nセ_oZh (T 300-0393 セャ}ェHAiゥ|ャゥQゥャャャZャャQiャ|ゥjNャvNtGAGLJ] 3-21-1)
Bセャ}ェHZォ[[cN[[」ャャ|ャ (T 300-0393 セャ}ェHAiゥ|ャゥQゥャャャZャャQiャ|ゥj .l!.1IIT'!'
'*=
3-21-1)Abstract
In the dry season, water shortage has occurredinNganjuk, East Java, Indonesia. The northern area of Nganjuk irrigation blocks was drier than southern area, and downstream in southern area was drier than upstream area. Regardless the water shortage, the farmers of these areas would like to increase productivity, cropping intensity and fanner's income by using shallow and deep wells.Inthe future,the utilization of groundwater for irrigation canbe
impact to land subsidence and can compete with other uses of groundwater such as domestic and industrial. The estimation of groundwater uses for irrigation is required for sustainable water resource management and farmers prosperities.
Monitoring stations were installed in Nganjuk to analyze water balances. Shallow grOlmdwater levels were monitored at four irrigation blocks. The discharge rates were monitored in river reaches of upper. middle and lower streams. The monitoringdataof groundwater showed the tendency of recharge in rainy season and uptake indryseason. However, in southern area Mrican-Kiri block, the tendency was not clear. Groundwater levelsinthe southern area (Mrican-Kiri and Kuncir-Bodor blocks) were higher than those in nonhern area (Widas and Ketandan·Tretes blocks)in
dryseason. The rainfaU and discharge ratedatashowed that the infiltration and percolation were high in the beginning rainy season. Base flows were increasedinsecond month of the rainy season andpeakdischarge was around 6 nun d-I
in the upper stream and approximately 2 mm d-linwhole watershed.
Key words: groundwater. water shortage, conjunctive irrigation, monitoring
Jf
セ.{ ;,.- l'
-*
V7. セQB イケBWG[BMセ セ"P
jjBllIGl::Jov''(, ゥjエセiZZWi\GfIeャャGセAe l.-'(v'Qo WG[BMセ セ"P
Q)!iillt 7' p "P
I::Jov ,'( I;l:, jtll\l7' p "P
lllitillll7' p "P
J::セ 7I<'F)Ell1
01:'
<,
ll: t::itill\l7' p "P
I::Jov ,'( t Tilft l]j('t'I;Ll::ilftlllGJ::セ 7I<'FJEll10i:''''Ii(il/.
't'",Qo 7I<'FJEI:: t Il!lb I',-r.
セィ I',Q)7'p "P
I::Jov ,'( ,GQGAMNAャセi[ャZjjBT7I<Q)!&;7;-J:Ii'I:: J:: セ ZGeゥQャ\ゥGi[セL 1'F#IID'lii:, NAャセゥFj^LN セエエャAjo l.- J::
?
I:
;;1:;7;-'(v'
Qo¥-l-*,
セ Q)J::?
tti'llilltQ)t::!I:>Q)jjBT7I<Q);f1JJll!;l:, jjBti:ltTJ(>. ゥiAャゥQャ\セセAeヲPUjGAQWQ\
I:
qIヲエゥャGセUQ セ ゥゥAャセ T セI:
ャャGAAャQゥセ2=hQo
't
セ 't', jjBT 71< Q)iliiMJ'!I ifil::lllIl.- '(, j,Wlfiifllli tt7l<iiiJl(1'l!\!I:
NセiZZHoェ It7l<i&:>:セ Jlt!l:>Qo't
セ 't', 7I<i&:>:Q)t::!I:>'l';?"セ ;,.-!/;<'T-V
3 ;,.-H!j;J>,. l.-fto i'lIillt7' P'YP
セ 4MZ^QZZセャエL i<l<lIIjjBT7I<Q)jjBT7I<ilLHUlIl.-t::o fiiJ)III::Jo,''(t, J:, ,!" Tilftl::'('l';?"セ ;,.-!/H1"', ゥャヲエZ。セjャエAャZ^エZZッ jjBT7I<Q)'T -?" ll' 1',. ュセiZZjッL ''(It!!T7I<1l'iIfi*
2= h,
ゥjエセiZZjッカ GLHAF[W[MjZQゥGQャGZォセ<
ttQ
セI:
ll'iF2=
ht::
o l.-ll'l.-,itill\l7'P'Y
P
<7) A セ 71";"-'1"
セ 7'P "P
't'1;l:. 1jIj11M:f§l(Ojll'lt I',h-r,
ゥjエセiZZjッカ ,'( I;l:, itill\l7' P'YP
<7)jjBT7I<ilLl;l:jtll\l7'p "
P
J::セ ;lIj<
tt"?fto*-
ft, セュI:
fiiJJII ilftJt'T- ?" ll-I'" ュセqImQャャZ Qm'fjt)jl::llI:*=:all'ttl1. INTRODUCTION
Grain productionindry season is still important for regional sustainable development in Indonesia. Java is
the main production area forgraininIndonesia, where 53 percent of paddy and 55 percent of com from each total
production are produced (BPS, 2009). Agriculture in Jav.a mustbe conserved for sustainable food security in
Indonesia. For that purpose. improvements in land use and water management are needed.
The Nganjuk lies in a climatic regime characterizedbythe annual progress of rainy and dry seasons, and
receives approximately 80% of precipitation within the 5 to 6 months of the rainy season (December-May).
Nganjuk has flat area in central and eastern of Nganjuk with altitude raoging from 35 to 100 m ahove sea level.
MOWltainsarelocatedinthe southern and northern area. The agricultural production in Nganjuk was increased;In
1991, average cropping intensity
was
2.31 crops per year (BPS ofNganjuk, 1992), and iD 2001 itwas increased
and stable at 2.8 crops per year. Rice production was 414 metric tonperyear with productivity around 5.8 ton per
hectare and harvested area was71,893 hectare. Com production was 204 metric ton per year with productivity
around 5.8 ton per hectare and harvested area was 35.144 hectare. Soybean production was 17 metric too per year
with productivity arouDd 1.7 IDn per hectare and harvested area
was
10,091 hectare (BPS ofNgaDjuk, 2009).The Nganjuk lies in Brantas basin at Widas sub-basin. where is one of the threemajor tributaries of the
Brantas River in East Java Province. In Nganjuk, there are three planting season; wet season (WS,
November-February),
first
dry season (OSI, March-June), and secoDd dry season (DS2, July-OCtober). Paddyfields are cultivated iD WS and OS!. Sugarcane cultivated in WS, DS1, and DS2. Secondary crops (com, soybean,
red onion, chUies, melons and vegetables) are cultivated in DS I and DS2.
Water shortagehasoccurred indry season in all irrigation blocks. The northern area of irrigation block was
drier than southern
area.
The downstream in southern part area was drier than upstream area in dry season.Regardless of the water shortage, the farmers of these areas would like to increase productivity, cropping intensity
and farmer's income by using shallow and deep wells. The cash crop is important to increase farmer's income.
especially in dry season. These economic situation influences in the water balances. so it is important to analyze
water balancesinthe Nganjuk.
10 the future. the utilization of groundwater for irrigation can beimpactto land subsidence and can compete
withother uses of groundwater such as domestic and industrial. The estimation of groundwater uses for irrigation
is required for sustainable water resource management and farmers prosperities.
Anobjectives of this paper is to analyze monitoring data for water balances. For further research. the data could
beto develop a computer simulation model to propose a sustainable water resouce management and to increase
water utilization on agriculture fields.
2. STUDY AREA
The lowland
in
Nganjukisalluvial plain formed hy Widas River aDd Brantas River. Based OD hydrogeDlogymap (Pnespowardoyo, 1984), these areahasaquifer with medium andhigh productivity. Many irrigation wells
were constructedinNganjuk. The number of wells in village
was
varied from 0 to 606 wells per village and totalnumber of wells is 15,475 wells on around 200 villages.
-There are four main sub-basins, Widas. Kuncir. BodorandWarujayeng-Kertosono (Hg.l). There are two
tributaries, the Kedungsoko River and the Widas River. the Kedungsoko Riverisfor KuncirandBodor sub-basins,
and the Widas River is for Widas sub-basin. Those rivers were merged into Brantas River through
Warujayeng-Kertosooo sub-basin that is flat and predominatedbyagriculture field.
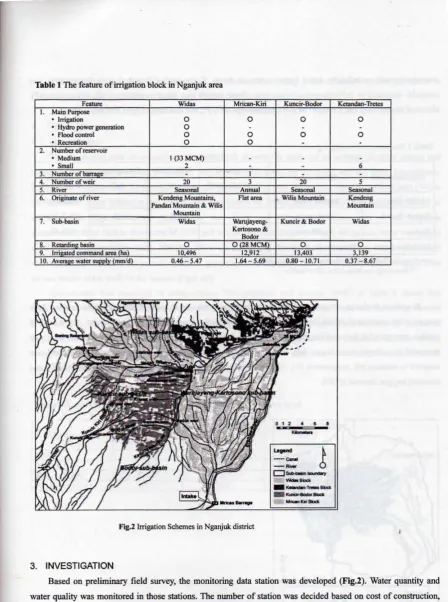
Inaddition., irrigation area in Nganjuk was divided four irrigation blocks. Thearea of irrigation blocks is
around 40,000 hectare. There are two main surface irrigation systems (Widas and Mrican-Kiri blocks) and two
local surface irrigation systems (Kuncir-Bodor and Ketandan-Tretes blocks). Each blockhascharacteristic depend
on the water supply system and geomorphology (see T.ble 1 and FIg.2). The main surface irrigation system has
infrastructure such as canal, reservoir, and water supply. The local surface irrigation haswatersupply from small
and seasonal rivers. Widas block lies in Widas sub-basin and supplied water from Beoing Reservoir and small
rivers in the block. Mrican-Kiri block is supplied water from Mricao barrage 00 Braotas River and lies in
Warujayeng-Kertosono and Bodor sub-basins. Kuncir-Bodor blockissupplied water from small rivers from Wilis
Mountain without reservoir and liesin Bodor and Kuncirセ「。ウゥョウN Ketandan-Tretes block is supplied water
from smaU rivers from Kendeng Mountains with
smaU
reservoirs and lies in Widas sub-basin. All of irrigationsystems in Nganjuk area are conjunction irrigation surface and groundwater irrigation and reusing drainage water
from upstreamarea.
--Rive<
C l - -
bou"""
C
Nganjukdistrict_35.100
!
_100·200 0200.400
_400-800
E
L.':S=:===:.E::===s=,!--,::_:;:::800:==-'::...
:;:::m:==:=:i::!
ュセ tn"!lin:rE: 111"55'11"e IlTOO"E 11Z"'5'II"E QiエBQセ
79 -3. INVESTIGATION
Based on preliminary field survey. the monitoring data station was developed (Fig.2). Water quantity and
water quality was monitoredinthose stations. The nwnber of station was decided based on cost of construction, maintenance. and security. The shallow groundwater levelwasmonitored at four irrigation blocks. The river water
level was monitored at upper, middle and lower reaches, and observed discharge ratc in those stations.
The shallow groundwater levelwasmonitored at four irrigation blocks. Each irrigation block was installed
one monitoring well. The monitoring well at Ketandan-Tretes block was already installedby province government.
Depth of well was varied 6 to 15 meters, depend on shallow aquifer location and condition. Water level of
: : !
0 - _ _ --_--"T_BlDdr.. . . . KIri. .
]]セNNjN
__
[image:6.510.42.491.12.614.2]Fig.2 Irrigation Schemes in Nganjuk district
Table 1Thefeature ofirrigatioDblockinNganjuk area
F"",,", WOW MriC&Jl.Kiri Kuncir-Bodor Ketandan-Trms 1. Main Purpose
• Irrigation 0 0 0 0
• Hydro power generation 0
• Flood control 0 0 0 0
• Recreation 0 0
2. Nwnberofreservoir
• Medium 1(33 MCM)
• Small 2 6
3. Number of I
••
Number ofweir 20 3 20,
,.
River Sctionol Annual-
Sctionol6. Originate of river Kendeng Mountains. Fla... Wilis Mountain Kond<ng
Pandan Mountain&Wilis Mountain
Mountain
7. Sub-basin Widas Warujayeng- Kuncir&.Bodor Widas
Kmooooo" Bodo'
8. Rctardin basin 0
o
28MC 0 09. 1m edcommand area 10496
•
12 13.403 3139groundwater
was
recorded by water logger every six hours. Every week (Thursday) groundwater levelwas
manually measwed to calibrate water loggerdata. Water sample
was
taken to measwed pH, temperatureen,
[image:7.491.10.480.3.728.2]electrical conductivity (EC), nitta.. (No,-N), phosphorus (PD,-P), and chemical oxygen demand (COD).
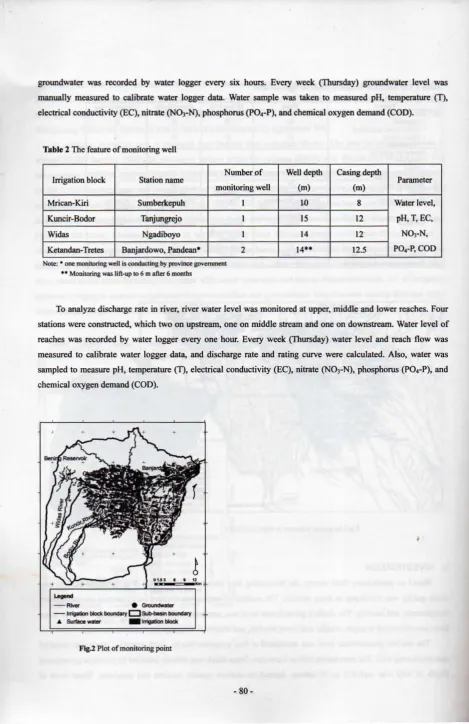
Table 2 The feature of monitoring well
Irrigation block
Mricao-Kiri
Kuncir-Bodor
Widas
Ketandan-Tretcs
Station name
Sumberkepuh
Tanjungrejo
Ngadihoyo
Banjardowo, Pandean·
Number of
monitoring weD
2
Well depth Casing depth
Parameter
(m) (m)
W 8 Water level,
15 12 pH,
T,
EC,14 U No,-N,
14" 12.5 PO,-P,COD
Note: • one monitoring well is conductingbyprovince government
•• Monitoringwaslift-up to 6 mafter 6months
To analyze discharge rateinriver, river water level
was
monitored at upper, middle and lower reaches. Fourstations were constructed, which two on upstream, one on middle stream and one on downstream. Water level of
reaches was recorded by water logger every one hour. Every week (Thursday) water level and reach flow was
measured to calibrate waler loggerdata, and discharge rate and rating curve were calculated. Also, water was
sampled to measure pH, temperature
(n,
electrical conductivity (EC), nitrate (No,-N), phospborus (PO,-P), andchemical oxygen demand (COD).
'-"
-RHer N セ
- 1...エdZォセcjセ「ッャNョ、。イケ
• SlmoI... ⦅ セ t*ldt
Rainfall and climate data were taken from government monitoring station. Rainfall monitoring station
is
scattered on 45 locations and two climate stations is locatedatupper and lower area.
4. RESULTS
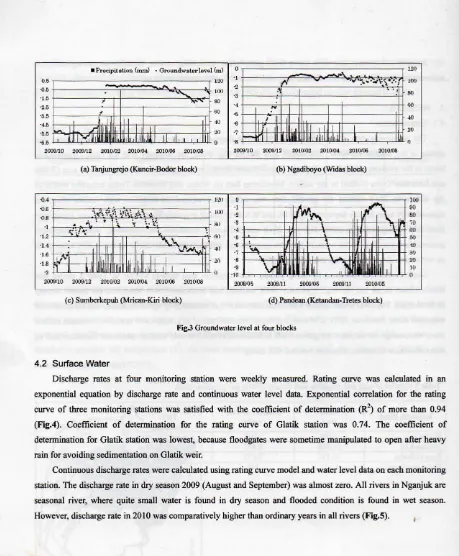
4.1 Groundwater
The monitoring data of groundwaterin 2009-2010 showed the tendency of recharge in rainy season and
uptake in dry season. However, in southern area Mrican-Kiri block, the tendency was not clear. Groundwater
levelsinthe southern area (Mrican-Kiri and Kuncir-Bodor blocks) were higher than those in nonhern area(Widas
and Ketandan-Tretes blocks) indryseason. Monitoringdata on Widas,1Uld Ketandan-Tretes irrigatinn blocks nf
dry season in 2010 showed the groundwater was uptake and utilized as irrigatinn with surface irrigation conjunctively from June to September in2010,and in Kuncir-Bodor irrigation block, the ground waterwas uptake
from July to September in 2010. The year2010 was influenced below La-Nina condition, where rainfall has
occurredindry season.Inthe normal condition. groundwater level pattern is sine curve pattern, where upper peak
on wet season lowerpeakondryseason (Fig.3 (d».
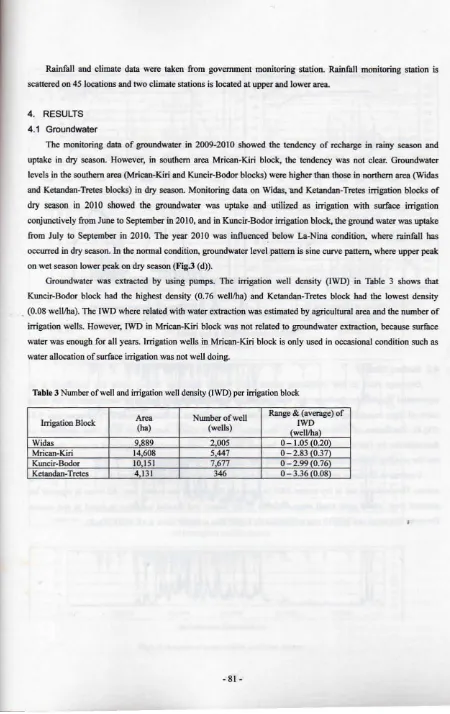
Groundwater was extracted by using pumps. The irrigation well density (fWD) in Table 3 shows that
Kuncir-Bodor block had the highest density (0.76 wellJha) and Ketandan-Tretes block
had
the lowest density• (0.08welVha). The IWD where related with water extraction was estintated by agricultural area and the number of
irrigation wells. However. fWD in Mrican-Kiri block
was
not related to groundwater extraction, because surfacewater was enough for all years. Irrigation wells in Mrican-Kiri block is only used in occasional condition suchas
[image:8.500.27.477.21.735.2]water al1ocation of surface irrigation was not well doing.
Table 3 Numberorwelland irrigationwelldensity (lWD) per irrigation block
Area Number of well Range&(average) of
Irrigation Block IWD
(ha) (wells)
(weIVha)
Widas 9,889 2,005 0- 1.05 (0.20\
Mrican-Kiri 14,608 5,447 0-2.83(0.37)
Kuncir-Bodor 10 151 7,677 0- 2.99 10.76)
Ketandan-Tretes 4,131 346 0- 3.36 (0.08)
-• Precipitation(mm) .o.'Oundwaler levelUn)
0.'
イZZ]]]]セ[[Z[[[ZZ[ZZ[ZZZZZ[[Z[[[Zセ]]Z[イ
'"
-0.0
+
_',
100-1.5
t_---:,
-r+---""'"
",,.,.-,{
80ᄋセNo
60
2010104 2010!U6 2010108 201Ml6 :!OIO,OJ
o
.,
エMMMWセM]BBGGGGGGGセMGGGGGBGGッBBBLBセBBLBBョGN
'" ...., ヲ|セ| •... :セ 100• , 80
.,
., t_-,--.N>'+'..,,--'-t_---tt 00
., t_+-,';'-,j
ヲエMセLェMLNェェMMMエMKMMMMMMKhB<t-mr..-JI-H-tlttrr----,-/-;--tl-,---ttI
'7 If セi セ 2Q
-8 - II uiuQゥェjiNNャAilMBイャャャセiNN • I 0
2009/10 3009f12 2010.'02 2010104
"
o,I '"'
.11 II .1,. '5.5 t -4.6セイュヲォ
セZZ セ
IIIセjャN
2009110 2009/12 2010.'02
(a) Tanjungrejo (Kuncir-Bodor block) (b) Ngadiboyo(w.dasblock)
<,.,
Hll 0 100<1.6 ·1 90
セイゥLL[Gセ Nセ|NZ セ| .. 10'
.,
rw'",
"
\
80-0.8
•
;, :.\.:
.
..
80.,
70.
,
I f " /. '
,
:.,
00-1.2 . . . . II 60
.,
"
'\'"
-1.4 <
,
""
II \,!';ot; 4U
-7
'"
-1.6セ
,JIJItL
'1.8 ,'I
セL
11\
,U ""
.,
2<11
1,...."
,
•
IiiI
10.,
0 ->0 02009/10 2009/12 2010i00 2010!04- 2010Kl6 :lOlO1'O8 20000' 2008111
""'''''
セoooiQi :lOlO;O5 [image:9.489.12.471.22.578.2](c) Sumberkepuh (Mrican-Kiri block) (d) Pandean (Ketandan-Tretes block)
Fig.3 Groundwater level at four blocks
4.2 Surface Water
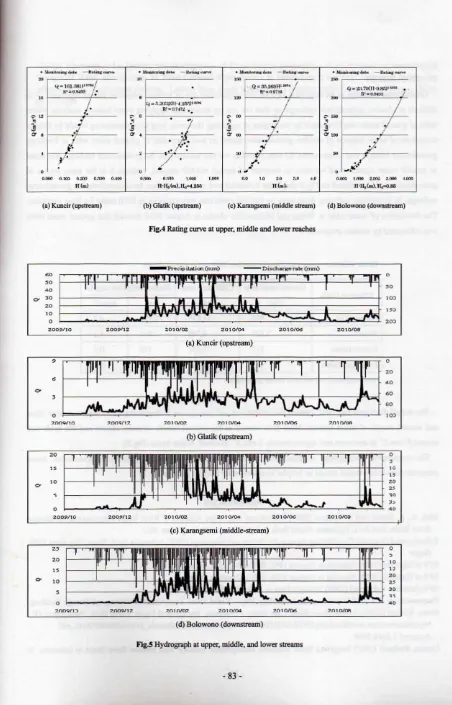
Discharge rates at four monitoring station were weekly measured. Rating curve was calculated in an
exponential equation by discharge rate and continuous water leveldata. Exponential correlation for the rating
curve of three monitoring stations was satisfied with the coefficient of detennination (R2) of more than 0.94
(Fig.4). Coefficient of determination for the rating curve of Glatik station was 0.74. The coefficient of
determination for GLatik station was lowest, because floodgates were sometime manipulated to open after heavy
rain for avoiding sedimentation on Glatik weir.
Continuous discharge rates were calculated using rating curve model and water level data on each monitoring
station. The discharge rateindry season 2009 (August and September) was almost zero. All rivers in Nganjuk are
seasonal river, where quite small water is found in dry season and flooded condition is found in wet season.
2010/OS
(d)Bolowono (downstrum)
2oOIOlOa
2.010/06
2010/0(1
- - Disc:hUl1Qllnote(JTwn.)
(e) K.ar.mgsemi (middle stmlm)
2.010104
2010/04
(a) Kuncir (upstream)
(b)G1atik(upstream)
-
83-(d) Bolowono(downstream)
(e)Karangsemi(middJe.stream)
2010/02
FIg.4Ratingcurveatupper,middleandlower reaches
(b) G1alik (upstream)
Fig.5Hydrograpb atupper.middle,andlower streams
2009/12 2.009112. 200051110 20009110
Zセセ
o 10'?rlOQ/ln ?nonqll". ;<t)1n1t'J:). ".nHlI£lo4 ".nlrvM ".nllYnA
(a) Kuacir(upsmam)
NセNキNN " - -
.---.
...
Il40o...._-
" - -.
...---
--m
",-un.:lIIII'-1
'"
セ
-q⦅FセNjijゥゥhャ⦅ /
qNセセセセGM
i
li'a-.sMl!
!:
•• .. 111111..
!
•
Nセ[ャエLiRHiiᄋTNRャ|NセM...
/
..
/
It'_O.Hn/p .
セu
J
i
•
.
セ'"
1-
セQVャiI
i
7
0 ''.
.'
.! .!
a
•
" a•
; f - -
セ w 。セ/.
.,1;I
. j.";
i
.'
.
•
fl.
,
7
'"
1
'"
セO
,{
,
,
.'w·,
0,0(1l'I 11.100
...
..
-
...
[image:10.492.29.481.21.726.2]5. DISCUSSION
Groundwater recharge is an imponant key for the conjunctive use of surface irrigation and groundwater. Itis
difficult to observe groundwater recharge,so thenwecantrytoestimate applying water balance analysis. Water
table of ground water was fluctuated by recharging or uptaking. However, longteonmonitoring wouldbehelpful
to analyze of water balance of shallow groundwater.
Based
on two years data of ground water table inPandean,
groundwater balance was aImost same. So then, possibly we may assume that the groundwater recharge was equal
to ground water uptake. And we have to consider of annual rainfall amoWlt, because it is the main source of
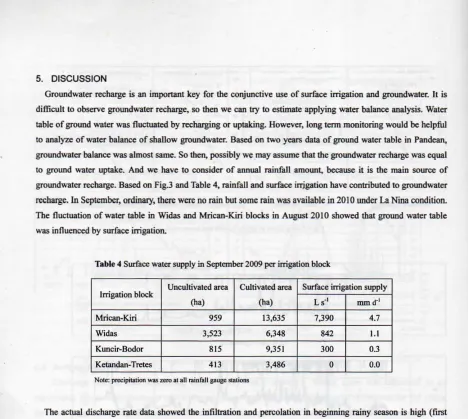
groundwater recharge. Based on Fig.3 and Table 4, rainfall and surface injgation have contributed to groundwater
recharge. In September, ordinaty, there wen: no
rain
hut somerain
was
availablein20 I0 underLaNina condition.The fluctuation of water table in Widas and Mrican-Kiri blocks in August 2010 showed that ground water table
[image:11.490.11.479.19.438.2]was
influenced by surface irrigation.Table 4SurfacewatersupplyinSeptember2009perirrigation block
Uncultivatedarea Cultivatedarea Surface irrigation supply
Irrigation block
(ha) (ha) Ls-1 mmd-I
Mrican-Kiri 959 13,635 7,390 4.7
Widas 3,523 6,348 842 1.1
Kuncir-Bodor 815 9,351 300 0.3
Ketandan-Tretes 413 3,486 0 0.0
Note: precipitationwas zero at all rainfall gauge stations
The actual discharge rate data showed the infiltration and percolation in beginning rainy season is high (fust
and
second monthof
rainy season).Base
flow started inthe
secondmonth
ofrainy
season and thepeakwasaround 6 nun d" in upstream and approximately 2 nun d-Jin whole Widas basin (Fig.S).
The sustainable development of groundwater resource requires continuous quantitative assessment. Some
computer simulation model would be helpful to assess water balance change.
REFERENCES
Bhat, A.,K.Ramo, andK.Kemper (2005) Institutional and Policy Analysis of River Basinm。ョ。ァ・ュ・ョセ the Brantas
•
River Basin,EastJava, Indonesia, World Bank Policy Researcll Working Paper 3611
Bakol1iurtanal (National Coordinating Agency for Survey and Mapping) (200 I) IndonesiaEarthShape Map sheet 1508,
Bogor
BPS of Nganjuk (1992) Nganjuk in Figures 1992. BPS ofNganjuk, Nganjuk BPS ofNganjuk (2009) Nganjuk in Figures 2009. BPS ofNganjuk, Nganjuk BPS (Statistics Indonesia) (2009) Strategic Data of BPS. BPS, Jakarta
Puspowardoyo, R.S. (1984) Indonesia Hydrogeology Map - Kediri Sheel. Departmentad Mining and Energy. Bandung
Ramo,Kikkeri(2004) Brantas River BasinCaseStudy -Indonesia. Background Paper. World Bank, Washington DC,
http://siteresources.worldbank.orgllNTSAREGTOPWATRES/Resourcesllndonesia_BrantasBasinFINAL.pdf.
Acoessed I April 2009
[image:11.490.24.486.108.693.2]Charles Abernathy (00.), Interseetoral Management of River Basins: proceedings of an international workshop on
"Integrated Water Management in Water-Stressed River Basins in Developing Countries: Strategies for Poverty
Alleviation and Agricultural Growth," Loskop Dam. SouthAfrica,16-21October2000.Colombo. SriLanka:1WMI.
pp.27J-2%