Prastowo, S. Hardjoamidjojo, B. Pramudya and K. Murtilaksono. “Performance of Shallow Groundwater Irrigation Schemes in Nganjuk-East Java, Indonesia”. Agricultural Engineering International: the CIGR Ejournal. Manuscript LW 07 013. Vol. IX. June, 2007.
Performance of Shallow Groundwater Irrigation Schemes
in Nganjuk-East Java, Indonesia
Prastowo1, S. Hardjoamidjojo2, B. Pramudya, K3. Murtilaksono4
1
Dept. of Agricultural Engineering, Faculty of Agricultural Technology, Bogor Agricultural University, Kampus IPB Darmaga Bogor 16680; Phone : +62 251 627225; email :
2
Dept. of Civil Engineering, Pakuan University, Bogor 16144; Phone : +62 251 312206; email :
3
Dept. of Agricultural Engineering, Faculty of Agricultural Technology, Bogor Agricultural University, Kampus IPB Darmaga Bogor 16680; Phone : +62 251 623026; email :
4
Dept. of Soil Sciences, Faculty of Agriculture, Bogor Agricultural University, Kampus IPB Darmaga Bogor 16680, Phone : +62 251 629360; email : [email protected]
ABSTRACT
The use of shallow groundwater for irrigation in Indonesia has not shown maximum benefit yet. Improvements are still required in order to increase performance. The performance of shallow groundwater irrigation schemes (SGWIS) has been evaluated by using the parameters of well efficiency, pump operation, irrigation efficiency, and irrigation cost. Research indicates that well efficiency is around 55-77% with optimum discharge of 4–17 l/s. Relatively, the performance of pump operation was not optimum, and the irrigation efficiency varied at 49-81%. Irrigation cost was about 257 USD per Ha per planting season for onions; equal to 0.02 USD per kg of onion production. Based on existing criteria, the performance of SGWIS in Nganjuk was relatively better than that in other regions of Indonesia; nevertheless the performance might be able to be increased, either by improvement of pump operation management, improvement of the conveyance system, or improvement in the technology of irrigation application.
Keywords: Irrigation cost, irrigation efficiency, pump operation, shallow groundwater.
1. INTRODUCTION
The development of groundwater irrigation schemes in the District of Nganjuk has been conducted intensively since 1975, through development of shallow wells and deep wells. Most of the shallow wells are located in the northern part of Nganjuk, in the sub-districts of Rejoso, Gondang, Sukomoro, Bagor, Nganjuk, Lengkong, and Wilangan. While most of the deep wells are scattered throughout the southern part of Nganjuk, in the sub-districts of Pace, Loceret, Berbek, Sukomoro and Nganjuk.
Prastowo, S. Hardjoamidjojo, B. Pramudya and K. Murtilaksono. “Performance of Shallow Groundwater Irrigation Schemes in Nganjuk-East Java, Indonesia”. Agricultural Engineering International: the CIGR Ejournal. Manuscript LW 07 013. Vol. IX. June, 2007.
in that season are secondary crops (palawija), such as soybeans and corn, and horticultural crops, such as chilies, onions, watermelons, melons, and vegetables. The average annual rainfall in the District of Nganjuk (data from 1993 – 2003) was 2,285 mm/year with 90 rainfall event days per year. Average monthly rainfall was 190.4 mm/month, with relative fluctuation along the year. Under the Oldeman classification, the climate in the District of Nganjuk is classified as type C3,
with 5 dry months (June – October) and 6 wet months (November – April). This indicates that this area can be planted only in paddy (during PS1st) and in secondary crops (during PS2nd)
throughout a year, but this depends on the irrigation water supply.
Shallow wells, generally less than 15 m in depth, are constructed by digging, boring, driving, or jetting (Todd 1980). The results of a study by the Republic of Indonesia Department of Agriculture (RIDA) in 1998 showed that the use of shallow groundwater for irrigation had not given maximum benefit yet. The system needed to be improved in order to increase the performance of the shallow groundwater irrigation schemes (SGWIS), especially in relation to the management of wells and pumps, the increasing of irrigation efficiency, and the arrangement of cropping patterns.
The objective of the research was to review performance of SGWIS, including the parameters of well efficiency, pump operation, irrigation efficiency, and irrigation costs.
2. METHODS
The research area was located in the District of Nganjuk, East Java Province, Indonesia. The sampling location for collecting field data was the SGWIS which had been developed in relation to several of high economy-value crops, and which had cropping intensity of more than 200%, in the Sub-district of Sukomoro.
Data was collected by observation and field measurement, soil sampling, interviews, and collecting secondary data. The methods were as follow:
1. Step drawdown and continuous pumping test to measure aquifer and well characteristics 2. Measurement of H-Q (head-discharge) of pump operation
3. Measurement of soil water content, irrigation depth, and water losses to determine irrigation efficiency
4. Soil sampling and analysis of soil physical properties
5. Observation and interviews; to collect data on cropping patterns, cropping intensity, irrigation scheduling, crop budgets, pipeline layouts, and pump operation
6. Collecting secondary data; including data on climate and cropping factors.
Prastowo, S. Hardjoamidjojo, B. Pramudya and K. Murtilaksono. “Performance of Shallow Groundwater Irrigation Schemes in Nganjuk-East Java, Indonesia”. Agricultural Engineering International: the CIGR Ejournal. Manuscript LW 07 013. Vol. IX. June, 2007.
3. RESULTS AND DISCUSSION 3.1. Aquifer and Well Characteristics
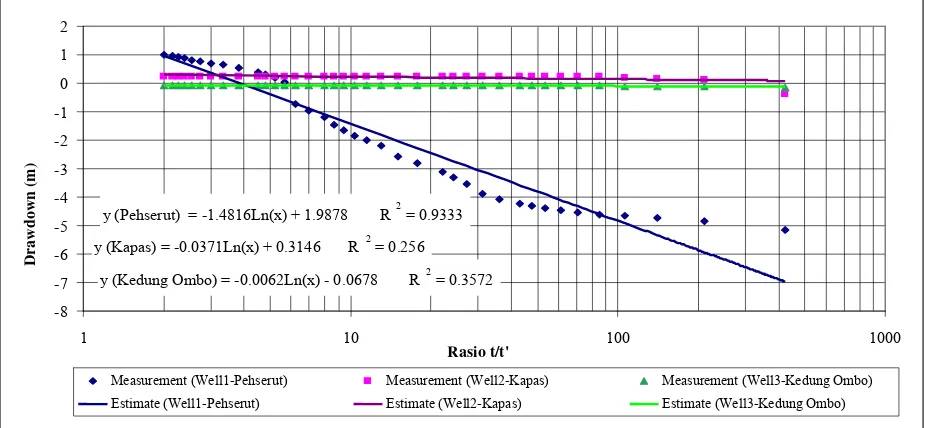
Aquifer and well characteristics were determined by pumping tests, both the step draw-down test, as well as the continuous test. The pumping test results were pumping discharge (Q), draw-down (Sw), pumping duration and groundwater recovery time. Figure 1, Figure 2, and Figure 3
show the result of the pumping tests at 3 wells in the research area.
Figure 1. Continuous recovery test results
y (Pehserut)= -1.6115Ln(x) + 2.3488 R2 = 0.9723
Measurement (Well1-Pehserut) Measurement (Well2-Kapas) Measurement (Well3-Kedung Ombo)
Estimate (Well1-Pehserut) Es timate (Well2-Kapas) Estimate (Well3-Kedung Ombo)
Figure 2. Step drawdown recovery test results
y (Pehserut) = -1.4816Ln(x) + 1.9878 R2 = 0.9333
Measurement (Well1-Pehserut) Measurement (Well2-Kapas) Measurement (Well3-Kedung Ombo)
Estimate (Well1-Pehserut) Estimate (Well2-Kapas) Estimate (Well3-Kedung Ombo)
Drawdown
(m
Prastowo, S. Hardjoamidjojo, B. Pramudya and K. Murtilaksono. “Performance of Shallow Groundwater Irrigation Schemes in Nganjuk-East Java, Indonesia”. Agricultural Engineering International: the CIGR Ejournal. Manuscript LW 07 013. Vol. IX. June, 2007.
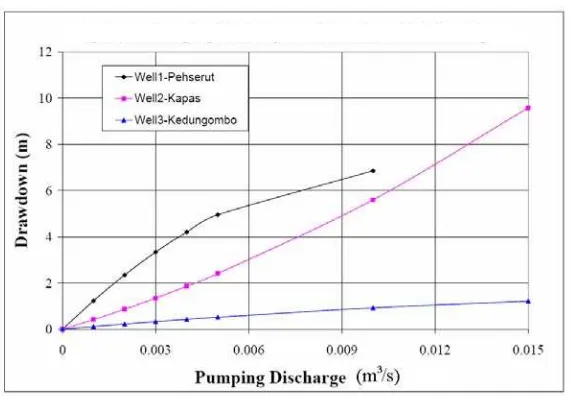
Figure 3. Pumping discharge and drawdown relationship
The transmissivity of the unconfined aquifers varied at 67 - 1272 m2/day. If compared with the boundary of aquifer classification for irrigation development (Suharyadi, 1989), the transmissivity could be classified as low class to high class for developing irrigation, because it was less than 300 m2/day and more than 1000 m2/day. The hydraulic conductivity was about 3.3 – 41.6 m/day. These values show that the aquifers in the area were composed of relatively the same materials. According to Linsley et al. (1989), the hydraulic conductivity of materials originating from sand is 41 m/day, whereas hydraulic conductivity for materials that are composed from sandstone is 4.1 m/day.
Specific capacity value will change as a function of pumping discharge and pumping time. If discharge is divided by drawdown in a pumping well, the specific capacity of the well is obtained. For a specified duration of pumping, the well efficiency is given as a percentage of the measured specific capacity in the field compared with one computed (Todd, 1980) . The specific capacity of the unconfined aquifer in the research area varied at 95 - 161 m2/day, while well efficiency was around 55 - 77%. The efficiency of the wells was relatively high (>50%), which showed that well construction at those locations was good, with precise placement of filters on developed aquifers. Results of research by RIDA (1998) show that 75% of shallow wells in Indonesia have well efficiency of more than 50%.
Prastowo, S. Hardjoamidjojo, B. Pramudya and K. Murtilaksono. “Performance of Shallow Groundwater Irrigation Schemes in Nganjuk-East Java, Indonesia”. Agricultural Engineering International: the CIGR Ejournal. Manuscript LW 07 013. Vol. IX. June, 2007.
irrigation contributes to shallow groundwater recharge. That fact shows the cyclic use of irrigation water. Elhassan et al., (2003) stated that generally, paddy field areas and non paddy field areas contribute equally to the total annual recharge of the shallow aquifers of a given area. The percentages for the different recharge sources in relation to the total gross recharge in Nasunogahara-Japan are 42% from paddy fields, of which 25% is from paddy fields irrigated by groundwater, 17% from paddy fields irrigated by canal water, 45% from non-paddy lands, and 13% from river underflow.
3.2. Pumps and Irrigated Command Area
The irrigated command area in the research location varied at 1.1 – 9.4 ha/well, with each well being served by one pump. In 2005, the population of pumps for shallow groundwater irrigation in Nganjuk was 5,033 units, with an average irrigated command area of 7.3 ha/pump. The shape of planted area blocks is generally rectangular, around 40 – 60 m in length and 20 – 40 m in width.
Of the many types of pumps available, the centrifugal, propeller, and reciprocating pumps are by far the most common (Wijdieks and Bos, 1985). The main type of pump usually used by farmers in the research area is the centrifugal pump that has a 3 inch suction pipe and actual discharge of 2.6 – 7.4 l/s. The power for these pumps is generated by 7.0 – 8.5 HP diesel engines. The results of RIDA research (1998) showed that the most commonly used type of pump was the centrifugal pump of various brands, with a suction pipe diameter of 1.5-4.0 inch. The pumping discharges were varied at 6-10 l/s for a 3-inch pump and 19 l/s for a 4- inch pump. Pumps were usually powered by 4 – 16 HP diesel engines and 3- 5 HP gasoline engines.
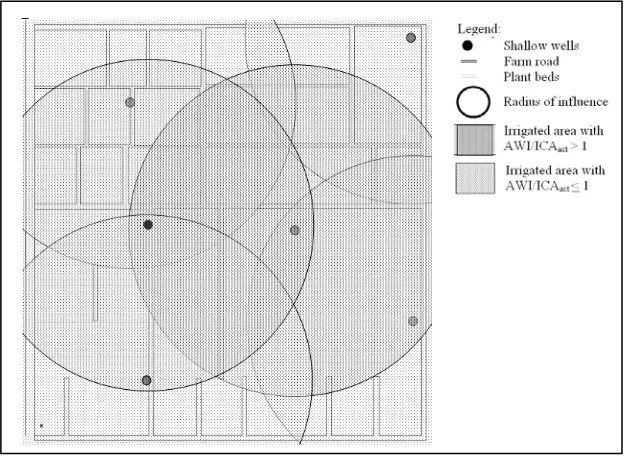
The radius of influence (R) can be estimated from the texture and other characteristics of the aquifer (Schwab et al., 1981). According to pumping test results, the radius of influence in this research area varied at 118 - 348 m, which was used to measure the area of well influence (AWI). The AWI was assumed to be circular in shape with a drawdown shape as a consequence of pumping. The area of influence could be smaller or larger than either the potential irrigated command area (ICApot) or the actual irrigated command area (ICAact). However, Qi Lu and Sato
(2007) stated that the assumption of radially symmetric, horizontal, and steady flow is an ideal model. The correlation is weak between the ideal model and an actual aquifer system. This may account for some of uncertainties in the results.
The AWI/ICAact ratio varied at 1.32 – 3.88 (>1), indicating that the area was densely populated,
because the distance between a given well and other surrounding wells was less than 2R (diameter of influence). The AWI/ICApot ratio of 1.87 – 5.52 ( >1) illustrates that if a well’s
discharge is not enough to irrigate the larger irrigated area, any development of new wells in this area must be based on a distance between wells equal to or more than 2R. The ICAact/ICApot ratio
was 1.42, indicating that the actual irrigated command area tended to exceed the optimum irrigated area. Figure 4 shows the schematic of calculated radius of influence in the research area. Irrigated areas with an AWI/ICAact ratio of less than one were located mostly nearby the
Prastowo, S. Hardjoamidjojo, B. Pramudya and K. Murtilaksono. “Performance of Shallow Groundwater Irrigation Schemes in Nganjuk-East Java, Indonesia”. Agricultural Engineering International: the CIGR Ejournal. Manuscript LW 07 013. Vol. IX. June, 2007.
The value of ICAact/ICApot ratio ≥ 1 means that the actual irrigated area in SGWIS has exceeded
the potential irrigated command area, meaning that from the point of view of adequte irrigation water supply, it is no longer possible to expand the area covered. Should the ratio value of ICAact/ICApot be ≤ 1, the irrigated command area of SGWIS can still be expanded through
maximum utilization of optimum well discharge.
Figure 4. Schematic of calculated radius of influence in the research area
From the point of view of irrgation water adequacy, the ICAact/ICApot ratio should be ≤ 1 so that
the water requirement for growing crops can be met. From the point of view of conservation of shallow groundwater, the AWI/ICApot ratio should be ≤ 1 in order to prevent the overlapping of
groundwater cone depressions. In order to achieve the desired conditions, the following technical efforts, among others, must be made:
1. Shallow groundwater should not be utilized for rice crops in PS2nd and PS3rd.
2. Reduce the population of shallow wells to a ratio of AWI/ICAact or AWI/ICApot ≤ 1 through
integrated management of wells and pumps. The ICAact must not exceed ICApot nor be less
than AWI (AWI ≤ ICAact≤ ICApot).
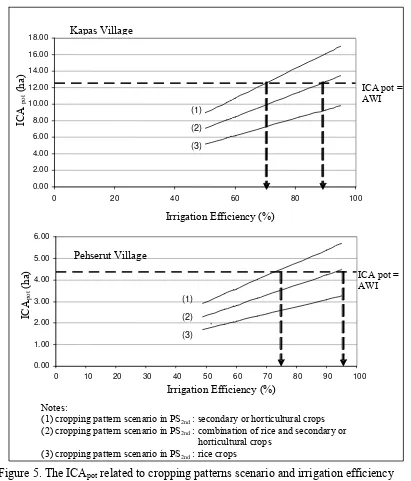
3. Increase irrigation efficiency, especially if points (1) and (2) are difficulty to implement. Figure 5 shows that irrigation efficiency must be increased in line with the cropping pattern applied as seen in the following:
a. In Kapas Village, irrigation efficiency has to be increased to a minimum of 73% for cropping pattern scenario (1) and 89% for cropping pattern scenario (2)
b. In Pehserut Village, irrigation efficiency must be increased to a minimum of 73% for cropping pattern scenario (1) and 93% for cropping pattern scenario (2).
Prastowo, S. Hardjoamidjojo, B. Pramudya and K. Murtilaksono. “Performance of Shallow Groundwater Irrigation Schemes in Nganjuk-East Java, Indonesia”. Agricultural Engineering International: the CIGR Ejournal. Manuscript LW 07 013. Vol. IX. June, 2007.
0.00
improvement in the technology of irrigation application. Clyma (2002) stated that improving water management in an irrigated area can save substantial water. With serious shortages in water supplies, water conservation is an urgent priority. Improved water management also increases productivity, and reduces or controls the waterlogging and salinity impacts of irrigation. According to Yuanlai Cui et al (2004), strategies for improving the water supply system include: rebuilding and rehabilitation of canal system, completion of hydraulic structure, establishing a reasonable irrigation water demand plan and improving irrigation water, management level, increasing water use efficiency in distribution and on farm system, and changing crop patterns
Notes:
(1) cropping pattern scenario in PS2nd : secondary or horticultural crops (2) cropping pattern scenario in PS2nd : combination of rice and secondary or
horticultural crops (3) cropping pattern scenario in PS2nd : rice crops
Kapas Village
Pehserut Village
(1)
Prastowo, S. Hardjoamidjojo, B. Pramudya and K. Murtilaksono. “Performance of Shallow Groundwater Irrigation Schemes in Nganjuk-East Java, Indonesia”. Agricultural Engineering International: the CIGR Ejournal. Manuscript LW 07 013. Vol. IX. June, 2007.
The research on the technical performance of pump operation was focused on analysis of the ratio of actual discharge and pump capacity (Qact/Qcap ratio), also on the ratio of the actual head
and the specification head of the pump (Hact/Hspec ratio). Those parameters were used to see how
extensively the pumps were operated optimally. The Qact/Qcap ratio varied at 0.17 – 0.48, whereas
the Hact/Hspec ratio varied at 0.32 - 0.41 . These values show that the operational performance of
pumps remains less than optimal. In line with technical specifications, the maximum pump discharge is 13.3 – 21.7 l/s, while the pump’s total dynamic head is 19 - 25 m. With the ratio value of Qact/Qcap and Hact/Hspec, this means that the unutilized pump capacity and pressure head
are respectively 4.77 – 11.50 l/s and 5.27 – 11.05 m. The fact that the pressure head inherent in SGWIS has yet to be utilized optimally means that no additional expenditure will be required for pumps and power sources in the application of trickle irrigation systems.
Pumping discharge values vary widely depending on the size of the pumps utilized by the farmers. In general, there is an apparent tendency for pumping discharges in a segment of the reasearch area (Pehserut Village) to be larger than the optimum well discharge. This means that the size of the pumps used in this area is relatively larger than that required by the technical specifications. The pumping discharge in another segment of the research area (Kapas Village) is relatively smaller than the optimum well discharge. Due to the Qact/Qcap ratio ≤ 1, the
pumping efficiency at this location could be raised. Even so, any increase in pumping discharge must be done in tandem with the establishment of the distance between wells in order to prevent an excessive drawdown.
3.3. Cropping Patterns and Irrigation Application
Exploitation of shallow groundwater for irrigation has the potential to create a chance for farmers to improve their cropping patterns, their cropping intensity, to better their application of cultivation technology, thus increasing their production and income. The cropping patterns in the research area were paddy-paddy-corn-mung bean;paddy-onion-chili-onion; paddy-melon-onion;
and peanut-onion-corn-onion. Cropping intensity varied at 300-400%. Results of research by RIDA (1998) showed that the exploitation of shallow groundwater for irrigation had increased cropping intensity to 200-280%.
There are three main surface irrigation methods, i.e. basin irrigation, border irrigation, and furrow irrigation (Kay, 1989). The irrigation method applied in shallow groundwater irrigation schemes in the research area was surface irrigation, with a basin system for paddy and a furrow system for secondary crops(palawija). The applications of irrigation depth and irrigation interval depend on the planting season, the crops and the irrigated area. In the wet season (PS1st), the
pumps generally were not operated because the water requirement of paddy had been fulfilled by rainfall and existing surface irrigation schemes. In PS2nd, the pumps were operated in order to
provide irrigation water for paddy, secondary crops (palawija), and/or horticultural crops to maintain an irrigation depth of 8-20 mm, with an irrigation interval of 3 -5 days. While in PS3rd,
Prastowo, S. Hardjoamidjojo, B. Pramudya and K. Murtilaksono. “Performance of Shallow Groundwater Irrigation Schemes in Nganjuk-East Java, Indonesia”. Agricultural Engineering International: the CIGR Ejournal. Manuscript LW 07 013. Vol. IX. June, 2007.
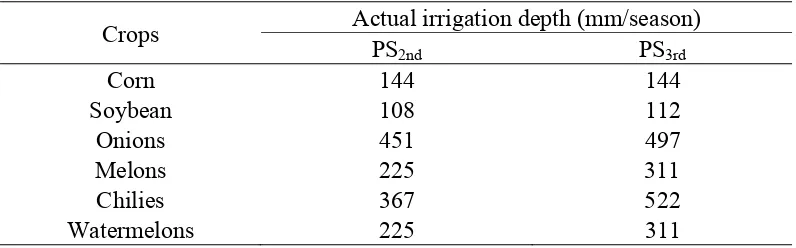
research location ranged from 108 to 451 mm throughout PS2nd and 112 to 522 mm throughout PS3rd, as can be seen in Table 1.
Table 1. The actual irrigation depth in the research area Crops Actual irrigation depth (mm/season)
PS2nd PS3rd
Corn 144 144
Soybean 108 112
Onions 451 497
Melons 225 311
Chilies 367 522
Watermelons 225 311
As a comparison, in Mkoji sub-catchment-Tanzania, increasing the interval of irrigation for the maize crop beyond the conventional 7 days will lead to a significant decrease in grain yield irrespective of the depth of water applied at irrigation. The optimal schedules, which minimized grain yield and crop consumptive use reductions and maximized deep percolation reductions, were the 9-day irrigation interval at 50 mm irrigation depth and the 10-day irrigation interval at 55 mm irrigation depth (Igbadun et al., 2006). While in Tamilnadu-India, a rotational system is widely adopted, with the irrigation interval varying between 4 to 7 days depending upon the soil, rainfall, crop and crop stage. At equitable and dependable supply at the right times cannot therefore be ensured for individual holdings. Research findings have clearly indicated that it is enough to allow only a 3-5 cm depth of water in a rice crop, with the next irrigation coming after the water stored is completely depleted (Anbumozhi et al., 2001).
The effect of crops characteristics on water requirements is represented by the crop coefficient (kc) which presents the relationship between reference (ETo) and crop evapotranspiration
(ETcrop) or ETcrop = kc x ETo. The values of kc vary with the crop, its stage of growth, the
growing season and the prevailing weather conditions (Raes, 1989). The calculated water requirement unit (WRU) varied at 0.66 – 1.16 l/s per Ha during the period of May-June and August-September. The value was a half-monthly measure of the maximum water requirement unit with the above cropping patterns. Relatively large differentiations occur in the WRU in relation to the alternative cropping patterns. The largest WRU value of 0.97 – 1.16 l/s.ha occurs in PS2nd rice crops. If a combination of rice and secondary or horticultural crops is planted for PS2nd, the WRU is relatively smaller at 0.85 l/s.ha. The smallest WRU value, about 0.60-0.67 l/s.ha occurs with the planting of secondary or horticultural crops in PS2nd. When shifts in the planting schedule occurs, the WRU will be larger, approximately 0.90 – 1.37 l/s.ha, than the WRU during normal conditions. The seasonal water requirements for onions depended on the planting date; i.e. 451 mm/season for May-2, and 478 mm/season for June-1, and 497 mm/season for June-2 planting dates. By comparing the actual onion crop yields of 13 tons/ha, the approximate water requirement was about 347 – 382 liter per kg of onions produced.
Prastowo, S. Hardjoamidjojo, B. Pramudya and K. Murtilaksono. “Performance of Shallow Groundwater Irrigation Schemes in Nganjuk-East Java, Indonesia”. Agricultural Engineering International: the CIGR Ejournal. Manuscript LW 07 013. Vol. IX. June, 2007.
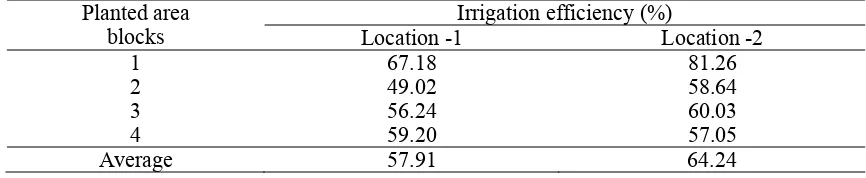
The research on irrigation efficiency of SGWIS includes conveyance efficiency and water-use efficiency. The irrigation efficiency (Ef) was calculated by the formula of Ef=Wn/Wr, where, Wn is the water beneficially used for plant growth, and Wr is the water introduced into the distribution system. The measurement and calculation results of irrigation efficiency are presented in Table 2. The irrigation efficiency varied at 49.02 – 81.26%. The relatively low irrigation efficiency of some schemes in the research area was caused by water losses along conveyance and evaporation in bed channels. In Madiun, the region adjacent to the research area, irrigation efficiency was 59% (Harjoko, I.Y., 1998), while for Indonesia as a whole; surface irrigation efficiency was around 60 - 70% (Kalsim, 2002).
Table 2. Irrigation efficiency of SGWIS in the research area Planted area
blocks
Irrigation efficiency (%)
Location -1 Location -2
1 67.18 81.26
2 49.02 58.64
3 56.24 60.03
4 59.20 57.05
Average 57.91 64.24
3.4. Irrigation Cost
Calculation of irrigation cost involves the consideration of the general elements of cost, which are direct materials, direct labor, and overhead (DeGarmo et al., 1979). The investment cost of SGWIS includes cost of pumps, engines, pipe networks, well construction and pump houses. The irrigation cost in the research area was about Rp 2,350,000,- (257 USD) per Ha per planting season for onions; equal to Rp 180,- (0.02 USD) per kg of onions. The irrigation cost consists of 19 USD of fixed cost and 238 USD of variable cost, which is about 8% of the total production cost for onions.The cost of irrigation in PS3rd is relatively higher than the irrigation cost for PS2nd because the volume of water or length of pumping time per PS3rd is relatively larger than for PS2nd. When compared to the average selling price for crop products, the cost of groundwater irrigation per product unit ranges between 2.5 – 5.0 %. Research results by RIDA (1998) in some locations in Indonesia showed that the proportion of the groundwater irrigation cost varied at 3 – 20% of the total crop production cost.
4. CONCLUSION
The performance of SGWIS in the research area, in terms of well efficiency, pump operation, and irrigation efficiency, was relatively better than that for other locations in Indonesia; nevertheless this performance might be able to be increased either by improvement of pump operation management, improvement of conveyance system, or improvement in the technology of irrigation application. In order to expand irrigation area coverage to be larger than or equal to the area of well influence (ICAact≥ AWI), the irrigation effeciency of SGWIS would have to be
Prastowo, S. Hardjoamidjojo, B. Pramudya and K. Murtilaksono. “Performance of Shallow Groundwater Irrigation Schemes in Nganjuk-East Java, Indonesia”. Agricultural Engineering International: the CIGR Ejournal. Manuscript LW 07 013. Vol. IX. June, 2007.
5. REFERENCES
Anbumozhi, V., K. Matsumoto and E. Yamaji. 2001. Sustaining Agriculture through Modernization of Irrigation Tanks: An Opportunity and Challenge for Tamilnadu, India. Agricultural Engineering International: the CIGR Journal of Scientific Research and Development vol. III.
Clyma, W. 2002. Management Strategies for Sustainable Irrigated Agriculture With Organizational Change To Meet Urgent Needs. Agricultural Engineering International: the
CIGR Journal of Scientific Research and Development vol. IV.
DeGarmo, E.P., J.R.Canada, and W.G.Sullivan. 1979. Engineering Economy. Macmillan Publishing Co. Inc. New York.
Elhassan, A., A. Goto, and M. Mizutani. 2003. Effect of Conjunctive Use of Water for Paddy Field Irrigation on Groundwater Budget in an Alluvial Fan. Agricultural Engineering International: the CIGR Journal of Scientific Research and Development vol. V.
Harjoko, I.Y. 1998. Kajian Efisiensi Pemanfaatan Airtanah Dangkal Untuk Irigasi di Kabupaten Madiun – Jawa Timur. Skripsi, Fateta – IPB Bogor.
Igbadun, H., H. Mahoo, A. Tarimo and B. Salim. 2006. Irrigation Scheduling Scenarios Studies for a Maize Crop in Tanzania Using a Computer-based Simulation Model. Agricultural Engineering International: the CIGR Ejournal. Vol. VIII.
Kalsim, D.K. 2002. Rancangan Irigasi Gravitasi, Drainase Dan Infrastruktur. Bagian Teknik Tanah dan Air. Departemen Teknik Pertanian. FATETA. IPB. Bogor.
Kay, M. 1989. Surface Irrigation, Systems and Practice. Cranfield Press. Cranfield Institute of Technology. England UK.
Linsley, R.K. and J.B. Franzini. 1989. Teknik Sumber Daya Air. Penerbit Erlangga. Jakarta. Qi Lu and M. Sato. 2007. Quantitative Hydrogeological Study of an Unconfined Aquifer by
GPR along Tuul River in Ulaanbaatar. Center for Northeast Asian Studies, Tohoku University.
Raes, D. 1989. Crop Water Requirements. Katholieke Universiteit Leuven. Belgium.
Republic of Indonesia Department of Agriculture. 1998. Studi Pengembangan Airtanah untuk Pertanian Berskala Kecil. Jakarta.
Schwab, G.O., R.K.Frevert, T.W.Edminster, and K.K.Barnes. 1981. Soil and Water Conservation Engineering. John Wiley & Sons, New York.
Suharyadi. 1989. Studi Potensi Air Bawah Tanah Dalam dan Kemungkinan Pengembangannya Sebagai Tambahan Air Irigasi di Sub DAS Opak, DI Yogyakarta (tesis). Bogor: Fakultas Pasca Sarjana, Institut Pertanian Bogor
Todd, D.K. 1980. Groundwater Hydrology. John Wiley & Sons. New York, USA.
Wijdieks, J. and M.G.Bos. 1985. Pumps and Pumping Stations. Katholieke Universiteit Leuven. Belgium.