e-ISSN: 2319-2402,p- ISSN: 2319-2399.Volume 10, Issue 2 Ver. II (Feb. 2016), PP 38-42
www.iosrjournals.org
Analysis Of Physic And Chemical Properties In Groundwater
Landfill In Indonesia
Heruna Tanty
1, Rokhana Dwi Bekti
2, Tati Herlina
3, Solihudin
4 1(Department of Mathematics, Bina Nusantara University, Indonesia)2(Department of Statistics, IST Ak prind Yogyak arta, Indonesia) 3,4(Department of Chemistry,University of Padjadjaran, Indonesia)
Abstract
: Research on the physical properties (color, odor, turbidity, pH and solubility) and chemical properties (levels of aluminum, iron, manganese, nitrate, sulfate an d chlorine) contained in the groundwater around landfill Bantar Gebang Bek asi and Galuga Bogor has been carried out on May - August 2015. The results showed that soil water consumed by the people living around the garbage dump its physical and chemical properties still below the standardized WHO or the Ministry of Health of the Republic Indonesia. Except that manganese levels above the standard is 0.92 mg/l around landfills Bantar Gebang and 0.97 mg/l around landfills Galuga Bogor. In general, the levels of chemicals in landfill around Bantar Gebang higher than landfill GalugaKeywords
: physical properties, chemical properties, groundwater, landfillI.
Introduction
Water is an important in human life, water functions in the body for metabolis m, body temperature stabilizers, and solvents. People needs water approximately 5-8 liters a day, it’s can’t be replaced by other materials, so it is very important for people to know water quality that they consume . Water used for drinking and eating must meet the health standards of physical factors (color, hardness, solubility, smell and turbidity) and of the chemical properties such as the levels of ions of iron (Fe), nitrate (NO3-), manganese (Mn), sulfate
(SO4-2), chlorine (Cl), alu minu m (A l), etc [1]. When the ions exceed the levels specified by the WHO or the
Ministry of Health Republic Indonesia, then the water is unfit for consumption. Various diseases such as diarrhea, d izziness, hives and even serious diseases such as cancer, neurological and kidney can occur fro m consuming water containing bacteria or heavy metals. Bantar Gebang landfill Bekasi is the largest landfill with an area of 110.8 hectares and 5.974 tons per day of waste is disposed to that location. The smell of garbage can be detected up to a distance of 5 km. Around the landfill Bantar Gebang Bekasi and Galuga Bogor, many people settle down at location only 300 m fro m the landfill, they use ground water for drin king, cooking, bathing and washing. In fact, from init ial observation, the water they cons ume look pale yellow, and smelly. This is presumably because there is infiltration of d irty water fro m the waste that accumulates near the settlement.
This study aims to determine the physical and chemical properties of the groundwater consumed the peoples that living around landfill. Fro m initial observations water looks pale yellow and a bit smelly, so supposedly the ground water has been contaminated. Prev ious research reported that content of nitrate and chlorine in the soil water around Bantar Gebang above standardized WHO [2]. Although some of the waste has been made to become biogas and fertilizers [3], but the groundwater that consumed by population around Bantar Gebang have been contaminated [4]. Other researcher reported that groundwater around the landfill area in Tangerang, Bekasi, and Jakarta containing Mn and Cd above the WHO standard [5]. Research conducted by the University of Indonesia stated that the water uptake from landfill can seep in groundwater at distances up to 500 m [6]. So it is probable that the groundwater around the landfill Bantar Gebang Bekasi and Galuga Bogor used locals already unfit for consumption.
II.
Methodology
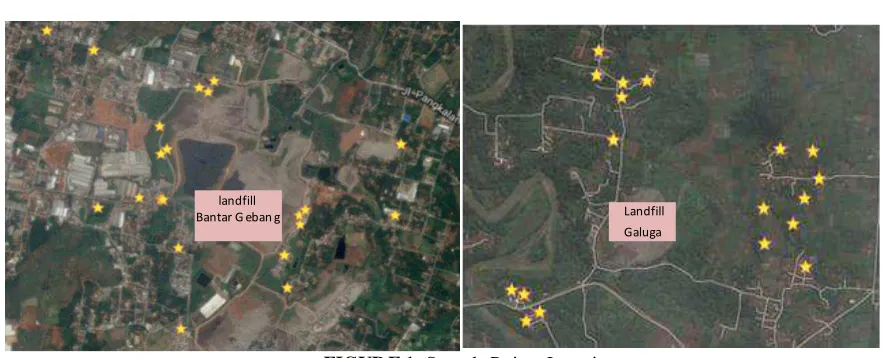
This research uses the data survey at around landfill Bantar Gebang, Bekasi, and Galuga, Bogor, West Java Province, Indonesia as in Fig.1. Th is survey conducted in May-August 2015. The samples are 22 groundwaters in around landfill Bantar Gebang and 18 groundwaters in around landfill Galuga. Laboratory test was conducted at the University of Pad jadjaran, Indonesia.
FIGUR E 1. Samp le Po ints Location
TABLE 1. Water Quality Standards of Physical and Chemical Properties Physical Prope rties Quality Standard
Color (PtCo) 15
TDS (mg/L) 500
T urbidity (NTU) 5
Chemical Prope rties Quality Standard
Al (mg/L) -
Fe (mg/L) 1
Hardness CaCO3 (mg/L) 500
Cl (mg/L) 600
Mntot (mg/L) 0,5
NO3- (mg/L) 10
NO2- (mg/L) 1
pH 6,5-8,5
SO42- (mg/L) 400
KMnO4 (mg/L) 10
Test of comparing two independent population means use the t test with he hypothesis Ho : µ1=µ2
(physical or chemical properties in locations with a distance < 500 m and location with a distance > 500 m have equal mean) and H1 : µ1>µ2 (mean of physical or chemical properties in location with a distance < 500 m is
higher than at locations with a distance of > 500 m). Decision-making is Ho rejected if | |tvalue|> tα2, n1+n2-2 or
Pvalue<α. Spatial analysis consists of spatial dependency (autocorrelation) which test by Moran’s I. It uses to
perform autocorrelation between observations or location [7]. The hypothesis test for Moran’s I is no autocorrelation as hypothesis null and the statistics test is Ztest (IIo)/ var(I). Var (I) is the variance of Moran’s
I and E (I) is the expected value. Reject null hypothesis if Ztest>Zα/2and there is a spatial autocorrelation.
III.
Results And Discussion
A. Charac teristic of Physic and Che mical
Table 2 shows the characteristic of physical groundwater in landfill Bantar Gebang and Galuga. It also compare the samples with the mean, maximu m and minimu m value, and quality standards based Ministry of Health according to Regulation no. 492/ Menkes/IV/2010. A ll of the physical properties are still under the quality standard. The mean of color scale and TDS in landfill Bantar Gebang are higher than in landfill Galuga, but not turbidity. It was conclude that the groundwater quality in landfill Galuga was better than in landfill Bantar Gebang.
About the chemical properties , in landfill Bantar Gebang, the mean of Mntot and pH are above the
quality standard (see Table 3). So me groundwater samples are also have NO2- which higher than quality
standard. It also happens in landfill Galuga, which Mntot, NO2-, and pH are h igher than quality standard.
Co mparing two locations, majo rity chemical properties in landfill Galuga are higher than in landfill Bantar Gebang.
TABLE2.Characteristic of Physic Groundwater Physic Property Landfill Bantar Ge bang
Mean Minimum Maximum
Color (PtCo) 7,05 5,00 10,00
TDS (mg/L) 132,14 22,00 380,00
landfill
Bantar G eban g Landfill
T urbidity (NTU) 0,81 0,46 0,99 Physic Property Landfill Galuga
Mean Minimum Maximum water between two locations or whether the location (distance from landfill) is affect on quality water. Table 4 and V are shows the results in each location. In landfill Bantar Gebang, the mean of turbidity in location < 500 m was higher than in location > 500 m. In landfill Galuga, the mean of color and TDS in location < 500 m was higher than in location > 500 m. By t-test, the color scale in landfill Galuga with location < 500 was significantly higher than in location > 500 m. It shows that the location was affect on color in landfill Galuga.
About chemical properties in landfill Galuga, Al, Fe, Mntot, NO2-N, and pH in location < 500 m was
higher than in location > 500 m. In landfill Galuga, Fe, Cl, NO3-N, p H, and KMnO4 in location < 500 m was
higher than in location > 500 m. The significantly t-test is NO3-N, wh ich NO3-N in landfill Galuga with location
< 500 was significantly h igher than in location > 500 m.
TABLE3.Characteristic of ChemicalGroundwater
Chemical Prope rty Landfill Bantar Ge bang Landfill Galuga Quality Standard Mean Minimum Maximum Mean Minimum Maximum
Al (mg/L) 0,07 0,03 0,10 0,15 0,06 0,78
TABLE4.Test of location Effect on Physic Properties Chemical Properties Landfill Bantar Ge bang Landfill Galuga
Mean tvalue Pvalue Mean tvalue Pvalue
TABLE5.Test of Location Effect on Chemical Properties Chemical Prope rties Landfill Bantar Ge bang Landfill Galuga
NO3- (mg/L)
C. Autocorrelation Test by Moran’s I
Table 6 and Table 7 shows the autocorrelation test of physical and chemical properties by Moran’s I.
This analysis to determine the relationship and dependencies of chemical among sample points by α=5%. The
hypothesis null is I = 0 or no dependencies among physical (or chemical) properties. In landfill Bantar Gebang, there are significantly dependencies about color scale (see Table 6). The moran’s I coefficient of color scale is 0,286 with the P value 0,028. The positive value of coefficient shows the groundwater that has high color scale will be adjacent to the ground water that has a high color scale. It also occurs in TDS, Mntot and SO42- in
landfill Bantar Gebang and color scale, hardness CaCO3, NO2-, and KMnO4 in landfill Galuga.
TABLE6.Moran’s I Test of Physical PropertieS Physical
Properties
Landfill Bantar Ge bang Landfill Galuga
I P value I P value
Color (PtCo) 0,286 0,028* 0,280 0,009*
TDS (mg/L) 0,311 0,011* -0,172 0,359
T urbidity (NTU) -0,167 0,409 -0,109 0,694
Note : *) Significantly at α=5%
TABLE7.Moran’s I Test of Chemical Properties
Physical Prope rties Landfill Bantar Ge bang Landfill Galuga
I P value I P value
Physical properties of ground water quality in landfills Bantar Gebang and landfills Galuga is still good because it was still under the quality standard. But, in general the groundwater quality in landfills Galuga was better than in landfills Bantar Gebang. About chemical propert ies, there are some properties which higher than quality standard, such as Mntot, NO2-, and pH. In general, the chemical groundwater quality in landfill Batar
Gebang was better than in landfills Galuga.
Some of physical and chemical properties in location less than 500 m fro m landfill are higher than in location more than 500 m. It shows that the groundwater qualities which close to the landfill are not healthy to consumption. Test of comparing mean shows that the locations, or distance landfill with the residential area, are significantly affect color scale and NO3-N in landfills Galuga. Mean of this properties in location < 500 m are
significantly higher than in location > 500 m. Spatial analysis by Moran’s test shows that there is a dependency about color scale, TDS, Mntot, hardness CaCO3, NO2-, and KMnO4.
Acknowledgements
Indonesia which has funded this research
References
[1] D.K. Todd, et al., Groundwater Hydrology, Third Edition (NewYork: John Wiley & Sons, 2005)
[2] S, Fajarini, Analysis of Groundwater Quality in People Around Final Disposal (TPA) Waste at Sumur Batu Bantar Gebang, Bekasi, . (Jakarta : UIN Syarif Hidayatullah, 2014)
[3] S.P. Ardiagarini, A. Riman, H.J. Kristina, Cost Calculation of Products Compressed Natural Gas From Landfill Gas as Alternative Energy In Bantar Gebang, Bekasi, Jurnal Teknik Industri, 8(2), 107-116.
[4] A.H. Dardak, Space Planning Policy Space for Waste Management. (Jakarta: Director General of Spatial Planning Department of Public Works, 2007).
[5] H. T anty, R.D. Bekti, T. Herlina, Nurlelasari, MANOVA statistical analysis of inorganic compounds in groundwater Indonesia. Journal of Environmental Science, Toxicology and Food Technology (IOSR-JEST FT), 8(4), 41-45
[6] Sularmo. The Impact of The Final Processing Places (TPA) Bakung to the Quality of Well Water, Social, Economic, and Public Health Firmness Village, Bandar Lampung City Thesis (Bandar Lampung: Bandar Lampung University, 2012).