129
Advances in River Sediment Research – Fukuoka et al. (eds) © 2013 Taylor & Francis Group, London, ISBN 978-1-138-00062-9
Case study on 2006 flash flood disaster in Putih River of Jember,
East Java, Indonesia
A.P. Rahardjo, D. Legono & Istiarto
Hydraulics Laboratory, Universitas Gadjah Mada, Yogyakarta, Indonesia
Y.T. Kurniawan
Directorate General of Water Resources, Ministry of Public Works, Indonesia
S. Hardjosuwarno
Agency for Research and Development, Ministry of Public Works, Indonesia
ABSTRACT: On January 1, 2006 flash flood disaster (in Indonesia is known as banjir bandang) occurred in Putih River, Jember District of East Java Province. This disaster resulted in more than 80 people were killed and hundreds were injured. The disaster was caused by natural dam break. The natural dam was formed by landslide due to heavy rainfall. After the January 2006 disaster, new cracks and crevices were found in the upstream area of Putih River. Based on this condition, repetition of similar disaster in the future is likely to occur. Therefore, it is required to conduct mitigation efforts in order to reduce the prob-able casualties in the future. One of the mitigation efforts is conducted by simulation of the past event. The understanding of past event from the simulation result can be used as reference to arrange plan and action of mitigation efforts. Modeling simulation of the January 2006 flood was conducted by 1-D models. Flood hydrograph was approximated by using Nakayasu method. The daily rainfall data recorded from the neighboring rainfall stations were transformed to hourly rainfall data by implementing the Alternating Blok Method. The rainfall intensity was calculated using the Mononobe formula. The natural dam model was interpreted from field observation and related references. Flood hydrograph induced by dam break process was approached by modeling flow over a growing opening. Model calibration was conducted by varying roughness coefficient, height of dam and breach parameters. Two marks of maximum elevation of flood at 5.996 km (RS 6 +984) and at 12.980 km (RS 0 +000) downstream of the natural dam were used for control points in the model calibration. The calibration process has shown that the height of natural dam was significantly influencing to the changes of flood flow surface elevation at the control points. The result of flood simulation in reconstructing the January 2006 flood showed that the simulations are able to approximate the disaster event both for water surface elevation and the flood arrival time.
1 INTRODUCTION
1.1 The flash flood disaster in Putih River of Jember district
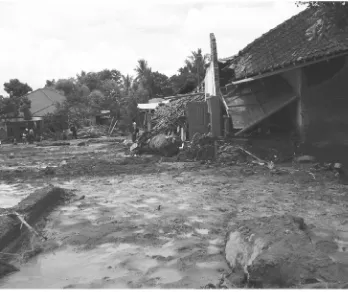
On January 1, 2006 flash flood disaster (in Indo-nesia is known as “banjir bandang”) occurred in Putih River, Jember District of East Java Province. This disaster resulted in more than 80 people were killed and hundreds were injured. Figure 1 shows part of the damages caused by the flash flood.
The disaster was caused by natural dam break. This natural dam was formed by landslide due to heavy rainfall for several days in a row. A few days after the event, a field investigation was conducted by ISDM Project Urgent Survey Team of Japanese Experts in cooperation with the Directorate Gen-eral of Water Resource and Agency of Research
130
and Development, the Ministry of Public Works (Watanabe, et al. 2006).
Part of the investigation results can be accessed from the following url address: http://www.sabo-int.org/case/2006_jan_indonesia.html.
The landslide blocked mainstream of Putih River and formed the natural dam. According to Naryanto, et al., 2007, after the January 2006 disaster, some new cracks and crevices were found in the upstream area of Putih River. This report warned that a similar disaster event may occur when heavy rainfall comes. Therefore, it is required to conduct mitigation efforts in order to antici-pate and reduce casualties. The mitigation effort is aimed to reduce as much as possible the risk of losses that are potentially to occur. One step of the mitigation efforts is modeling of the past flash flood event. The understanding of the event which is obtained from the simulation can be used as ref-erence to arrange the other flood simulation plans and mitigation actions.
1.2 Location of study
Putih River watershed is located at northern part of Jember District in East Java Province as shown in Figure 2. That is between the UTM (Universal Transverse Mercator) x-coordinate of 788000 and 792000, and between UTM y-coordinate of 9096000 and 9108000. The unit of the coordinate system is in meter. The upstream catchment area of Putih River is located on the southern slope of Argopuro Highlands with elevation of the highest point is of about +2340 m above m.s.l. (mean sea level). At the downstream, Putih River joins with Dinoyo River at +87 m above m.s.l.
The main stream length is of about 24.364 km. In this study, Putih River is divided into two parts, the upstream Putih River that is regarded as a watershed and the downstream Putih that is regarded as a reach. The upper part is used for hydrograph analysis. The flash flood simulation
was conducted along the downstream Putih River reach whose length of about 13.784 km starts from 804 m upstream of natural dam location whose elevation is of +751.38 above m.s.l.
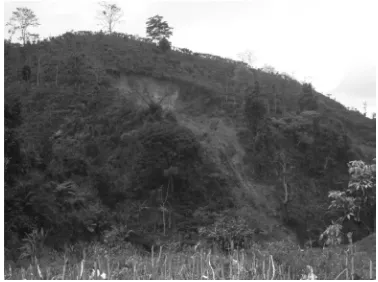
The upper part of Putih River has averaged longitudinal steepness of about 0.150 (vertical: horizontal). Most of the watershed itself is of very steep bank of valley as shown in Figure 3.
The upper part of Putih River watershed is vegetated by trees and bush. Small part of the flat-ter area has been used for cacao and rubber trees plantation. However, since the very high steepness along the bank of the valley and the soil charac-teristics, landslides are probable to occur by heavy rains.
The river valley starts widening at about 7 to 8 km upstream of the Putih River joint with Dinoyo River, forming alluvial fan with maximum width of about 3 km at about 3 km upstream of the joint of two rivers. Figure 5 shows the aerial
Figure 2. Location of the study and Putih River watershed.
Figure 3. Typical upstream Putih River valley cross-section.
131
the flash flood due to natural dam break in Lung-Chuian River, Taiwan using HEC-RAS software. The flood propagation to the downstream was sim-ulated by fixed bed hydraulic simulation method to estimate the hazard area. The natural dam break was simulated for one hour due to overtop-ping with four scenarios of rainfall intensities that determined the inflow hydrographs. River geom-etry data were interpreted from topographic map and aerial photo. The simulation results showed that among the three villages that were observed, only one village which was potentially affected by the design flood events. The simulation results are very useful in providing information to arrange the emergency action plans.
2.2 Data of the putih river natural dam formation and dam break occurrence
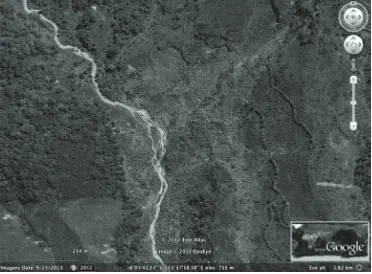
There was very few data of the natural dam break found for the study. However, we can still recognize the location of landslide from the mark that still can be seen on the field and on aerial view pro-vided by Google Earth image dated at 7 00 AM on 23/9/2011 or from Figures 7 and 8. The loca-tion of the landslide marks are at 8°03′42.13′′S, 113°37′59.16′′E. The upper one has semi-circle crater shape and the lower one is in form of long triangle.
From the field observation the averaged width of landslide crater mark is about 45 m and the dis-tance of the top crater crown from the river bed approximately is of 75 m. If the averaged depth of the landslide is of 15 m then the rough estimation of the landslide volume is of about 50000 m3.
At the landslide location, the river bed cross-sectional width is approximately of 30 m. The val-ley bank slope is approximately of 45°. Based on analysis of the soil sample taken from the location (Kurniawan, 2012) the angle of repose is of 28°, or
Figure 5. Aerial view of narrow alluvial fan zone.
Figure 6. Longitudinal profile of lower part of Putih River.
view of the narrow alluvial fan. There is no abrupt change of longitudinal slope of Putih River at the starting point of widening valley. The appearance of changing slope occurs at about 5 km upstream of the joint (RS 5 +000).
The averaged slope of the lower part of the Putih River (From River Station—RS 0 +000 m, that is the joint, to RS 13 +784 m) is about 0.0482. At the lower part until RS 5 +000, the slope along the alluvial fan zone is of 0.0274 and at the upper part, the slope of along the non-alluvial zone is of 0.06. See Figure 6.
2 PREPARATION OF ANAYLSIS
2.1 Similar study
A study of flash flood simulation was conducted
132
equivalent to the slope of 0.532 (v/h). This slope is approximately similar to that of upstream and downstream slope of the natural dam formed by the landslide. From this approximation, the height of the dam may between 15 m to 25 m. This approximation is used as the simulation run. The higher the dam the more water volume will be released during dam break.
3 SIMULATION AND ANALYSIS
3.1 Methods
The simulation of natural dam break and flash flood was conducted using HEC-RAS version 4.1.0 software. The simulation was aimed for recon-struction of the January 1, 2006 flood and focused on hydraulic aspects. The cross section data used for this study were provided from field measure-ment and comparison with data from ALOS DEM and the contour map published by the govern-ment surveying agency (BAKOSURTANAL). Correction and adjustment of the cross section data were done as necessary after revisit to the location (Kurniawan, 2012).
The scenarios of the simulation were as follows. The first is flow simulation on existing condition that is without natural dam forming; the second is flow simulation on the conditions with natural dam forming and the dam breaking. There are parame-ters that need to be determined in order to simulate the flood as closed as possible to the past event. These parameters are the height of natural dam, the dam break duration and the Manning rough-ness coefficient. The sensitivity of those param-eters individually to the peak discharge were first to be observed and then the optimal combination of parameters was to be found. Two flood marks, the first is in the middle of the Putih River lower
reach at RS 6 +984 (6.984 m upstream of the joint with Dinoyo River) and the second is at the down-stream and of computational domain (RS 0 +000) were used as the control parameters.
Boundary conditions in the simulation were as follows. The flood hydrograph of January 1, 2006 was used as upstream boundary condition. Nor-mal flow was assumed at the downstream end of the river reach. Therefore, friction slope (slope of the energy grade line) was used as downstream boundary condition. The friction slope was set at 0.031 following the bottom slope of downstream end of the river reach. Simulation was run from January 1, 2006 at 10.30 am to January 2, 2006 at 10.30 am or for 24 hours.
3.2 Data on the flash flood event
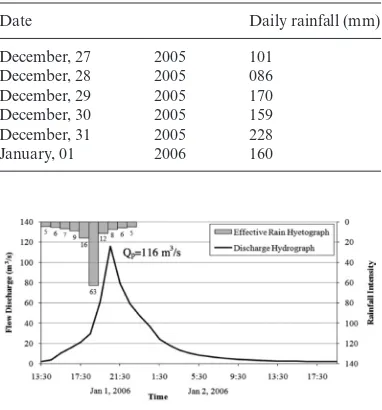
Daily rainfall data are available at Gentong that located in the middle of the river reach (Table 1).
The rainfall data of 1st January 2006 are con-verted into hourly rainfall by using the Alternat-ing Block Method and used to approximate the flood hydrograph by using the Nakayasu synthetic hydrograph. The effective rainfall was calculated using the runoff coefficient, which was adopted from the Mononobe Table. For steep mountainous and river in mountain area, the runoff coefficient was set to 0.85. The hydrograph for the analysis is as shown in Figure 9.
Figure 8. Photograph of landslide marks on the bank of Putih River 4 years after the event.
Table 1. Daily rainfall data before flashflood event at gentong.
Date Daily rainfall (mm)
December, 27 2005 101 December, 28 2005 086 December, 29 2005 170 December, 30 2005 159 December, 31 2005 228 January, 01 2006 160
133
The base flow was modeled using the synthetic hydrograph GAMA I. From the model result gives the base flow of 1.77 m3/s.
3.3 Modeling natural dam and the water flow before, during and after breaking of the dam
Davies, T. and McSaveney, M., 2003 shows the natural dam formed caused by Mt. Adams— Poerua River Landslide in New Zealand has slop-ing crest. The shape of natural dam was studied by Chjeng-LunShieh, et al. (2007). It is shown that the crest of natural dam is sloping down toward the bank in the opposite side of the failure. In this model the slope of natural dam crest was assumed to be of 0.018 (v:h). A spilling channel of 2 m depth and 5 m width is set at the lowest part of the natural dam crest.
Since HEC-RAS has no module for natural dam formation, for simulating sequence of changing flow conditions, the following approach was taken. At the beginning of the simulation, the flood flow merely passed the river reach in normal flow simulation. After the landslide has occurred and the river flow was blocked, the process is filling up the formed natu-ral reservoir with water until overtopping occurred.
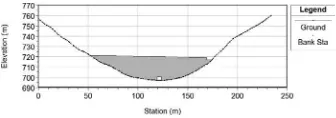
In simulating these consecutive processes, since the existence of dam has to be set at the beginning of the simulation, a gate is provided at the bottom of the natural dam. At the beginning of simulation the flood is able to flow without any obstruction other than the bottom friction at the location of landslide and closing the gate represents blocking the river flow by the landslide. Figure 10 shows the profile of natural dam across the river and the gate at the bottom of the dam.
To keep the simulation running when the flow is blocked by landslide, a pilot channel facility pro-vided by HEC-RAS was applied at the dam unless the simulation would get unstable and crash. The flow through the pilot channel was set to be of 0.05 m3/s and this value can be regarded as leakage
since the size is negligibly small compared with the peak discharge.
The breaking process initiation of the natural dam is controlled by maximum flow surface eleva-tion that gives approximately two meter depth of over flow above the spilling channel.
3.4 Maximum surface water marks
In finding the most appropriate model of the flash flood, the adjusting parameters are set follows; the height of natural dam (hd) is in ranges of 15 meters to 25 meters and the dam break duration (t) is in ranges of 6 minutes to 18 minutes.
The evaluation of the simulation result was carried out based on the maximum water surface elevation at the control points.
There are several maximum flood water eleva-tion marks informed by eyewitnesses. Only two of them are used for the control points. The first flood mark is in form of damage mark on an aban-doned house as shown in Figure 11. This mark is used as the first control point and its location is about 6 km (5.996 km) downstream of the natu-ral dam. The second flood mark is in form of a mark on trunk of a tree on the bank of the river as shown in Figure 12. This control point location is at the end of the river reach, that is about 12.98 km
Figure 10. Profile of natural dam model with a gate at the bottom of the valley.
Figure 11. Flood mark on an abandoned house at about 2 m above the ground surface (at RS 6 +984 and
+328.61 m above m.s.l.).
Figure 12. Flood mark on a trunk of tree (upper arrow) at 1.85 m above the ground surface (at RS 0 +000 and
134
downstream of the natural dam as is shown in Figure 13.
3.5 Sensitivity of parameters to the peak discharge
The first approximation of the Manning rough-ness coefficient value was taken by referring to Ven Te Chow, 1959. For natural river reach of sandy clay soil with bush, outcrop root, trunks of tree fallen into the river, the Manning roughness coef-ficient is between 0.15 and 0.17. Sensitivity study of n Manning focuses on the reach downstream of the natural dam since the flashflood start from the breaking natural dam. As the roughness condition varies along the river reach, the river reach from just downstream of the natural dam (upstream end) to the downstream end (the junction to Dinoyo River, is devided into 9 sub-reaches which have different n Manning values. The initial values of n Manning along all sub-reach are 0.15 to 0.17 as shown in Figure 14.
In the sensitivity analysis simulation runs, all the values of n Manning along the reach are changed by -10%, -5%, 0, +5%, and 10%. The other param-eters are set as follows; the height of natural dam
Figure 13. Location of the upper control point and lower control point (downstream boundary) whose flash flood marks.
Figure 14. Initial value of n Manning roughness coef-ficient from downstream of the natural dam.
Figure 15. Sensitivity of Manning roughness coeffi-cient to w.s.e. at the control points.
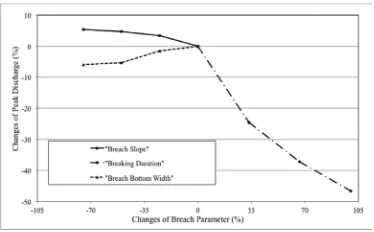
Figure 16. Curves of changing maximum discharge by variation of breach slope (h:v), dam break duration and bottom width of the breach.
is of 22 meters, the non-linearity rate of the breach growth was is of 2.5, the breach duration is of 9 minutes, the bottom breach width is of 30 m and the breach bank slope is of 1.88 (h/v). The result of the analysis is shown in Figure 15.
It can be seen that the change of w.s.e. by chang-ing (reducchang-ing and increaschang-ing) the roughness coef-ficient from -10% to +10% is in the order of 14 cm at the upper control point and of 11 cm at the lower control point.
The sensitivity analysis to the peak discharge (at just the downstream of breaking natural dam) was conducted for variation of opening breach slope (h/v), dam break duration and the bottom width of the opening breach values. The result of the analy-sis is shown in Figure 16 and Table 2.
135 Figure 17. Curves of maximum w.s.e. at the upper control point and the observed mark of maximum w.s.e (horizontal dashed line).
Table 2. Peak discharge of varying breach parameters.
Scenarios control point and the observed mark of maximum w.s.e (horizontal dashed line).
Figure 19. Hydrograph of simulation result at the upper control point, A, and at the downstream end of river reach—the lower control point, B.
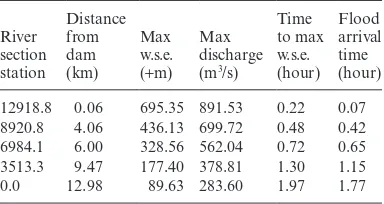
Table 3. Tracing of flood at 5 locations.
River
12918.8 0.06 695.35 891.53 0.22 0.07 8920.8 4.06 436.13 699.72 0.48 0.42 6984.1 6.00 328.56 562.04 0.72 0.65 3513.3 9.47 177.40 378.81 1.30 1.15 0.0 12.98 89.63 283.60 1.97 1.77
3.6 Finding the most probable natural dam height and breach duration of the Januari 1 2006 flash flood
In order to simplify the effort of approximating the Putih River flash flood occurring on January 1 2006, only the two most sensitive parameters, natu-ral dam height and breach duration were adjusted. Figure 17 and Figure 18 show the results of the model calibration at upper and lower control points respectively.
It can be seen that the maximum water sur-face elevation of the simulation results is closed to the observed data in ranges of the natural dam height (hd) of about 22 meters to 24 meters. In this model calibration process, the dam break duration (t) appeared to be less influencing than the dam height.
Typical of simulation result in form of hydrograph is shown in Figure 19.
3.7 Tracing the Januari 1 2006 flash flood
136
4 CONCLUSION
Modeling the flash flood caused by natural dam break is a challenging effort since the data at the event are rarely available. However, with some reasonable assumption the disastrous Putih River flood in January 1, 2006 can be well approximated.
It is concluded that the natural dam height is the most sensitive parameter in determining the peak discharge. The second most sensitive parameter is the dam break duration. Therefore, in simulating the probable future events, especially for disastrous flood early warning purpose, those two parameter need to be used as the main varying parameters.
This finding suggests us that study of natural dam forming and its breaking is a very important part for improving the capacity of the early warn-ing system. Furthermore, for steep valley banks, continuous monitoring of the land creeping or cracks is needed for anticipating actions either with structural measures or simulating several probable landslide occurances for providing necessary haz-ard maps.
ACKNOWLEDGEMENT
This paper is tightly related to the collaboration research between and Balai Sabo that is part of the Agency for Research and Development (ARD), the Ministry of Public Works (MoPW), the Repub-lic of Indonesia and the Civil and Environmental Engineering Department (CEED), Universitas GadjahMada (UGM) that is part of the Direc-torate General of Higher Education (DGHE), the Ministry of Education and Culture (MoEC), Republic Indonesia on the development of numer-ical model for early warning system of debris flow disaster.
Therefore, we would like to express our appreci-ation and gratitude to management of the Hydrau-lics Laboratory and the management of Master Program on Natural Disaster Management of CEED UGM for their support, especially in fas-cilitating the collaboration research to be part of the education program. Our appreciation and grat-itude are also addressed to Balai Sabo of DGWR MoPW for supporting part of research fund and most of data for the analysis.
REFERENCES
Chjeng-LunShieh, et al., 2007, Study on Warning Crite-ria of Rainfall and Hazard Zone Mapping for Land-slide Hazards, 2nd International Conference on Urban Disaster Reduction, November 27–29.
Chow, V.T., 1959, Open-Channel Hydraulics, McGraw-Hill, Kogakusha, Ltd., Tokyo.
Davies, T. and McSaveney, M., 2003, Mt. Adams Land-slide “lessons on preparing for large earthquakes”, Natural Hazards Update No. 2.
Kurniawan, Y.T., 2012, 1-D Simulation of Flood Due to Natural Dam Break (Case Study of Flash Flood Dis-aster in Kaliputih River of Jember District In 2006), Master Thesis, Civil and Environmental Engineering Dept., UniversitasGadjah Mada, Indonesia.
Naryanto, H.S., Wisyanto, Marwanta, B., 2007, Potensi Longsor dan Banjir Bandang serta Analisis Kejadian Bencana 1 Januari 2006 di Pegunungan Argopuro, Kabupaten Jember (Potential of Landslides and Flashflood Occurrences in Argopuro Highlands, Jember District and Januari 1, 2006 Disaster Analysis), Alami, Vol. 2.
Watanabe, F., Jogasaki, M., Nakanishi, H., Ueda, Y., 2006, (Immediate Report) Sediment-related disasters that struck Indonesia in January 2006 (Banjir Ban-dang Disaster, Jember District, East Java Province), (http://www.saboint.org/case/2006_jan_indonesia. html).
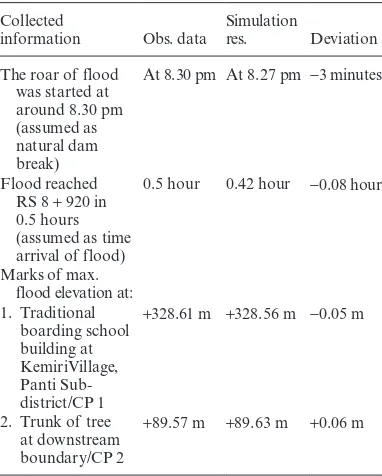
Table 4. Quantitative comparison between the simula-tion results and the collected informasimula-tion.