This article was downloaded by: {Ismail, Mohd /Iasmadi}
On: 20 May 2011
a」」・セウ@ dela1ls: Access Details: {subscription number 937785540) Publisher Taylor & Francis
-
?
lnfonna Ltd Reg1slered in England and Wales Registered Number: 1072954 Registered office: Mortimer House, 37-41 Mortimer Street, London WIT 3]H, UK
Geomatics, Natural Hazards and
Risk
Publication details. including iョウエイオ」エゥッョセ@ for 。オエィッイセ@ am.I subscription info1 mation· ィエエーZ OOv\キキNゥ ョヲッイュ。キッイャ\ャ N」ッュOセ ューー ャ@htle-conknl •l913444 127
Classification model for hotspot occurrences using a decision tree method
!mas Sukaeslh Sitanggang"; Mohd Hasmadi lsma!IL• Department of Computer Science. Bog or. iョ、ッョ・ウゥ。セ@ Forest Surveying and Engineering Laboratory, Faculty ofFort'Stry. Universih Putra Malaysia, Serdang, Selangor, m。ャ。ケセQ。@
Online publication date. 19 May 201 I
To cite this Article Silanggang, !mas Sukaesih and Ismail, f\ 1ohd Hasmadi(2011) 'Classificat1011 model for hotspot occurrences using a decision lree method', Geomat1cs, Natural Hazards and Risk. 2: 2, t t 1 - 121
To Llnlc to this Article: DOI: .10. 1080/ 19475705.20 l t.565807 URL: http:. /dx .<loi.orgJ 10. tOR0/ 19475705.2011.565807
PLEASE SCROLL DOWN FOR ARTICLE
Full terms and conditions of use: http://www.informaworld.com/terms-and-conditions-of-acceas.pdf Thia article may be used for research, teaching and private study purposes. Any substantial or evateMatic reproduction. re-distribution. re-selling. loan or sub-licensing, systematic supply or distribution in any form to anyone is expressly forbidden.
The publisher doe• not give any warranty express or implied or make any representation that the contents will be complete or accurate or up to date. The accuracy of any instructions, formulae and drug doses should be independently verified with primary sources. The publisher shall not be liable for any loss, actions, claims. proceedings, demand or costs or damages whatsoever or howsoever caused arising directly or indirectly in connection with or arising out o! the use of this material.
... ...
0
...
) ,
" :£ 0
N ...,
"' 0
"' .. ...
o(
g・ッュ。ャゥ」セN@ Natural Ha:ards and Risk
Vol. 2, No. 2, June 20 11, 111 - 121
C\
Taylor & Francisセ@ Tiytof "f..,,.,. Gtoup
Classification model for hotspot occurrences using a decision tree method
IMAS SUKAESlll SITANGGANGt and MOHD HASMADI ISMAIL*t tDepartmenl of Computer Science. Bogor Agricullural University, Bogor 16680,
Indonesia
tForest Surveying and Engineering Laboratory. Faculty of Forestry, Universiti Putra Malaysia, Serdang 43400 UPM , Selangor, Malaysia
(RL'ceil'ed II No1·ember 20 JO; i11 ji11ul form 20 February 20 II)
Forest fires in Indonesia mostly occur because of errors or bad intentions. This work 、」ュッョセエイ。エ・ウ@ the application of a decision tree algorithm, namely the C4.5 algorithm. lo develop a classification model from forest fire dala in the Rokan Hilir district, Indonesia. The classificalion model used is a collection of lf-TllEN rules that can be used lo predict hotspot occurrences for forest fires. The spatial data consist of the location of hotspot occurrences and human activity factors including the location of city centres, road and river networks as well as land cover types. The results were a decision Lree containing 18 leaves and 26 nodes with an accuracy of 63. 17%. Each leaf node holds po:.itive and negati"e examples of hotspot occurrences whereas the rool and internal nodes contain attribute test conditions: the distance from the location of examples to the nearest road. ri\er. city centre and the land cover types for the area where the c:wmplcs are located. Positive exaniples arc hotspot location:. in the study area and negative arc randomly generated points within the aren at least I km away from any positive example. The clas:.ification model categorized whether the region was susceptible to hohpots occurrences or not. The model can be used to predicl hotspot occurrences in new locations for fire prediction.
1. Introduction
Forest fires in Indonesia are not a new phenomenon and seem to be a yearly tradition especially in the dry season. Almost I 00% of fo rest and land fires in Indonesia are caused by human -made factors both on purpose and accidentl y (Lailan 2008), where<U> natural factors such as lightning, vo lcano eruption .and burned coa l have insignificant innuences on the fires compared to human factors. Fires are considered as a cheap way to clear land for new plantations and also to extract natural resources, such as harvesting timber in forests. Forest fires lead to :;evcral environmental problems including loss of forest as ca rbon sink, loss of biodi.iersity, transboundary haze pollu tion, as well as significant economic losses (Danan 2008). Fire prevention is important for so lving forest 6rc problems in Indonesia in order to avoid significant material damages to the natural environment. Therefore study related to the identification of forest fire risk is necessary. Many work s have been conducted to develop forest lire risk models fo r regions in lndonesia (Juruntorn 200 I, Mulyanlo
*Corresponding author. Email: imas.sitanggang<ii gmail.com
...
...
0 "'
0
,.. ...
.... 0
...
...
..
i
I 12 l.S. Sita11gga11g and M.H. Ismail
et al. 200 I, Mustara 2006, Damm 2008). Geographic information systems (GTSs) and
remote sensing have been used to analyse forest fire data (Mulyanto et al. 2001,
M ustura
2006,
Dunnn 2008). In addition to GIS5 and remote sensing, エィセ@ CompleleMapping Analysis method (CMA) (Jaruntom 200 1, Mustara 2006) and Multi-criteria
Analysis (MCA) (Danan 2008) are aJso applied to understand the causes of fire risk
factors and interactions between them.
Huge amounts of spatial data in many areas have been collected in various computer systems. Nowadays spatial databases. as one of the componenl5 of GISs, store large numbers of spatial features and their relationships for further manipulation and analysis help users in decision-making processes. This situation has led to an increase in applying data mining techniques lo extract the interesting and useful but implicit spatial patterns from large numbers of spatial data. Some functionality in data mining, including association rules mining. classification and prediction, as well as cluster analysis. have been successfully applied for analysing
セー。エゥ。ャ@ data related Lo forest fires. The association rule algorithm namely Apriori was applied to ana lyse the probability and intensity of the forest fire effectively with
coarse forest fi re data in the forest area in the south of Beijing (Hu et al. 2009). Liang
and Fu ling (2007) proposed the incremental association mining method to obtain the primitive estimation of the fire grade from the historical fire data. The clustering algorithm K-means, together with fuzzy logic, have been applied to determine spots at the risk of forest fire from spatia l data (Kall i and Ramakrishna 2008). Another
study by Seng et al. (2003) used clustering and Hough transformation to reduce false
alanns from the set of hotspots in forest fire regions derived from National Oceanic
and Atmospheric Administration (NOAA) images. Daniela el al. (2006) utilized
classification algorithm5 including logistic regression and decision trees (J48).
random forests. bagging and boosting of decision trees to develop predictive models of hotspot occurrences based on the forest structure GIS, meteorological ALADIN data and Moderate Resolution Imaging Spectroradiometcr (MODIS) satellite data. This paper presents the work of extracting beneficial information from forest fire
data by utilizing a decision tree algorithm. namely C4.5. We develop a classification
model for hotspot occurrences based on human activity factors including the location of city centres. road networks, river networks and land cover types in the Rokan Hilir district, Riau Province, Indo nesia. The model provides descriptions for areas where hotspots occur. This information is important in planning fire fighting strategies. We can also predict hotspot occurrences in new areas given their human
activity factors. Predicting hotspot occurrences is essential as an early warning
system for preventing large forest fires and thus major damages can be avoided.
2. S pa tial data
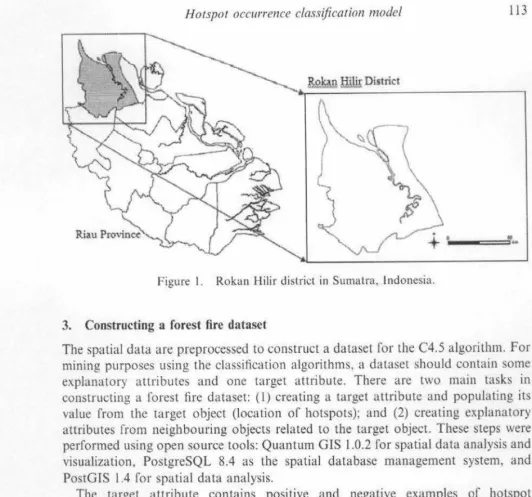
The study area is the Rokan Hilir district in the Riau Province, Sumatra Indonesia (figure I). The total area of Rokan ll ilir is 896 142.93 ha or approximutely 10% of
the total area of the Riau Province (8 915 015.09 ha). It is situated in area between
100 17'- 101 · 21' East longitude and 1° 14' - 2 45' North latitude.
There are two categories of the spatia l data: (J) a target object localion of
....
.... 0
N
0
"' M "' 0
"'
. ....
...
i
....
Hotspot occurrence 」ャ。ウウセヲゥ」。エゥッョ@ model 113
---===' ..
Figure I. Rokan Hilir district in Sumatra, Indonesia .
3. Constructing a forest fire dataset
The spatial data are preprocessed to construct a dataset for the C4.5 algorithm. For
mining purposes using the classification algorithms, a dataset should contain some
explanatory attributes and one target attribute. There are two main tasks in
constructing a forest fire dataset: (I) creating a target attribute and populating its
value from the target object (location or hotspots); and (2) creating explanatory attributes from neighbouring objects related to the target object. These steps were
performed using open source too ls: Quantum GIS 1.0.2 for spatial data analysis and
visualization, PostgreSQL 8.4 as the spatial database management system, and
PostGIS 1.4 for spatial data analysis .
The target attribute contains positive and negative examples of hotspot
occurrences. Positive examples are locations of hotspots throughout the year 2008
recorded by NOAA- l 8. Data containing the locations of hotspots were obtained
from the Ministry of Forestry, Republic of Indonesia. Negative examples are
randomly generated and they are located within the area at least 1 km away from
any positive examples. For this purpose we create a I km bufTer from positive
examples and extract all randomly generated points outside the buffer to be negative
examples. Figure 2 shows the dislribution or positive and negative examples. Tn order to create explanatory attributes we applied spatial relationship operators
to relate neighbouring objects and the target object consisting of positive and negative examples of hotspot occurrences. The target object and neighbouring objects (river, road and city centre) arc shown in figure 3. The distance between a location of example and the nearest river is calculated using the spatial relationship operator ST Distance in PostGIS and then the result is a value of the attribute
min_disz_to_river in the dataset. Distances from locations of example are also
determined to the nearest road and nearest city centre. Afterwards the results arc
stored respectively in the attribute min_dis1_1o_road and min_dist_lo_city.
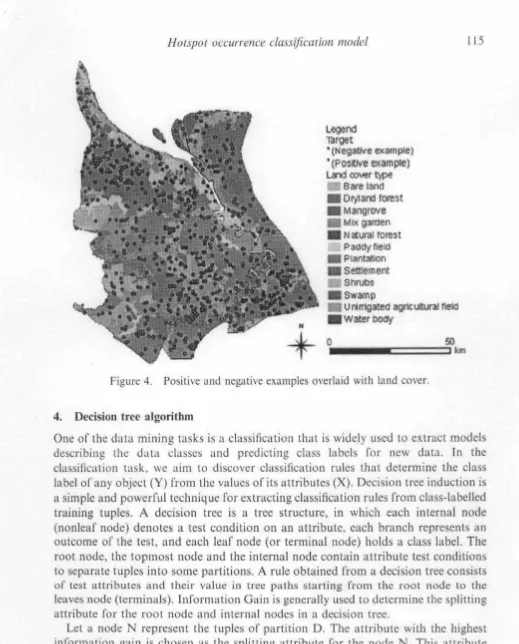
Another attribute land_cover _type stores types of land cover for the area where the
examples of hotspot occurrences are located (figu re 4). The spatial relationship operator ST_ Within in PostGIS was applied to determine values of attribute
[image:4.614.4.537.54.551.2]114
.... 0
...
>.
•
:E
0
"'
...
Ill0
N
-LI
<
...
'O
i
"
:c
't)
1i x
セ@
...
a
ti .':!
>-"'
"O ., "Oセ@
セ@
8
Figure 2.
J.S. SiwngK<1111!. and M .H. fo11uil
Legeoo
lbrget
• (NegatJve example) • (PosltNe example)
0
so
... c::::====:::::J kM
Positive and negative examples of hotspot occurrences.
N
+
Lqnd
lllrget
• (Negauve exampte)
• (Positive example) Ot,' oenter
•
0
so
...
」Z]]]]]]セ ォュ@.... ...
0
"'
0
"' ,., "'
0
"'
....
..,
セ@
"
セ@
...
....
セ@
Cll
....
Hotspot occurrence classificmion model
N
Legend
'TI!rget
• (Negattve example)
• (Pos1bVe example) l 。ョ、セエIッー・@
Bare land
• Drytard torest
•Mangrove
Mix garden
• Natural rorest
Paddyf1eld
•Plantation
• Settlement ShruDs •swamp
u nlmgated agrtcultural field
• water body
+
o••-..
===:::::Jsokm
Figure 4. Positive and negative examples overlaid with land cover .
4. Decision tree algorithm
115
One of the data mining tasks is a classification that is widely used to extract models describing the data classes and predicting class labels for new data. In the classification task, we aim to discover classification rules that determine the class label of any object (Y) from the values of its attributes (X). Decision tree induction is
a simple and powerful technique for extracting classification rules from class-labelled training tuples. A decision tree is a tree structure, in which each internal node (nonleaf node) denotes a test condition on an attribute. each branch represents an
outcome of the test, and each leaf node (or terminal node) holds a class label. The root node, the topmost node and the internal node contain attribute test conditions to separate tuples into some partitions. A rule obtained from a decision tree consists
or
test attributes and their value in tree paths starting from the root node to the leaves node (terminals). Information Gain is generally used to determine the splitting attribute for the root node and internal nodes in a decision tree.Let a node N represent the tuples of partition D. The attribute with the highest information gain is chosen as the splitting attribute for the node N. This attribute minimizes the information needed to classify the tuples in resulting partitions and reflects the least randomness or 'impurity' in these partitions (Jiawei and Micheline 2006). The expected information needed to classify a tuple in D is given by
'""'m
lnfo (D ) = - L ,;= t Pilog2(JJ;) (I )
[image:6.614.6.525.16.660.2]0 ....
M
"' 0 ....
" ...
<
..
'O
a
=
=
'Oi
...
...i
M
116 / .S. Siw11gga11g and M.H. Ismail
identify the class label of a tuple in D (Jiawci and Micheline 2006). ln fo(O) is abo
known as the entropy of 0 . Assume that we want to partition che tuple' in 0 on an
attribute A having 1· distinct values, {ai. a2 • .... a,.}. The resulting partitions arc
related to the bra nches of the node N. lnfoA(D) is the expected information required to classify a tuple from D ba ed on the partitioning b} A (Jiawei and Micheline 2006).
(2)
The
エ・イュセ@
acts as the weight of thcjth partition. The information gain is defined a::i the difference between the original information requirement (i.e. based on just the proportion of classes) and the new requirement (i.e. obtained after partitioning on A)(Jiawei and Micheline 2006).
Gain (A) = ln fo( O) - ln foA( D) (3)
The attribute A with the highest informatio n gain, Gain(A). is chosen as the splitting attribute ar node N.
Decision tree algorithms are popular in knowledge discovery bccuuse they can handle high-dimensional data and the tree form of acquired knowledge is genera lly easily interpreted by humans. In addition. we can generate JF-THEN rules from the tree paths starting from the root node to the lea f node (termi nals). A ru le consists of test attributes in its body part and a target class as the head part of the rule. The collection of IF-THEN rules is relati vely easy to implement in developing a classifica tion system using a programming language. The most common algorithms for developing decision trees are Quinlan's 103, the C4.5 as a successor of I03 and CART (Classification and Regression Tree). The 103 algorithm computes the information gain for each attri bute and selects one that has the highest value. The C4.5 is a successor of 103 thal learns decision tree classifiers. This algorithm visits each decision node recursive!} and selects optimal splitting anributes umil the
datasec satisfies a stopping criterion. The rccur1.,ion セエッーNNL@ when either there ゥセ@ only
one class remaining in the data, or there are no features left (Stephen 2009). The C4.5 algorithm also uses Informatio n Gain to select optima l splitting attributes. This algorithm uses a different method called rule post-pruning. There are three main
tasks in C4.5: (I) generate the tree using the ID3 a lgorithm, (2) convert the tree to a
set of IF-THEN rules, and (3) prune each rule by removing preconditions if the
accuracy of the rule increases without it (Stephen 2009). Nowadays the C4.5 has
probably become the most commonly used and studied decision tree algorithm. The
results of Tjen-Sien el al. (2000) show that among decision tree algorithms, the C4.5
provides good combinations of error rate and speed.
Classification and Regressio n Trees is another commonly used algorithm fo r the
induction of decision trees for classification proposed by Brieman et al. ( l 984).
0
"'
M
Ill 0 ....
..
...
<
...
..
w
.,
...
Hotspot occurrence classificarion model 117
adjacent levels. In developing a tree using CART, there may be no good binary split
on an attribute that has a good multi-way split (Kononcnko 1995). In our study,
attributes in a spatial dataset have
many
district values that will become ouLComes ofthe test attributes. For example land cover type is classified into some categories including plantation, swamp, shrubs, bare la nd. dryland forest and so on. These
categories merged with spatial relations fo rm two branches from the node. The lefl
branch contains objects related lo one of these categories, for example plantation, while objects in the right branch are associated to all other categories. Characteristics of objects in the right branch may not be specific because this node is related to some
different categories of land cover rather than
a
single category. Jn this case the rightbranch may be extended to the next levels of the tree. This process may construct a
less interpretable spatial decision tree because multiple splits on the same test attributes may occur at more than one level. For that we select the C4.5 algorithm
that provides multi-way spli ts instead of the CART algorithm that applies binary
splits in constructing the tree.
In order to evaluate the performance of the classification model, a confusion
matrix is calculated (Pang-Ning et al. 2006). The entries of the matrix store a number
of test tuples predicted correctly and incorrectly by the model. The model accuracy is commonly used to determine the performance of the model. It is defined as
(Pang-Ning et al. 2006):
A ccuracy
=
Number of correct predictionsTota l number of predictions (4)
5. Results and discussion
The forest fires dataset was analysed using the J48 module as a Java implementation of C4.5 in the data mining toolkit Weka 3.6.2. The 148 package is a Weka's implementation of the decision tree learner. The package is a directory containing a collection of related classes that builds a C4.5 decision tree. Some classes included in the package are classes fo r computing the entropy and the information gain, and a class implementing a binary C4.5-like split on an attribute.
The dataset contains 744 luples (374 positive examples and 370 negat ive examples). There is one target attribute (class of examples) and four explanatory
attributes: (I) mi11_dist_to_road, (2) 111i11_dist_to_ril'er, (3) mi11_dis1_1o_city
represent-ing the distance from the location of examples to the nearest road, river and city
centre, respectively. (4) land cover type fo r the area where the examples are located.
The dataset was divided into lwo groups: training data to develop a classification
model and エ・セエゥョァ@ data to calcu late the accuracy of the model. We applied the 10·
folds cross validation (Ian and Eibc 2005) to determine the accuracy of the classifier. The decision tree concains L8 lcavc:i and 26 nodes where the fi rst test attribute is land cover type. Below are the rules extracted from the tree:
l. IF landcovertype = Plantation AND mi n_dist_to_river < - 4546.97 metres
TH EN Hotspot Occurrence
=
F (187 .0/ 76.0)2. IF landcovertype
=
pj 。ョエセ エ ゥッョ@ AND min_dist_to_river > 4546.97 metresTHEN Hotspot Occurrence
=
T {125.0/ 30.0)3. IF landcovertype = Swamp AND min_dist_to_road < = 3366.85 metres
0
N
M
"'
0
N
..
u
<(
.... ....
!
...
118 l.S. Sitanggang and M.H. Ismail
4. IF landcovertype = Swamp AND min_dist_to_road
>
3366.85 metresTHEN Hotspot Occurrence = T (2.0)
5. IF landcovcrtype =Shrubs THEN Hotspoc Occurrence = F (63.0/28.0)
6. IF landcovertype = Bare_land THEN Hotspot Occurrence - T (44.0/8.0)
7. IF landcovenype = Unirrigated_agricultural_field AND min_dist_
to_river < = 353.66 metres AND min_dist_to_road < = 77.59 metres
THEN Hotspot Occurrence= T (2.0)
8. IF landcovertype
=
Unirrigated_agricultural_field AND min_dist_to_river< = 353.66 metres AND min_dist_to_road > 77.59 metres THEN
Hotspot Occurrence = F (16.0)
9. IF landcovertype = Unirrigated_agricultural_field AND min_dist_to_river
> 353.66 metres THEN Hotspot Occurrence = T (40.0/ 19.0)
IO. IF landcovertype = Dryland_forest AND min_dist_to_city < = 14807.65
metres THEN Hotspot Occurrence= F (77.0/27.0)
11. IF landcovertype = Dryland_forest AND min_dist_to_city > 14807.65
metres THEN Hotspot Occurrence = T (16.0/3.0)
12. IF landcovertype
=
Settlement THEN Hotspot Occurrence = F (8.0/1.0)13. IF landcovertype = Mangrove THEN Hotspot Occurrence = F {l l.0)
14. IF landcovertype = Mix_gardcn AND min_dist_to_city < = 16354.78
meLres THEN Hotspot Occurrence = F (65.0/ J 5.0)
15. IF landcovertype = Mix_garden AND min_dist_to_city
>
16354.78 metresAND min_<list_to_city < = 23910.15 metres THEN Hotspot
Occurrence = T (54.0/10.0)
16. IF landcoverlype = Mix_garden AND min_dist_to_city > 23910.15 metres
THEN Hotspot Occurrence = F (3.0)
17. IF landcovertype = Paddy_field THEN Hotspot Occurrence = T (25.0/ 12.0)
18. IF landcovertype = Water Body THEN Hotspot Occurrence = F (3.0/1.0)
The numbers in (parentheses) at the end of each leaf represent the number of
examples in this leaf whereas the number of misclassified examples are given after a
I
slash / . There are 470 (63.172%) instances (tuples) Lhat are correctly classified bythe tree. The classification model can be used to predict the hotspot occurrences on
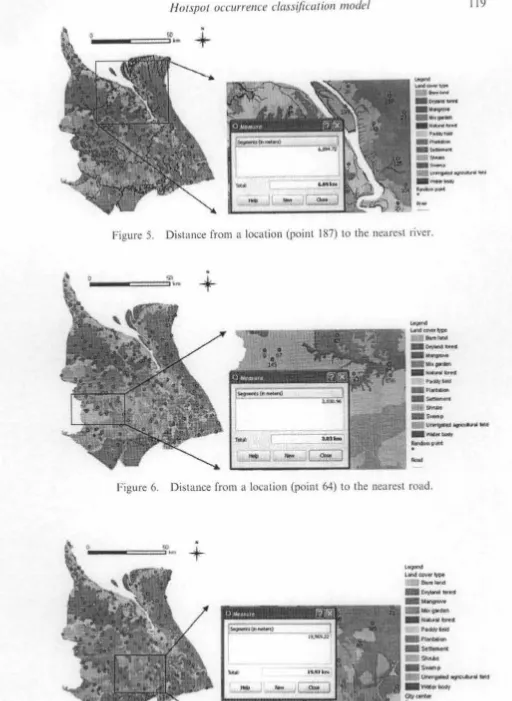
tbe new location. To show how this task can be performed we generate randomly
165 points that do not exist in the dataset. Figure 5 shows that a point 187 is
located in the plantation where the distance to the nearest river is 6.09 km.
According lo Rule 2 having the body 'landcovertype = Plantation AND
min_dist_to_river > 4.546.97 metres', this point is classified into a positive
example (fire occurrence is true).
Figure 6 shows a point 64 localed in swamp area where the distance to the nearest
road is 3.03 km. According to Rule 3 having the body 'landcovertype = Swamp
AND min_dist_to_road < = 3,366.85 metres', this point is classified into a false
example (no fire occurrence). In addiLion lhe points 9, 67, 145 are located in shrubs
thus from Rule 5 these points are classified into false examples (no hotspot
occurrences).
Another example is given in figure 7 that shows point J 28 located in mix garden
where the distance to che nearest city centre is 19.97 km. According to Rule 15 with
the body ' landcovertype
=
Mix_garden AND min_dist_to_city>
16,354.78 metresAND min_dist_to_city < = 23,910. 15 metres', this point is classified into a true
0 "' ,...
....
0 "'
Hotspot oc:curre11ce clmsificatio11 model 119
•
PMMM
M] ]]セriセᄋ@
+
Figure 5. Distance from a location (point 187) to the nearest river .
.
0 'l"I
----=======>••
+
Figure 6. Distance from a location (point 64) to the nearest road .
•
P MMM M] ]]]ゥ セ@
....
+
[image:10.619.9.521.54.755.2]....
... 0
N
Cl
...
M
Ill
Cl
"' ...
<
...; ....
セ@
..
セ@
120 l.S. Sitanggang and M.H. Ismail
6. Conclusion
This work applied the C4.5 algorilhm to develop a decision tree to classify forest
hotspot occurrences in the Rokan Hilir District. Riau Province, Indonesia. The
target attrib ute contains positive examples (hotspot occurrences) and negative examples, whereas explanatory attributes related to human activity factors, i.e. the location of city centres, road networks, river networks and land cover types.
There are 18 classification rules generated from the tree with an accuracy of
63. J 7%. The use of the C4.5 algorithm on the forest fire dataset results in the
decision tree predicting fire occurrences and describing characteristics of areas
where the fires occur. The tree structure can easily be converted to a set of
simple IF-THEN classification rules as a classification model for hotspot
occurrences. The model validation should be performed by testing the model
on new areas of forest fires. Predicting hotspot occurrences is important for
wildfire prevention and determining fighting strategies. This work significantly
shows the benefits of applying data mining techniques, namely
a
decision tree, onforest fire data to develop a classification model for predicting hotspot occurrences.
Acknowledgment
The authors are grateful to the anonymous reviewers for their comments/suggestions that have helped to improve an earlier version of the paper.
References
BREIMAN, L., FRIEDMAN, J.H., 0LSHEN, R.A. and STONE, CJ., 1984, Classification and
Regression Trees (Boca Raton, FL: Chapman & Hall/CRC Press) .
DANAN, P.H., 2008, A RS/GIS-based multi-criteria approaches to assess forest fire hazard in
Indonesia (case study: West Kutai District, East Kalimantan Province). Master thesis, Bogor Agricultural University, Indonesia.
DANIELA, S., PANCE, P., ANDREJ, K., SAso. D. and KATcRINA, T. , 2006, Learning to predict forest fires with different data mining techniques. In Cor!ference 011 Data Mining and Da{(( Warehouses (SiKDD 2006), Ljubljana, Slovenia.
Hu, L., ZHOU, G. and Qi u, Y., 2009, Application of a priori algorithm to the data mining of the wildfire. In Sixth International Conference on Fuzzy Systems and Kuowledge Discovery, (New York: IEEE Press), pp. 426-429.
IAN, H.W. and EtBE, F., 2005, Dara Mining: Practical machine learning tools and techniques (San Francisco, CA: Morgan Kaufmann Series).
JARUNTORN, B., 200 I, GJS-based method in developing wildfire risk model (a case study in Sasamba, East Kalimantan, lndonesia). Master thesis, Bogor Agricultural University, lndonesia.
JtAWEI, H. and MICHELINE, K., 2006, Da1a Mining Concepts and Techniques (San Diego, CA: Morgan-Kaufmann).
KALLI, S.N.P. and RAMAKRISHNA, S., 2008, An autonomous forest fire detection system based on spatial data mining and fuzzy logic. IJCSNS lnternatio11a/ Journal of Computer Science and NellVork Security, 8, pp. 49- 55.
0
"' ...
"'
0
"'
.,
o(
....
...
!
...
Horspo1 occurre11ce classification model 121
LAILAN, S., 2008, Kebakuran Hutan dan Lahan di Indonesia: Perilaku Api. Penyebab, dan Dampak Kebakaran (Malang: Bayumedia) (in Bahasa).
L1Ar-.C. Y. and Ft:UNG, B., 2007, An im:remental data mfomg method for spallal association
rule in G!S based fireproof system. In Jnternational Conference on Wireless Communications. Networking and Mobile Computing, 21 25 September 2007, Shanghai (New York: l EEt.), pp . 5983- 5986.
MULYANTO. D., MASAl\.IU, A. and SATOSlll. T., 2001. Forest fire hazard model using remote sensing and geographic information systems: toward understanding
or
land and forest degradation on lo\\ land areas of East Kalimantan Indonesia. In :!:!"1 Asum Co11lere11ce011 Remote &nsing, 5 9 November 200 I. Singapore. pp. 526 531.
Ml s1 i\RA, H .. 2006. Pemodclan spasial セ・イ。キ。ョ。ョ@ kebakarun di lahan gambut: studi kasus Kabupaten l3cngkalis, Provinsi Riau. Master thesis. Bogor Agricultur:.il University. Indonesia (in Bahasa).
PANG-NING. T .. M1cH/\rL, S. and V1r1N, K .. 2006. /111rocluctiu11 to Dara mゥQQゥQQセ@ (Saddle River. NJ: Pearson Education. Inc.).
Scr-.o, C.T.,
w,
1'1'r, II .. K1\1, H.L. and LrF, C.Y., 2003. Spatial data mining: clustering of hot spots and pallern recognition. In Geoscience and Remote Sensing sケューッセゥオュN@ 21 25 July 2003, (New York: IEEE), pp. 3685 3687.STrPllFN, M ., 2009, Machine Leaming: An algori1'1111ic perspective (Boca Raton, FL: CRC Press).
Tirt--SIF"-, L., Wn-Y11', L. and Yu-SHAN, S., 2000, A comparison of prediction accuracy, complexity, and training time of thirty-three old and ne'' classification algorithms.