APPLICATION OF LIQUID BIO-FERTILIZER REDUCED
THE NEED OF CHEMICAL FERTILIZER IN BLACK
GALINGALE (
Kaempferia parviflora
) PRODUCTION
ULYA ZULFA
A24080048
DEPARTMENT OF AGRONOMY AND HORTICULTURE FACULTY OF AGRICULTURE
ABSTRACT
ULYA ZULFA. APPLICATION OF LIQUID BIO-FERTILIZER
REDUCED THE NEED OF CHEMICAL FERTILIZER IN
BLACK GALINGALE (
Kaempferia parviflora
) PRODUCTION.
(Supervised by NURUL KHUMAIDA and SINTHO W. ARDIE)
Kaempferia parviflora Wall ex. Baker (black galingale) is a medicinal plant which has high potential to be developed in Indonesia as medicinal products. Thus, in order to develop appropriate standard operasional procedure in K parviflora cultivation, this research was conducted to study the effect of bio-fertilizer applicationon late-vegetative growth and yield of rhizome. The experiment was arranged in Randomize Completely Block Design (RCBD), where the treatment were Control (0 L ha-1 of bio-fertilizer and 100% of chemical fertilizer), D1 (15 L ha-1 of bio-fertilizer and 50% of chemical fertilizer), D2 (22.5 L ha-1 of bio-fertilizer and 50% of chemical fertilizer), and D3 (30 L ha-1 of bio-fertilizer and 50% of chemical bio-fertilizer). The 100% chemical bio-fertilizer application were consisted 300 kg ha-1 urea, 250 kg ha-1 SP-36, and 250 kg ha-1 KCl. The block of the experimental design was based on the shading position of raised bed and difference of sun-lighting time.
APPLICATION OF LIQUID BIO-FERTILIZER REDUCED
THE NEED OF CHEMICAL FERTILIZER IN BLACK
GALINGALE (
Kaempferia parviflora
) PRODUCTION
The thesis is submitted to the Faculty of Agriculture as one of the
requirements for achieving Bachelor of Science in Agriculture
ULYA ZULFA
A24080048
DEPARTMENT OF AGRONOMY AND HORTICULTURE FACULTY OF AGRICULTURE
Title : APPLICATION
OF
LIQUID
BIO-FERTILIZER
REDUCED THE NEED OF CHEMICAL
FERTILIZER IN BLACK GALINGALE (
Kaempferia
parviflora
) PRODUCTION
Name :
ULYA ZULFA
NIM :
A24080048
First Supervisor
Dr. Ir. Nurul Khumaida, MSi NIP. 19650719 199512 2 001
Second Supervisor
Dr. Sintho W. Ardie, SP., MSi NIP. 19820706 200501 2 001
Head of Department of Agronomy and Horticulture Faculty of Agriculture
Dr. Ir. Agus Purwito, MSc. Agr. NIP 19611101 198703 1 003
BIOGRAPHY
Author was born at 6 February 1990 in Kendal, Central Java. Author was first child from H.Achmad and Hj.Suminah, with one siblings from Aminatun Nafi’ah. Author spends her childhood in Kendal.
Author started her formal education in 1996 in SD Negeri 1 Purwokerto, 2002 in SMP Negeri 1 Brangsong, and continued to SMA Negeri 1 Kendal at 2005. At 2008, author continued her education in Departement of Agronomy and Horticulture, Bogor Agricultural University.
PREFACE
Praise and thanks are prayed for Allah SWT so the author could finish a research for bachelor degree thesis entitled "Application of Liquid Bio-Fertilizer Reduced the Need of Chemical Fertilizer in Black Galingale (Kaempferia Parviflora) Production". Author would like to express her gratitude to these people:
1. Dr. Ir. Nurul Khumaida, M.Si and Dr. Sintho Wahyuning Ardie, SP., M.Si as supervisors who had given their guidance and direction during writing and accomplishing this bachelor degree thesis.
2. Dr. Ir. Sandra A. Aziz, MS. as external examiner who gave advise so the author can improve the quality of this bachelor degree thesis.
3. Ir. Adolf Pieter Lontoh, MS., as academic conselor who has help author when she was a student of Departement of Agronomy and Horticulture. 4. Dr. Ir. Dwi Andreas Santosa, M.Sc and International Center for
Biodiversity and Biotechnology staff for supplying the bio-fertilizer used in this research.
5. Ogawa Indonesia Company for the funding support in this research.
6. Dad, Mom, and Ami, beloved family who gave a lot of supports, love, and prayers.
7. Mr. Juhana, Pasir Sarongge experimental field manager, and all staff who helped author did her reserach in the field.
8. Mrs. Ismi, Mr. Joko, Mr. Agus, and Mr. Bambang as laboratory staff who helped author doing the analysis.
9. Ika, Hesty, Tri, Ana, Nina, Sindra, Icha, Itoh, Wulan, Nunung, Yuan, Linda, Royun, Meka, Euis, Landi, Emir, Malik, and Fadlullah, bestfriends considered as authors family who gave so much help and support, and all AGH 45 friends for kindness and acceptance to author.
Bogor, November 2012
LIST OF CONTENTS
Page
LIST OF TABLES ... viii
LIST OF FIGURES ... x
LIST OF APPENDIX ... xi
INTRODUCTION ... 1
Background ... 1
Objective ... 2
Hypothesis ... 2
LITERATURE REVIEW ... 3
Black Galingale Plant ... 3
Galingale Nutrient Uptake Research in Indonesia ... 5
Biological Fertilizer (Bio-fertilizer) ... 6
Bacteria in Liquid Bio-fertilizer ... 8
MATERIAL AND METHOD ... 10
Place and Time ... 10
Material and Equipment ... 11
Method ... 11
Observation ... 12
RESULT AND DISCUSSION ... 14
General Condition ... 14
Bio-fertilizer Effect on the Late-Vegetative Growth of K. parviflora ... 21
Nutrient Uptake Analysis ... 30
Bio-fertilizer Effect on the Harvest Component and Rhizome of K. parviflora ... 33
CONCLUSION AND SUGGESTION ... 39
Conclusion ... 39
Suggestion ... 39
REFERENCES ... 40
LIST OF TABLES
Number Page
1. Microbial content of some commercial bio-fertilizers in Indonesia... 7 2. Soil analysis of Pasir Sarongge experimental field before
treatment (5 MAP)... 14 3. Disease severity of root-knot... 17 4. Analysis of variant and coefficient variation (CV) of
late-vegetative growth of K. parviflora...... 22 5. The effect of bio-fertilizer rate on late-vegetative
growth... 23 6. Analysis of variant and coefficient variation (CV) of shoot
number... 25 7. Analysis of variant and coefficient variation (CV) of green color
intensity index and leaf area... 26 8. The effect of bio-fertilizer rate on photosynthesis pigment
content... 26 9. Correlation between green color intensity index and
photosynthesis pigment... 27 10. Affect of shading position and sun-lighting time on growth
parameter... 28 11. Affect of shading position and sun-lighting time on growth
parameter... 28 12. Analysis of variant and coefficient variation (CV) of stomatal
density in spesific leaf... 29 13. Analysis of variant and coefficient variation (CV) of nutrient
uptake... 30 14. The effect of bio-fertilizer rate on nutrient uptake... 32 15. The effect of bio-fertilizer rate on nutrient uptake
16. Analysis of variant and coefficient variation (CV) of harvest component parameter... 34 17. Correlation between number of rhizome, roots, and
root-knot... 35 18. The effect of bio-fertilizer rate on potential productivity and
actual productivity... 35 19. The effect of bio-fertilizer application on root-knot disease in K.
parviflora...
36
20. Classification of rhizome dimension... 36 21. The effect of bio-fertilizer rate on grade of
rhizome... 37 22 Analysis of different fertilizing standard operasional procedure of
LIST OF FIGURES
Number Page
1. Morphology K parviflora Wall ex. Baker... 4
2. Bacterial wilt and broken rhizomes caused by Ralstonia solanacearum... 16
3. Root-knot symptom and larva of root-knot nematode... 17
4. Disease intensity after bactericide & fungicide application and mean of alive plant number... 18
5. Major weeds were found in experimental field... 19
6. Longitudinal and cross-section of rhizome structure... 20
7. Longitudinal and cross-section of roots structure... 21
8. The fluctuation of young and old senescen leaves... 24
9. Growth of spesific leaves of K. parviflora... 24
10. Green color intensity index in 7, 8, and 9 MAP... 26
11. The different condition of K. parviflora in full sun and under shading... 29
12. Stomatal density in 5 MAP and 11 MAP... 30
13. Mean of nutrient uptake of K. parviflora at 11 MAP... 33
LIST OF APPENDIX
Number Page
1. Method of chlorophyll content analysis (Sims and Gamon,
2002)... 46
2. Mean of plant height per treatment... 47
3. Mean of leaves number per treatment... 47
4. Mean of leaf length per treatment... 47
5. Mean of leaf width per treatment... 48
6. Mean of number of shoot per treatment... 48
7. Mean of green color intensity index and leaf area per treatment... 48
8. Result of plant diseases analysis... 49
INTRODUCTION
Background
The demand of medicinal plants in domestic market is relatively high and tends to increase because of increasing awareness of the public to consume natural medicine. The domestic market that absorb upstream agribusiness products (seed) and downstream (simplicia, starch, oils, extracts) of medicinal plants is 1,023 companies, consist of 118 IOT (Industri Obat Tradisional) and 905 IKOT (Industri Kecil Obat Tradisional). Medicinal plants are used for IKOT, IOT, and the pharmaceutical industry average by 63%, while for exports and household consumption by 14 and 23% (Ministry of Agriculture, 2007).
Moreover, herbal medicine trade in international market also tends to increase. In 2000 the value of trade in herbal medicines reached U.S. $ 40 million, then in 2002 increased to U.S. $ 60 million, and in 2050 is estimated to be U.S. $ 5 billion with an increase of 15% per year, higher compared with an increase in the value of trade in synthetic medicinal that only 3% per year (Ministry of Agriculture, 2007). Galingale (Kaempferia galanga L.) became the most widely cultivated medicinal crops in Indonesia, after ginger (Zingiber officinale) and galangal (Alpinia galangal).
Like galingale (Kaempferia galanga), black galingale (Kaempferia parviflora Wall ex. Baker) is a medicinal plant that have high potential to be developed as medicinal products (Chivapat et al., 2010). According to the previous research, black galingale rhizome can be used as an anti-inflammatory and anti-HIV (Sookkongwaree et al., 2006), anti-cancer (Patanasethanont et al., 2007), and anti-allergic (Tewtrakul et al., 2008). Traditionally black galingale rhizome is used as a drug for hypertension patients. Research shows that the ethanol extract of rhizome black galingale triggers vasorelaxant effects on rat aorta vascular (Tep-areenan et al., 2010).
galingale showed better growth under shading than full sun. Introduction of black galingale is conducted to determine the suitable agroclimate for these plants so that a black galingale cultivation procedure in Indonesia could be developed. Fertilization is one of important technology in the cultivation of plants. Standard operational procedures for fertilizing galingale (Kaempferia galanga L.) in Indonesia are manure 30 ton ha-1, urea 300 kg ha-1, SP-36 250 kg ha-1, and KCl 250 kg ha-1, depending on the fertility of the soil at each specific location (Rostiana and Effendi, 2007). Previous research also refers to this standard operasional procedure for fertilizing galingale. But this standard operasional procedure should be reviewed and corrected according to the type of plants and development of technology, especially for black galingale that only introduced in Indonesia recently.
The management of fertilization must attempt to ensure both an enhanced and safeguarded environment so that a balanced fertilization strategy that combines the usage of chemical and organic fertilizer must be developed and evaluated (Chen, 2006). Using bio-fertilizer is one of the efficient ways to improving plants production by reducing the usage chemical fertilizers (Soleymanifard and Sidat, 2011). The research "Application of Liquid Bio-Fertilizer Reduced the Need of Chemical Bio-Fertilizer in Black Galingale (Kaempferia Parviflora) Production" is part of attempts to develop a standard operational procedure for black galingale cultivation in Indonesia.
Objective The research was conducted to:
1. Study the effect of various rate of liquid bio-fertilizer on plant growth and rhizome production of black galingale (K. parviflora Wall ex. Baker).
2. Get a recommendation rate of liquid bio-fertilizer on black galingale (K. parviflora Wall ex. Baker) cultivation.
Hypothesis
LITERATURE REVIEW
Black Galingale Plant
Kaempferia parviflora Wall. Ex. Baker known as black galingale belong to the family Zingiberaceae. This plant is indigenous herbal plants that can be found in Thailand, India and Burma. In Thailand, K. parviflora are widely cultivated in the province of Loei. K. parviflora also known as Thai viagra or ginseng. There was a research evaluated mitigative effect of aqueous rhizome extract of K. parviflora against testicular toxicity in male rats (Luangpirom and Komnont, 2011). The taxonomy of black galingale is as follow.
Kingdom : Plantae Sub Kingdom : Viridaeplantae Phylum : Tracheophyta Sub Phylum : Euphyllophytina Class : Liliopsida Sub Class : Commelinidae Ordo : Zingiberales Family : Zingiberaceae Genus : Kaempferia
Species : Kaempferia parviflora Wall ex. Baker
Thailand name : Kra-Chai-Dahm, Kra-Chai-Dum, Thai viagra or ginseng Scientific synonim : Boesenbergia pendurata (Roxb.) Holtt.
altitude had more red composition than in lower altitude (Evi, 2012). K. parviflora is a ground herb that grows to 90 cm tall. The middle of the stems with light red color is sheath petiole densely covered with speckling on light green (Putiyanan et al., 2008). In K. parviflora, inflorescence appears on the terminal of the stem between the leaves. K. parviflora have one to four flowers from one inflorescence. Flower of K. parviflora are white with purple spot. The flower is irregular or bilaterally symmetrical (the flower can be cut only along one plane to produce equal halves) (Evi, 2012). The flowers have 2 bracts, 6 stamens, anther is close to long, small style, stigma, brass-shape, hairless, dehiscent fruit split into 3 rays when mature. Seeds are quite large (Putiyanan et al., 2008).
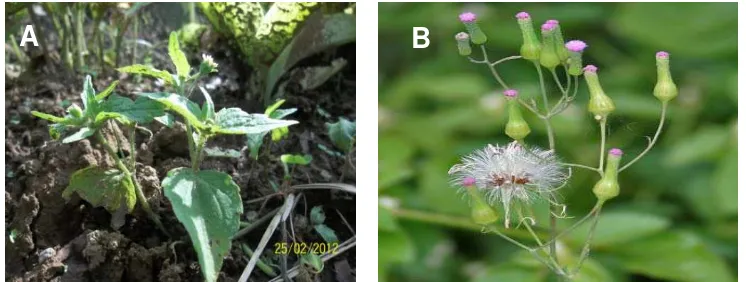
Evi (2012) also explained that K. parviflora can be distinguished with the K. galanga or galingale, the common herbaceous plant from Indonesia, from the absence of purplish color that K. parviflora has in its leaf and stem, the color of the rhizome, and also from the flower. Galingale flower is bigger (about 2.5-3 cm) and have ribbon-like petal. The morphology of Kaempferia parviflora Wall Ex. Baker is shown in Figure 1.
Based on the previous research, rhizome of K. parviflora contained some flavonoids, such as 5-hydroxy-3,7-dimethoxyflavone, 5-hydroxy-7-methoxyflavone, 5-hydroxy-3,7,4'-tri5-hydroxy-7-methoxyflavone, 5-hydroxy-7,4'-dimethoxyflavone, 3,5,7,4'-tetramethoxyflavone, 5,7,4'-trimethoxyflavone, 5,7,3 '4'-tetramethoxyflavone, and 5-hydroxy-3,7.3'4'tetramethoxyflavone, 3,5,7-trimethoxyflavone (Trisomboon, 2009). Tanasiriwattana et al. (1997) in Kummee et al. (2008) stated that the essential oil of the K. parviflora is borneol (46.41%) and sylvestrene (25.30%). In addition, black galingale rhizome contains a variety of flavonoids such as hydroxyflavone (Daodee et al., 2003; Yenjai et al., 2004) and anthocyanins (Vichitphan et al., 2007). Both flavonoids are anti-HIV (Sookkongwaree et al., 2006), anti-cancer (Patanasethanont et al., 2007), and anti-depressant (Wattanathorn et al., 2007).
Ethanol extract of K. parvflora has the highest potential as an anti-allergic than Kaempferia galanga, Curcuma mango, Zingiber cassumunar, Zingiber oficinale, and Zingiber zerumbet (Tewtrakul et al., 2008). Kummee et al. (2008) added that the anti-microbial activity of extracts of K. parviflora can resist disease agents, such as bacteria, yeast and fungi. Tep-areenan et al. (2010) showed that ethanol extract of K. parviflora rhizome triggers vasorelaxant effects in rat aorta, so K. parviflora rhizome can be used as a hypertension drug. K. parviflora’s ethyl acetate extract is now considered to be an invasive enteropathogen because it could significantly inhibit the invasion of both Helicobacter pylori, an etiological agent of active cause chronic gastritis and peptic ulcer disease (Chaichanawongsaroj et al., 2010).
uptake ranged between 41.50-112.50 mg plant-1 and K uptake ranged from 236.10-571.70 mg plant-1.
Phosphorus (P) uptake in rhizomes is less than N and K. This fact similar to research on other rhizome plants, such as Curcuma aeruginosa (Djazuli et al., 2001; Rosita et al., 2005a) and ginger (Rosita et al., 2005b). Rosita et al. (2007) explained that the need of P on crops is generally less than the others nutrients. Potasium is very important to transport photoshyntate to the storage organs. When the leaves and stems become senescence, nutrients uptake can be seen from the rhizome because the nutrient is translocated to the rhizomes. Rosita et al. (2007) analyzed 82.03 g fresh rhizome of promising lines K. galanga which planted by giving manure 20 ton ha-1 urea + 250 kg ha-1 + SP-36 200 kg ha-1 KCl + 200 kg ha-1. The result showed that nutrient uptake into the rhizomes is 415.60 mg plant-1 N (equivalent to 83.12 kg ha-1 N), 112.50 mg plant-1 P (equivalent to 22.50 kg ha-1 P) and 571.70 mg plant-1 K (equivalent to 114.34 kg ha-1 K).
In other medicinal rhizome plant research, Curcuma xanthorrhiza Roxb., application of urea, SP-36, and KCl with each rate of 100 kg ha-1 produced 20.23 ton ha-1 rhizome, which absorbed 137.41 kg ha-1 N, 15.30 kg ha-1 P, and 146.11 kg ha-1 K. Application of urea, SP-36, and KCl of 300 kg ha-1, 200 kg ha-1, and 200 kg ha-1, respectively, produced 25.46 ton ha-1 rhizome, which absorbed as much as 193.44 kg ha-1 N, 21.05 kg ha-1 P, and 221.34 kg ha-1 K (Rahardjo and Pribadi, 2010). Organic fertilizer should be used in the cultivation of medicinal plants to reduce the usage of anorganic. One of organic fertilizer is bio-fertilizer. Ruhnayat (2008) stated that bio-fertilizers can give positive respond to the growth and rhizome production of medicinal plants.
Biological Fertilizer (Bio-fertilizer)
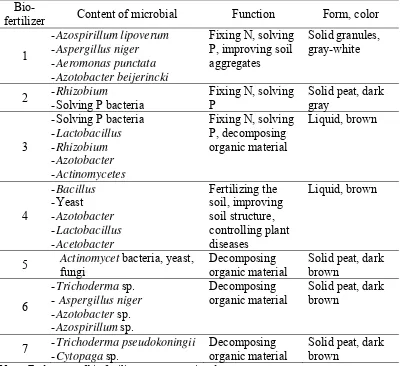
liquid carrier material because process to make granule is difficult and need more cost. Certain bio-fertilizer contains specific microorganisms and the combined microorganisms resulted in specific function (Table 1).
Table 1. Microbial content of some commercial bio-fertilizers in Indonesia (Simanungkalit et al., 2007)
Bio-fertilizer Content of microbial Function Form, color
1
-Azospirillum lipoverum -Aspergillus niger -Aeromonas punctata -Azotobacter beijerincki
Fixing N, solving P, improving soil aggregates
Solid granules, gray-white
2 -Rhizobium
-Solving P bacteria
Fixing N, solving P
Solid peat, dark gray
3
-Solving P bacteria -Lactobacillus -Rhizobium -Azotobacter -Actinomycetes
Fixing N, solving P, decomposing organic material Liquid, brown 4 -Bacillus -Yeast -Azotobacter -Lactobacillus - Acetobacter
Fertilizing the soil, improving soil structure, controlling plant diseases Liquid, brown
5 Actinomycet bacteria, yeast, fungi
Decomposing organic material
Solid peat, dark brown
6
-Trichoderma sp. - Aspergillus niger -Azotobacter sp. -Azospirillum sp.
Decomposing organic material
Solid peat, dark brown
7 - Trichoderma pseudokoningii -Cytopaga sp.
Decomposing organic material
Solid peat, dark brown
Note : Trade name of bio-fertilizers are not mentioned
the physical-chemical-biological structure of soil, control pest and plant disease, and make the balance of flora-fauna in the soil.
Bacteria in Liquid Biological Fertilizer
Generally, liquid biological fertilizer or bio-fertilizer containing various microorganisms that can fix N2, triggers plant growth, produce plant growth
hormone, anti-pest, anti-odor, and decompose cellulose.
1. N2 fixing-bacteria and plant growth hormones producing bacteria
(Azospirillum lipoferum ICBB6088 and Azotobactervinelandii ICBB9098)
Azospirillum has a high potential to be developed as bio-fertilizers. There are three known species that have the ability in fixing nitrogen, A. brasilense, A. lipoferum, and A. amazonense. Mechanical association of these bacteria do not cause changes in root morphology, but increasing the number of hair roots and branching roots to be more intensive in the absorption of nutrients. If there is no activity of fixing nitrogen, mechanical association of bacteria is limited only to increased absorption of nitrogen in the soil.
Differently, Azotobacter spp. is a non-symbiotic bacteria living near plant roots area (rhizosphere). These bacteria were found in all soil types but the population is relatively low. Like Azospirillum, Azotobacter can also improve plant growth by supplying nitrogen and increasing growth hormones, reducing competition with other microbes in fixing nitrogen, and creating more favorable soil conditions for plant growth. Azotobacter inoculation study has been able to increase yield of the variety of plants and accelerate seed germination (Saharan and Nehra, 2011). Because of these reasons, Azotobacter as bio-fertilizer can increase yield, reduced the usage of anorganic fertilizers, and increase soil biological activity (Jarak et al., 2006).
2. Antagonistic bacterial with anti-bacterial and anti-pest activities (Bacillus
thuringiensis ICBB 6095, Paenobacillus macerans ICBB8810, and
Saccharomyces cerevisiae ICBB 8808)
particularly insects of the order Lepidoptera, Diptera, and Coleoptera. This protein is soluble and active to be toxic, especially after entering the digestive system of insects. B. thuringiensis can be used as biopesticides pest plants. The usage of biopesticides is expected to reduce the negative impact from the usage of chemical pesticides in agricultural products. B. thuringiensis strains and new isolates were evaluated for its use as a microbial pesticide (Bahagiawati, 2002). B. thuringiensis is known as the most numerous bacteria in the area rhizosfer. Some strains of Bacillus can produce plant growth hormone for the plant. Several other strains can also be used as bio-inoculants in the manufacture of bio-fertilizer to increase production of various crops (Saharan and Nehra, 2011).
P. macerans have capability to against Ralstonia solanacearum by producing antibacterial activity of protein (Li et al., 2010). Saccharomyces cerevisiae can produce chitinase and protease for destroying chitine layer of nematode eggs(Ahmad, 2007).
3. Cellulose decomposer (Paenobacillus macerans ICBB8810, Lactobacillus sp. ICBB 6099, Saccharomyces cerevisiae ICBB 8808, and Microbacterium
lacticum ICBB 7125)
MATERIAL AND METHOD
Place and Time
Research was conducted in November 2011 to June 2012 at Pasir Sarongge Experimental Field, University Farm, Bogor Agricultural University, Cipanas with altitude 1,200 m above sea level (asl) with soil type Andosol. Soil samples was taken before treatment of bio-fertilizer, then analyzed in Indonesian Soil Research Institute Bogor, while the plant tissue analysis was conducted in Plant Analysis and Chromatography laboratory, Department of Agronomy and Horticulture, Bogor Agricultural University. Observation of stomatal density and chlorophyll were conducted at Microtechnique and Molecular Marker Laboratory and Spectrophotometry laboratory, Department of Agronomy and Horticulture, Bogor Agricultural University. After harvesting, the rhizomes also were analyzed in Post Harvest laboratory, Department of Agronomy and Horticulture, Bogor Agricultural University.
Material and Equipment
Plant material used in this research was K. parviflora rhizomes which were received from Ogawa Indonesia Company. Rhizomes with one bud (+ 2 cm length) were cut to approximately 15 g. Rhizomes were then planted at 5 cm depth and 20 cm x 25 cm plant spacing in a raised bed. The raised bed size was 80 cm x 250 cm x 30 cm (width x length x height), thus there were 40 rhizomes planted in one raised bed. K. parviflora was planted at 10 June 2011.
Weeding was done manually every two weeks. Pest controlling was done manually and physically by using trap. Traps are made from yellow plastic covered by sticky glue.
Equipment used for the treatment of liquid bio-fertilizer was measuring glass. Equipment used for the observations are Leaf Area Meter portable type LI-3000C, SPAD portable, light microscopy, stomatal and clorophyll analysis equipment, also soil and plant tissues analysis equipment. Others equipment were tillage tool, ruler, label, camera, weight scale, and oven.
Method
Research was conducted using the Randomize Completely Block Design (RCBD) which the treatment are:
C : 0 L ha-1 bio-fertilizer, full rate of urea, SP-36, and KCl (100% chemical fertilizer).
D1 : 15 L ha-1 bio-fertilizer, half rate of urea, SP-36, and KCl (50% chemical fertilizer).
D2 : 22.5 L ha-1 bio-fertilizer, half rate of urea, SP-36, and KCl (50% chemical fertilizer).
D3 : 30 L ha-1 bio-fertilizer, half rate of urea, SP-36, and KCl (50% chemical fertilizer).
Liquid bio-fertilizer was applied 2 times, by watering half rate in soil at 5 and 7 month after planting (MAP). First application of half rate bio-fertilizer at 5 MAP was conducted to promote the late-vegetative growth, while second application of half rate bio-fertilizer at 7 MAP was conducted to promote the rhizome growth. Linear model used was:
Yij = µ + αi + βj + εij
Where :
Yij = sum of i fertilizer treatment and j block
µ = average
αi = i effect of treatment (0 L ha-1 bio-fertilizer and 100% chemical fertilizer (C),
βj = j effect of replication as block (j = shade position with 6 hours of
sun-lighting, half shade position with 9 hours of sun-sun-lighting, and full sun position with 12 hours of sun-lighting)
εij = treatment error
Obsevation data were tested for normality then tested with F-test at 5% level. Data with significant difference was tested with Duncan Multiple Range Test. All tests were analyzed by SAS V9 software.
Observation
The observation started 22 week after planting (WAP) by taking 5 plants in each unit of experiment. Parameters observed during the research were:
• Height of plants were measured from ground to highest leaf, every two weeks • Number of leaf per plants were measured every two weeks
• Width and length of specific leaf were measured every two weeks • Number of shoot per plants
• Leaf area of specific leaf was measured using Portable Leaf Area Meter type LI-3000C at 7, 8, and 9 MAP
• Green color intensity of specific leaf were measured using SPAD at 7, 8, and 9 MAP
• Stomatal density at 5 and 6 MAP was measured by using nail coat which swiped
upon leaf surface, dried, taken from leaf surface, then sticked to object glass, and then observed under microscope. Each stomata counted manually, using formula :
n stomata = number of stomata that counted x = stomatal density per cm2
L = microscope seeing area, was circle area which diameter 0.5 mm2, so can be counted by using formula :
¼ πd2 = ¼ x 3.14 x 0.52 = 0.19625 mm2
• Chlorophyll content at 7 and 9 MAP by using Sims and Gamon (2002) method
• Character, structure, and color of rhizome were observed under microscope • Fresh- and dry-weight of shoot at harvesting time
• Fresh- and dry-weight of rhizome per plant at harvesting time • Potencial and actual productivity
Soil analysis and plant tissue analysis were used to determine the amount of nutrient uptake by plants. Data for temperature and humidity was collected from Meteorology, Climatology and Geophysics Institution (BMKG) for 7 months experiment
In this experiment, diseases intensity were counted by two parameter, diseases incidence of bacterial wilt and diseases severity of root-knot. Diseases incidence of bacterial wilt were measured by formula
n = the number of plant which showed the symptom bacterial wilt N = population of observed plant
After harvesting time, the root-knot were collected and compared with the healthy root of K. parviflora. The ratio of root-knot to root (R:K) showed diseases severity counted by formula
n = the number of plant from each category of symptom root-knot v = score value of each category of symptom root-knot
N = the number of observed plants
Z = score value of the highest category of symptom
According to Kusnanta (2005) research in rust disease patchouli plant
(Pogostemon cablin) stated that diseases intensity are determined 5 category, there
RESULT AND DISCUSSION
General Condition
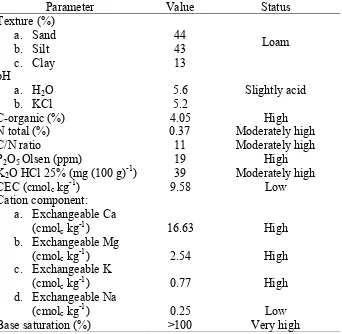
Soil characteristic in the experimental field was analyzed in Indonesian Soil Research Institute Bogor before bio-fertilizer and chemical fertilizer were applied (Table 2). The soil in Pasir Sarongge was categorized as Andosol and was slightly acidic (pH 5.2-5.6), high of C-organic (4.5%), P2O5 (19 ppm), high of
base saturation Ca2+ 16.63 cmolc kg-1, Mg2+ 2.54 cmolc kg-1, K+ 0.77 cmolc kg-1,
but low of base saturation Na+ 0.25 cmolc kg-1. Base saturation is used to manage
soil Na+ and can be utilized to determine soil Mg2+ availability.
Table 2. Soil analysis of Pasir Sarongge experimental field before treatment (5 MAP)
Parameter Value Status Texture (%) a. Sand b. Silt c. Clay 44 43 13 Loam pH
a. H2O
b. KCl
5.6 5.2
Slightly acid
C-organic (%) 4.05 High
N total (%) 0.37 Moderately high
C/N ratio 11 Moderately high
P2O5 Olsen (ppm) 19 High
K2O HCl 25% (mg (100 g)-1) 39 Moderately high
CEC (cmolc kg-1) 9.58 Low
Cation component: a. Exchangeable Ca
(cmolc kg-1)
b. Exchangeable Mg (cmolc kg-1)
c. Exchangeable K (cmolc kg-1)
d. Exchangeable Na (cmolc kg-1)
16.63 2.54 0.77 0.25 High High High Low Base saturation (%) >100 Very high
were low in clay (13%). The primary factor determining CEC is the clay and organic matter content of the soil. This experimental field soil had 13% of clay content, but C-organic was 4.05%, categorized as high level. CEC is a measure of the soils ability and capability to hold exchangeable ions. Cation is an ion with a positive electrical charge, while the clay and organic matter of the soil supplies the negative charges. Cations have the ability to be exchanged for another positively charged ion from the surfaces of clay minerals and organic matter. Higher quantities of clay and organic matter may result in higher CEC (Camberato, 2001).
The C/N ratio of soil sample was in high criteria (11:1). C/N ratio for plants growth is 10:1, thus the soil in Pasir Sarongge experimental field had relatively good C/N ratio. Herrmann (2003) showed that C/N ratio below 25:1 indicates that mineralization is higher than immobilization, so NH4+ will be
released. Soil organic matter is continuously decomposed by a range of soil microorganisms including bacteria, fungi and their predators resulting in the release of ammonium (NH4+) (mineralization). While mineralization of soil
organic matter provides C (energy) for microbial maintenance and growth.
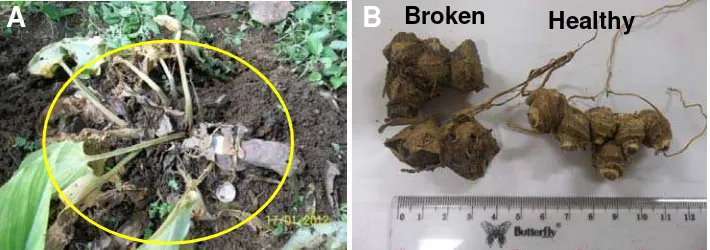
In the early December 2011, some plant diseases symptoms were found in some spots of raised bed. The analysis result of plant sample in Plant Clinic Laboratory of Bogor Agricultural University showed that K. parviflora suffered from bacterial wilt caused by Ralstonia solanacearum (Fig. 2A). This soil and water borne bacterium enters the plant roots, through the xylem, collapses the host, and cause the occurance of broken of rhizome (Fig. 2B and discussed in Table 19), then returns to the environment. According to the analysis, the incidence of bacterial wilt disease were 48.68% (Appendix 8) so it can decrease number of healthy plant (Fig. 4B).
host. R. solanacearum not only has effective pathogenicity determinants to invade and colonize host plants but also exhibits successful strategies for survival in harsh conditions. One of the characteristics of R. solanacearum is weak at pH 8, with no growth at pH 4 or 9 (EMPPO, 2004). According to result of the soil analysis, soil sample has pH between 5.2-5.6. It indicates that R. solanacearum can survive at the condition and then live with new host, K. parviflora. The rainy weather at December also promoted the growth of bacterium because of high humidity.
R. solanacearum can infect over 250 plant species in over 50 families. Many more dicotyl suffer from the disease than do monocotyl. Among the monocotyl host, the order Zingiberales dominates with 5 over 9 families being infected by this bacterium (Denny, 2006).
Figure 2. A) The yellow circle showed K.parviflora suffered from bacterial wilt caused by Ralstonia solanacearum, and B) The appearance of representative broken rhizome of sample plants at harvesting (11 MAP)
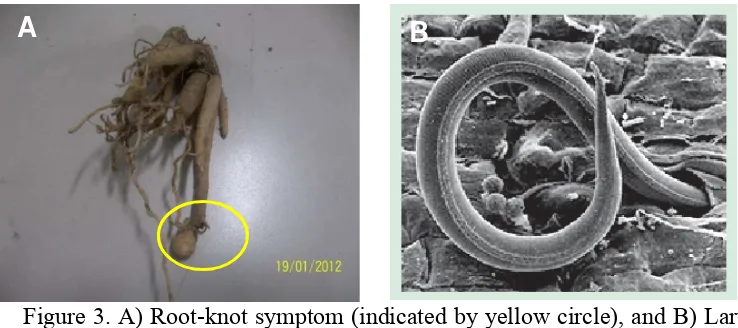
In addition to bacterial wilt, there was another symptom of diseases found in the plant root, called root-knot (Fig. 3). The diseases caused by nematode Meloidogyne spp. so that roots will have obvious galls or knot-like swellings. These swellings prevent movement of water and nutrients to the rest of the plant resulting in stunted plant growth. Plants affected by root-knot nematodes are more easily infected by soil-borne diseases caused by Ralstonia solanacearum (bacterial wilt). This secondary infection may lead to extensive discoloration of internal stem and root tissue, and rapid plant death (Cerkauskas, 2004).
B
Broken HealthyFigure 3. A) Root-knot symptom (indicated by yellow circle), and B) Larva of root-knot nematode, Meloidogyne incognita, magnified 500x, shown here penetrating a tomato root (Cerkauskas, 2004)
The ratio root-knot to total root (RK:R) showed the diseases severity of nematode infestation symptom (Appendix 8). Diseases severity of root-knot are 31.57% or medium symptom (Table 3).
Table 3. Diseases severity of root-knot Score
(v)
The number of plant from each
category of symptom (n) (n x v)
0 0 0 1 70 70 2 25 50 3 0 0 4 0 0
Note : n=the number of plant from each category of symptom, v =score value of each category of symptom, N=the number of observed plants, and Z=score value of the highest category of symptom
Bactericide and fungicide was applied to prevent diseases invade other health plants. Mankozeb was used as bactericide and fungicide, while Vandozeb was used as fungicide too. Bactericide and fungicide applied were 20 g L-1, respectively, so that for experimental field area (± 60 m2) the requirement of liquid bactericide-fungicide of Mandozeb were 3 L, similar to the fungicide Vandozeb needed. But, the application was in different time and frequency. Mankozeb was applied 2 times per week, while Vandozeb was applied 1 times per week. The significant decreasing number of plants was occurred between 24-46 WAP because of diseases effects (Fig. 4B). The disease symptoms were not found
anymore after 12 week of bactericide and fungicide application (Fig. 4A). At harvesting, infestation of nematode (shown by root-knot fresh weight) were found to all plants with no significant level (discussed in page 35, Table 16).
Figure 4. A) Number of invaded plants after bactericide and fungicide application, and B) Plant number decreased
During the research, some weeds and pests have been found and identified around the field. Major weeds found were Emilia sanchifolia and Ageratum conyzoides (Fig. 5). Manual weeding was done every 2 weeks to control the growth of weeds. Leaves destruction mostly caused by insect and caterpillars. Pests were controlled using trap made from yellow plastic covered by glue.
A
Figure 5. Major weeds found in the experimental field A) Ageratum conyzoides, and B) Emilia sanchifolia
K. parviflora is cultivated for their rhizomes because rhizome is the storage organ in black galingale. Therefore, deeper observation was done for the root part of this plant. As shown in Figure 6 and Figure 7, the root parts of K. parviflora can be divided into (1) green-immature rhizomes, (2) purple-immature rhizomes, (3) mature rhizomes, and (4) fleshy roots. The histology analysis was done in 8 MAP to know the structure of rhizome and root. Figure 6 shows the cross- and longitudinal-section of rhizomes.
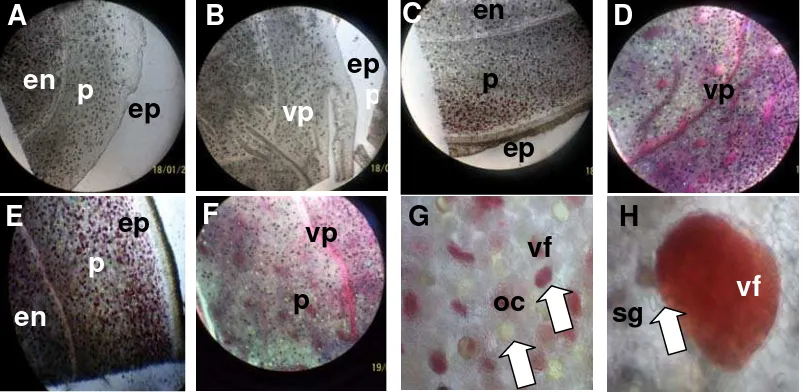
In Curcuma xanthorrhiza Roxb. the rhizome anatomical structure consisted of the epidermal cells, cortex, endodermal cells, and the central cylinder. Root hairs were formed from the epidermal cells, while cortex and central cylinder composed of parenchymal cells, cell secretion, and the vascular bundles (Kuntorini et al., 2011). Most of the parenchyma cells contain carbohydrates stored in the form of starch grains (Remashree et al., 1998). At K. parviflora the starch grains are shown by arrow in Figure 6H. Numerous starch grains, varying in shape, size and number, were present in both sides of intermediate zone (Remashree et al., 1997). Though K. rotunda belongs to monocotyl an obvious demarcation between the outer and inner zone by endodermis like layer is present and it is termed as endodermoidal layer (Sereena et al., 2011).
Similar to ginger, oil cells and canals are also oftenly found in K. parviflora. In K. parviflora rhizome, there were the secretory cell, identified as oil cell that contained oil component (Fig. 6G). Reddish cell-like structures were also found in the rhizomes. This structure was identified as vacuola that contained by flavonoids (Fig. 6H). Vacuola is the largest part in plants cell
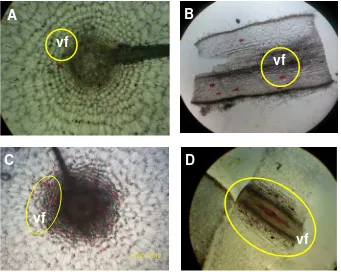
contained organic and anorganic material, such as flavonoids (Fahn, 2000). As plant cell expansion progresses, the tiny provacuoles gradually fuse to form the central vacuole, an enormous acidic compartment which can occupy up to 90% of the cell volume. The nucleus and all the other cytoplasmic organelles are displaced into a narrow, rapidly streaming layer between the tonoplast and the plasma membrane. Many plant cells accumulate water-soluble flavonoid pigments which range in color from orange-red to purple in these vacuola (Taiz, 1992). The fleshy-root was divided in to two parts that were root tip and root base. The fleshy roots also had a few number of vacuola contained flavonoids (showed in the circle) with certain distribution (Fig. 7).
Figure 6. A) Longitudinal section of green-immature rhizome, B) cross section of green-immature rhizome, C) longitudinal-section purple-immature rhizome, D) cross section of purple-immature rhizome, E) longitudinal section mature rhizome, and F) cross section of mature rhizome, in 4x magnification. Larger view of G) mature rhizome in 12x magnification, and h) reddish cell structure, identified as vacuola contained flavonoids. Abbreviation: ep (epidermic), en (endodermic), vf (vacuola contained flavonoids), oc (oil cell), vp (vascular pitch), sg (starch grain), and p (parenchym). Pictures were taken by camera digital Kodak M522.
A
B
C
F
E
D
G H
oc
vf
vf
sg
en
ep
ep
en
en
vp
vp
p
p
p
p
p
ep
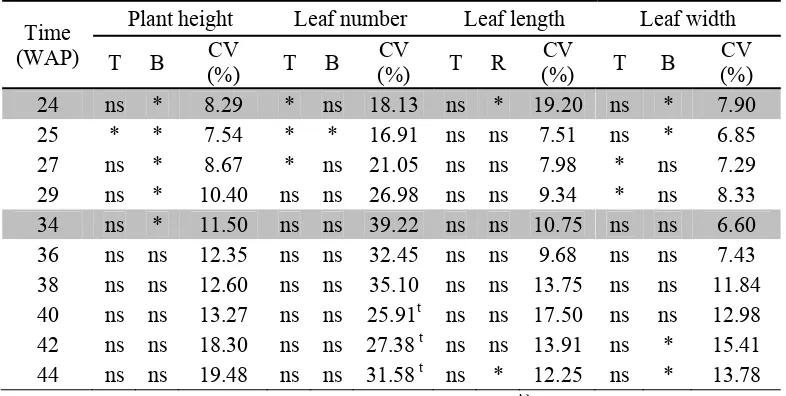
[image:31.595.113.516.303.499.2]Figure 7. A) Longitudinal-section of root tip, B) cross-section of root tip, C) longitudinal-section of root base, and D) cross-section of root base, vf : vacuola contained flavonoids. Picture were taken using magnification 4x and zoom out by Kodak M22. Bio-fertilizer Effect on the Late-Vegetative Growth of K. parviflora In this experiment, liquid bio-fertilizer was applied 2 times, by watering half rate fertilizer in soil at 5 and 7 MAP. First application of half rate of bio-fertilizer in 5 MAP was conducted to promote the late-vegetative growth, while second application of half rate of bio-fertilizer in 7 MAP was conducted to promote the rhizome growth. Bio-fertilizer application showed significant effect on late-vegetative growth (plant height, leaf number, leaf length, and leaf width) of K. parviflora only 3-6 weeks after the first half rate application of bio-fertilizer. But, the second half rate application of bio-fertilizer did not show significant effect on the late-vegetative growth (Table 4). Plants leaves that start to senescence after 29 WAP so it caused unsiginificant effect of late-vegetative growth after the second bio-fertilizer application. Thus, the late-vegetative growth only affected by the first half rate application of fertilizer for each bio-fertilizer rate. The general obsservation of late-vegetative growth of K. parviflora were shown in Appendix 2 up to Appendix 8.
vf
vf
A
B
C D
vf
[image:32.595.137.478.84.356.2]Bio-fertilizer is fertilizer containing advantageous microorganisms. Simanungkalit et al. (2006) stated bio-fertilizer is inoculants containing living organisms that can increase the availability of nutrients in the soil for plants. In this experiment, the applied bio-fertilizer contained N2 fixing-bacteria,
[image:33.595.116.509.385.583.2]Azospirillum lipoferum and Azotobactervinelandii. Nitrogen fixation was the first mechanism proposed to explain improved plant growth following inoculation with Azospirillum and Azotobacter. But these bacterium can also release some plant growth hormones. Azotobacter produces B-vitamins, indole acetic acid, gibberellins, cytokinines, also increase the activity of beneficial rhizospere bacteria, while Azospirillum penetrates and colonizes the roots as well as the tissues of the plant and release some plant growth hormones which promote crop growth (Kumar et al., 2010).
Table 4. Analysis of variant and coefficient variation (CV) of late-vegetative growth of K. parviflora
Time (WAP)
Plant height Leaf number Leaf length Leaf width T B CV
(%) T B
CV
(%) T R
CV
(%) T B
CV (%) 24 ns * 8.29 * ns 18.13 ns * 19.20 ns * 7.90 25 * * 7.54 * * 16.91 ns ns 7.51 ns * 6.85 27 ns * 8.67 * ns 21.05 ns ns 7.98 * ns 7.29 29 ns * 10.40 ns ns 26.98 ns ns 9.34 * ns 8.33 34 ns * 11.50 ns ns 39.22 ns ns 10.75 ns ns 6.60 36 ns ns 12.35 ns ns 32.45 ns ns 9.68 ns ns 7.43 38 ns ns 12.60 ns ns 35.10 ns ns 13.75 ns ns 11.84 40 ns ns 13.27 ns ns 25.91t ns ns 17.50 ns ns 12.98 42 ns ns 18.30 ns ns 27.38 t ns ns 13.91 ns * 15.41 44 ns ns 19.48 ns ns 31.58 t ns * 12.25 ns * 13.78 Note: Shaded rows showed time of application bio-fertilizer. *) significant, ns) not significant,
B) block, T) treatment, t) data were transformed by √x+1...n, and WAP) week after planting.
week after first application of bio-fertilizer/WAB1st, leaf number at 2, 3, and 5 WAB1st, leaf width at 5 and 7 WAB1st, and leaf area at 2 WAB1st) shown in Table 5 might be because of the capability of Azospirillum and Azotobacter to produce plant growth hormones (i.e. B-vitamines, indole acetic acid, gibberellins, cytokinines). Kummee et al. (2010) stated that Azotobacter and Azospirillum can release some plant growth which enhanced seed germination, plant height and plant biomass and crop yield of wheat (Triticum aestivum). Furthermore, the fact showed that the siginificant vegetative growth improvement was only found at 15 L ha-1 fertilizer application suggests that there might be optimum rate of bio-fertilizer.
In this experiment, K. parviflora which planted by adding 15 L ha-1 of bio-fertilizer had the optimum plant growth than application higher rate, 22.5 L ha-1 and 30 L ha-1 rate bio-fertilizer. This might be because, in that rate the microorganism population in soil was optimum because both Azospirillum and Azotobacter could grow well and did not compete in using nutrition and energy from C compound from organic acid and sugars. Thus, they could effectively inoculated the plant and promote plant growth. In other study, the interaction of Azospirillum with plant indicated its high affinity for organic acids, mainly malate and succinate, as carbon sources for their energy (Bashan et al., 2011). According to the Hindersah and Simarmata (2004), high inoculation of Azotobacter in lettuce (Lacutca sativa L.) caused high density and nutrition competition of population, so that affect the decrease of its population.
Table 5. The effect of bio-fertilizer rate on late-vegetative growth
Treatment
Plant height
(cm)
Leaf number Leaf width (cm)
Leaf area (cm2) 3/25 2/24 3/25 5/27 5/27 7/29 2/24
……...WAT/WAP…………... 100%ChemF+no BioF 25.3b 15.7b 18.5b 20.4b 6.8b 6.8ab 89.4ab 50%ChemF+15L ha-1BioF 28.4a 22.6a 28.2a 28.0a 7.6a 7.5a 99.7a 50%ChemF+22.5L ha-1BioF 25.4b 17.1b 20.0b 21.2b 6.9b 6.6b 77.8b 50%ChemF+30L ha-1 BioF 24.2b 15.7b 18.6b 20.8b 7.6a 7.4a 96.5a
CV (%) 7.54 18.13 16.91 21.05 7.29 8.33 12.35 Note: Numbers followed by the same letter in the same columns are not significantly different
[image:34.595.104.521.565.704.2]The coefficient of variation (CV) value of leaf number were relatively high (> 40%) at 40, 42, and 44 WAP because of the fluctuation number of young leaves and old senescence leaves. Young leaves develops (Fig. 8A) while old leaves are senescing and finally dead (Fig. 8B). Leaf senescence is the final stage of leaf development and indicates nutrient relocation from leaves to reproducing organ or to other growing organs, like rhizome (Lim et al., 2007). In addition, many leaves were destructed by insect and caterpillars.
Figure 8. Arrows showed a) new young leaf, b) old senescence leaf, and c) senescence of specific leaf
Full open mature leaves were chosen as specific leaf that would be measured. During the experimental the specific leaf was senesced after 12 week after full open mature (WAF) (Fig. 8C), so the mean of length and width of specific leaf tend to decrease (Fig. 9).
Figure 9. Growth of spesific leaves of K. parviflora (arrows indicate the time of leaves senenscence).
Width of spesific leaf Length of spesific leaf
Number of shoot were observed to predict the yield of rhizome before harvesting. Based on statistical analysis, there was no significant different between treatment of fertilizer (Table 6). Number of shoot was 4.17 per plant at final observation (data not shown). Actually, there is no correlation between number of shoot and yield of rhizome so number of shoot can not be used for predicting the yield of rhizome.
Table 6. Analysis of variant and coefficient variation (CV) of shoot number
Time (WAP)
Number of shoot Treatment Block CV (%)
36 ns ns 27.09
38 ns ns 38.05
42 ns ns 34.00
44 ns ns 30.09t
Note : ns) not significant, t) data were transformed by √x+1...n , WAP) week after planting.
Green color intensity were measured by SPAD meter in 7, 8, and 9 MAP. Based on statistical analysis, the green color intensity were not significant for all treatment applied (Table 7), with value ranged 18.55-20.00 ± 1.06 unit (Fig. 10). While chlorophyll content analysis were conducted in 7 and 9 MAP by using destructive analysis (Sims and Gamon, 2002) and determined per dry weight of leaf sample (mmol g-1). Based on statistical analysis all photosynthesis pigment contents were also not significantly different among treatments.
of 50% chemical fertilizer and 15 L ha-1 bio-fertilizer caused the higher mechanism of photosynthesis.
Table 7. Analysis of variant and coefficient variation (CV) of green color intensity and leaf area
Time (MAP)
Green intensity Leaf area
Treatment Block CV (%) Treatment Block CV (%)
7 ns ns 11.57 * * 12.35
8 ns ns 13.55 ns ns 13.07
9 ns ns 14.43 ns ns 26.65
Note: *) significant different at P < 0.05; ns = not significant; MAP = month after planting.
[image:37.595.222.394.285.498.2]Figure 10. Green color intensity in 7, 8, and 9 MAP
Table 8. The effect of bio-fertilizer rate on photosynthesis pigment content
Treatment
7 MAP 9 MAP
Chl a
Chl b
Total
Chl Anth Car Chl a
Chl b
Total
[image:37.595.106.518.565.697.2]Chl Anth Car
...mmol g-1...
100% ChemF+no BioF 0.28 0.16 0.44 0.31 0.23 0.24 0.13 0.37 0.25 0.20
50% ChemF+15L ha-1 BioF 0.23 0.13 0.36 0.25 0.25 0.20 0.14 0.33 0.34 0.20
50% Chem+22.5L ha-1 BioF 0.27 0.15 0.43 0.29 0.28 0.18 0.11 0.30 0.20 0.18
50% ChemF+30L ha-1 BioF 0.20 0.09 0.29 0.13 0.21 0.19 0.14 0.33 0.35 0.18
Mean 0.25 0.14 0.38 0.25 0.24 0.20 0.13 0.33 0.28 0.19
Stdev 0.03 0.03 0.06 0.08 0.03 0.03 0.01 0.03 0.07 0.01
CV (%) 39.6 22.5 32.4 24.9t 21.3 29.4 24.7 26.7 37.5 24.3
The SPAD meter is used for associating the relative chlorophyll content of leaves with the one-dimensional values established by the meter (green color intensity). The correlation between SPAD meter measurements and photosynthesis pigment contents were not found (Table 9) so in conclusion SPAD meter can not be used for predicting the physiological status in K. parviflora.
Table 9. Correlation between green color intensity index and photosynthesis pigment
Photosynthesis pigment
Green intensity (7 MAP)
Green intensity (9 MAP)
p-value R p-value R
Chl a ns 0.13 ns -0.37
Chl b ns 0.29 ns -0.51
Chl Total ns 0.19 ns -0.44
Anth ns 0.31 ns -0.29
Car ns 0.80 ns -0.25
Note: ns = not significant; R = coefficient of correlation, Chl a = Chlorophyll a, Chl b = Chlorophyll b, Chl Total = Chlorophyll Total, Anth = Anthocyanin, and Car = Carotenoids.
In this experiment, the block of each treatment was determined according to the shading position of raised bed and difference of sun-lighting time. First block were in shade position with 6 hours of sun-lighting, second block were in half shade position with 9 hours of sun-lighting, and the last block were in full sun position with 12 hours of sun-lighting. These different condition showed significant mean of plant height (24-29 WAP), leaf number (25 WAP) (Table 11), leaf width (24, 25, and 42 WAP), leaf length (22 and 44 WAP), and leaf area (24 WAP) (Table 10).
absorption. Difference characters at leaf area and leaf thickness is shade avoidance response from plant that grown under low light intensity is aimed to maximize light absorption thus more efficient photosynthesis (Taiz and Zeiger, 2003).
Table 10. Affect of shading position and sun-lighting time on growth parameter Position and sun-lighting time Plant height (cm) Leaf number (unit)
[image:39.595.112.510.431.544.2]24 25 27 29 25 ...…...…...WAP……..……... S + 6 HSL 26.96a 28.29b 28.82b 29.77b 24.00c HS + 9 HSL 23.45a 23.55a 24.78a 25.50a 17.40c FS + 12 HSL 25.20a 25.02a 25.89a 26.10a 21.14c Note: Shaded rows showed that FS + 12 HSL is the control for t-Dunnett test. Numbers
followed by the same letter in the same columns are not significantly different based on t-Dunnett at level α = 5%, S + 6 HSL: Shading + 6 hours of sun-lighting, HS + 9 HSL: Half shading + 9 hours of sun-lighting, and FS + 12 HSL: Full sun + 12 hours of sun-lighting.
Table 11. Affect of shading position and sun-lighting time on spesific leaf growth Position and sun-lighting time Leaf width (cm) Leaf length (cm) Leaf area (cm2) 24 25 42 44 24 44 24
……...…….WAP………... S + 6 HSL 8.23b 7.84a 7.60b 7.74b 16.97a 17.48b 98.56a HS + 9 HSL 6.77a 6.81a 6.34a 5.30a 14.26a 14.48a 90.77a FS + 12 HSL 7.91a 7.76a 5.78a 4.74a 16.03a 13.48a 76.23a Note: Shaded rows showed that FS + 12 HSL is the control for t-Dunnett test. Numbers
followed by the same letter in the same columns are not significantly different based on t-Dunnett at level α = 5%, S + 6 HSL: Shading + 6 hours of sun-lighting, HS + 9 HSL: Half shading + 9 hours of sun-lighting, and FS + 12 HSL: Full sun + 12 hours of sun-lighting.
destroy leaf directly (Fig. 11A). The development of leaves in ginger rhizomes are clockwise directions and it encircled the shoot apex (Remashree et al., 1998), similar to K. parviflora (Fig. 11B).
Figure 11. The different condition of K. parviflora in A) full sun, and B) shading, also showed clockwise directions phylotaxis of leaves Stomatal density was observed below microscope with magnification 400x. F-test showed that there was no significant different in stomatal density cm-2 in 5 and 6 MAP that showed significant different at 6 MAP (Table 12). In open place, plant are exposed to higher fluence rate of photosyntetically active radiation and to higher red to far-red ratios than under the shade. Thus, the stomatal density of leaves plant in open place are higher than under the shade plant.
Table 12. Analysis of variant and coefficient variation (CV) of stomatal density in spesific leaf
Position and sun-lighting time
Stomatal density
5 MAP 6 MAP
...(unit cm-2)...
S + 6 HSL 3,431.0 3,335.5b
HS + 9 HSL 4,280.3 3,898.1a
FS + 12 HSL 3,796.2 4,025.5a
F-test 0.091ns 0.031*
CV (%) 7.53 5.43
Note: Shaded rows showed that FS + 12 HSL is the control for t-Dunnett test. Numbers followed by the same letter in the same columns are not significantly different based on t-Dunnett at level α = 5%, S + 6 HSL: Shading + 6 hours of sun-lighting, HS + 9 HSL: Half shading + 9 hours of sun-lighting, and FS + 12 HSL: Full sun + 12 hours of sun-lighting.
Boccalandro et al. (2009) showed that higher red to far-red ratios increase stomatal density in Arabidopsis. This was goes along with The result which
[image:40.595.183.441.515.642.2]showed that without shading (high red-far red ratio) had higher stomatal density. Lower stomatal density could compensate CO2 assimilation by increasing stomatal
aperture and conversely, increased stomatal density could compensate CO2
[image:41.595.129.503.195.357.2]assimilation by reducing stomatal aperture (Bussis et al., 2006). In monocotyledons the stomata is surrounded with two guard cells with bulbous ends straight in the middle, walls are thick in the middle and thin at the ends (Fig. 12).
Figure 12. Stomatal density by magnification 400x in a) 5 MAP, b) 6 MAP, and c) zoom in stomata of adaxial epidermis of K.parviflora leaves. Picture was taken by camera digital Kodak M522.
Nutrient Uptake Analysis
Nutrient uptake analysis were conduted in 11 MAP, both on upground canopy (leaf and stem) and underground structures (rhizome and roots). Based on the statistical analysis, application of bio-fertilizer rate and 50% chemical fertilizers was not significantly different from full rate of chemical fertilizers for uptake value of N, P, and K (Table 13). It shows that bio-fertilizer could increase nutrient uptake, especially for N uptake, because bio-fetilizer applied contained N2 fixing bacteria.
Table 13. Analysis of variant and coefficient variation (CV) of nutrient uptake
Nutrient Uptake Analysis N P K
T B CV (%) T B CV (%) T B CV (%) Uptake of leaf and stem ns ns 22.23t ns ns 40.67t ns ns 33.49t Uptake of rhizome & roots ns ns 26.98t ns ns 22.83t ns ns 20.33t Note: ns) not significant, B) block, T) treatment, t)data were transformed by √x+1...n
Nitrogen fixation was the first mechanism proposed to explain improved plant growth following inoculation with Azospirillum and Azotobacter. This was mainly because of an increase in the number of nitrogenous compounds and the nitrogenase activity in inoculated plants (Bashan and Holguin, 1997). Maximum grain yield of rice (8.43 ton ha-1) was recorded with Azospirillum at 100 N kg ha-1, 1.34 ton ha-1 higher than the yield obtained with only 120 kg N kg ha-1 applied, suggesting the benefit of reducing N application by 20 kg ha-1 with extra yield. Similarly, Azotobacter showed the potential to save 20 N kg ha-1 with additional yield of 1.24 ton ha-1. Mixed cultures (Azospirillum and Azotobacter) were statistically similar to individual cultures. In the case of rice, grain yield increased significantly (Sattar et al., 2006). Interaction of N and bio-fertilizer affects yield. Using Azotobacter and Azospirillum caused to increasing 35 and 21% in yield, while getting a suitable yield in safflower by loss 50% N in compared with 60 kg ha-1 (standard operational procedure of chemical fertilizer). Decreasing N chemical fertilizer help to reduce environment pollution and developing sustainable agriculture (Soleymanifard and Sidat, 2011). In addition, the usage of agrochemicals was seriously disturbing plant biotic characters and soil ecology (Martin et al., 2011).
Rosita et al. (2007) showed that nutrient uptake of P in rhizome Kaempferia galanga L., was smaller than N and K. Generally requirement of P in plant was smaller than N and K. In contrast, nutrient uptake of K in rhizome was higher than N and P, because K was important nutrient for transporting photosyntate to the storage organ. This cases refers to previous research in Curcuma aeruginosa Roxb. (Djazuli et al., 2001), Zingiber pupureum Roxb. (Rosita et al., 2005a), and Zingiber officinale Rocs. (Rosita et al., 2005b).
because plants need much N for forming protein and nucleic acid (Soleymanifard and Sidat, 2011).
[image:43.595.112.512.392.505.2]The nutrients uptake of leaf and stem were 18.26-23.80 mg plant-1 of N, 6.17-9.39 mg plant-1 of P, and 21.09-32.71 mg plant-1 of K nutrients. While the nutrients uptake of rhizome and roots were 361.75-473.59 mg plant-1 of N, 134.22-193.88 mg plant-1 of P, and 122.05-131.66 mg plant-1 of K (Table 14). Generally this result was different from Rosita et al. (2007) experiment that showed the nutrients uptake of the promising lines Kaempferia galanga L. to the applied fertilizer technology package (manure 20 ton ha-1, urea 250 kg ha-1, SP-36 200 kg ha-1, and KCl 200 kg ha-1) were 149.60-415.60 mg plant-1 of N, 41.50-112.50 mg plant-1 of P, and 236.10-571.70 mg plant-1 of K nutrients, only measured on rhizome. But K uptake of rhizome and roots seems lower than Rosita et al. (2007) experiment.
Table 14. The effect of bio-fertilizer rate on nutrient uptake
Bio-fertilizer rate
Percentage (%) Nutrient uptake (mg plant-1)* Canopy Rhizome& Root Canopy Rhizome& Root N P K N P K N P K N P K C 1.94 0.71 2.76 2.10 0.90 0.83 20.0 9.4 30.1 473.6 193.9 131.7 D1 2.43 0.57 2.83 2.09 0.81 0.68 23.8 6.5 32.7 378.5 148.1 122.0 D2 2.16 0.74 3.60 2.14 0.79 0.77 18.3 6.2 32.3 361.8 134.2 131.0 D3 2.33 0.74 2.57 2.01 0.84 0.65 20.7 7.3 21.1 389.3 162.0 128.1 Note : *) Nutrient uptake (mg plant-1) were determined by percentage (%) x dry weight (mg
plant-1), C: Control (100% chemical fertilizer), D1: 50% chemical fertilizer + 15 L ha-1 Bio-fertilizer, D2: 50% chemical fertilizer + 22.5 L ha-1 Bio-fertilizer, and D3: 50% chemical fertilizer + 30 L ha-1 Bio-fertilizer.
Table 15 and Figure 13 showed the total nutrient uptake that used by population plant in 10,000 m2 (ha) compared with nutrient given from chemical fertilizer (urea contained 46% N, SP-36 contained 36% P2O5, and KCl contained
60% K2O). Ratio nutrient uptake to nutrient given of application 50% chemical
before experiment which shown that N total in soil was in moderately high and P2O5 Olsen was in high category (Table 2).
Table 15. The effect of bio-fertilizer rate on nutrient uptake percentage
Treatment
Nutrient given from chemical
fertilizer
Total nutrient uptake by plants
**
Ratio nutrient uptake to nutrient given
***
(kg ha-1) (kg ha-1) (%) N P K N P K N P K 100% ChemF+no BioF 138 39.28 125 98.73 40.65 32.35 71.54 103.49 25.88 50% ChemF+15L ha-1BioF 69 19.64 62.5 80.46 30.92 30.95 116.61 157.43 49.52 50% Chem+22.5L ha-1BioF 69 19.64 62.5 76 28.08 32.66 110.14 142.97 52.26 50% ChemF+30L ha-1BioF 69 19.64 62.5 82 33.87 29.86 118.84 172.45 47.78
Note : **) Total nutrient uptake (kg ha-1
) were determined by nutrient uptake (mg plant-1)* (Table 14) x population (plant ha-1), ***) Ratio nutrient given to nutrient uptake were determined by (total nutrient uptake by plants (kg ha-1) : nutrient given from chemical fertilizer (kg ha-1)) x 100%, ChemF: chemical fertilizer, BioF: bio-fertilizer.
Figure 13. Mean of nutrient uptake of K. parviflora at 11 MAP. C: Control (100% chemical fertilizer), D1: 50% chemical fertilizer + 15 L ha-1 Bio-fertilizer, D2: 50% chemical fertilizer + 22.5 L ha-1 Bio-fertilizer, and D3: 50% chemical fertilizer + 30 L ha-1 Bio-fertilizer.
[image:44.595.114.506.304.631.2]there were no significant different between the treatment applied (Table 16), but positive correlation were found between infestation of nematode (root-knot) with weight of root, also between weight of root with weight of rhizome. It means that the increasing of root affected the increasing of nematode infestation to the roots (Table 17), this similar to the increasing of root affected the increasing of rhizome.
Table 16. Analysis of variant and coefficient variation (CV) of harvest component parameter
Parameter T B CV (%)
Fresh canopy weight per plant (g) ns ns 19.33t Dry canopy weight per plant (g) ns ns 20.18 t Fresh rhizome weight per plant (g) ns ns 19.91 t Dry rhizome weight per plant (g) ns ns 20.27 t Fresh roots weight per plant (g) ns ns 19.86 t Dry roots weight per plant (g) ns ns 19.04 t Knot-roots weight per plant (g) ns ns 20.86 t Number of individual rhizome per plant ns ns 19.13 t Fresh rhizome weight per plant (g) ns ns 19.26 t Rhizome length per plant (cm) ns ns 22.20 t Rhizome width per plant (cm) ns ns 14.55 t Diameter of individual rhizome (cm) ns ns 4.56 Fresh canopy weight per plot (g) ns ns 22.15 t Dry canopy weight per plot (g) ns ns 19.83 t Fresh roots weight per plot (g) ns ns 23.01 t Fresh rhizome weight per plot (g) ns ns 21.06 t
Note: ns = not significant; B = block; T = treatment; t = data were transformed by √x+1...n. canopy were consist of stem and leaf
Figure 14. Experimental field in a) 5 MAP and b) 11 MAP
[image:45.595.155.470.579.722.2]Table 17. Correlation between number of rhizome, roots, and root-knot Correlation Rhizome Roots p- value r (Pearson) R-square p- value r (Pearson) R-square Root-knot 0.0127* 0.56 0.31 <.0001* 0.80 0.65
Roots <.0001* 0.82 0.67
Note: *) significant, The formula which can be used to predict yield of rhizome was Y=24.63g +1.93X, where Y are fresh weight of rhizome (g) and X are fresh weight of root (g).
[image:46.595.103.520.503.647.2]Table 18 showed the effect of bio-fertilizer rate on potential and actual productivity. Based on statistical analysis, potencial productivity showed not significant value, so rhizome yield of application 50% chemical fertilizer and bio-fertilizer rate were similar to hizome yield of application 100% chemical bio-fertilizer. Aplication of chemical fertilizer and its combination with bio-fertilizer resulted in rhizome fresh weight of 29.48-45.66 g plant-1. This result were lower than Rosita et al. (2007) result of fresh weight of promising lines Kaempferia galanga L. rhizomes, that ranged from 62.27-70.22 g plant-1. Potencial productivity of K. parviflora, 4.38-8.19 ton ha-1, were also lower than Rosita et al. (2007) experiment ranged from 9.52-11.1 ton ha-1.
Table 18. The effect of bio-fertilizer rate on potential productivity and actual productivity
Treatment
Rhizome FW (g plant-1)
Rhizome FW (g (2 m2)-1)
Potential productivity
(ton ha-1)*
Actual Productivity
(ton ha-1)** 100% ChemF+no BioF 29.48 325.60 4.38 (100%) 1.30 50% ChemF+15L ha-1 BioF 45.66 765.25 8.19 (187%) 3.06 50% Chem+22.5L ha-1 BioF 37.42 392.80 5.73 (131%) 1.57 50% ChemF+30L ha-1 BioF 33.98 742.67 5.35 (122%) 2.97
Mean 36.64 556.58 7.33 2.23
St-dev 5.04 174.79 1.01 0.70
Note: FW = fresh weight; *) Potential productivity was determined by rhizome fresh weight per plant (g plant-1) x population (plant ha-1) x 80%, percentage in brackets were compared with treatment Control as 100%; **) Actual productivity was determined by (10,000 m2 (2 m2) -1 x fresh rhizome weight g plot-1 (2 m2) x 80%.
higher than rhizome yield from the absence of bio-fertilizer. The actual productvity seems to be very different with potencial productvity because in this experimental field found some diseases, namely root-knot and bacterial wilt (Table 3, Fig. 2, and Fig. 3), that cause decreasing almost 50% number of plant per raised bed (Fig. 4B).
[image:47.595.101.526.366.477.2]The weight of root-knot, ratio root-knot to total root (RK:R) and the broken rhizome tend to decrease by bio-fertilizer application (Table 19). The underlying mechanism might be related to the content of the bio-fertilizer. Bio-fertilizer applied in this experiment contains Saccharomyces cerevisiae and Paenibacillus macerans. Saccharomyces cerevisiae can produce chitinase and protease for destroying chitine layer of nematode eggs (Ahmad, 2007), while Paenibacillus macerans have capability to against Ralstonia solanacearum (Li et al., 2010).
Table 19. The effect of bio-fertilizer application on root-knot disease in K. parviflora Bio-fertilizer rate Weight of root-knot (RK) Weight of root (R) Ratio RK:R Broken rhizome weight* (g plant-1) (g) (%) (g plot-1)
100% ChemF+no BioF 7.04 26.36 26.70 14.77
50% ChemF+15L ha-1 BioF 7.10 32.39 21.93 16.83
50% Chem+22.5L ha-1 BioF 6.21 30.30 20.49 10.46
50% ChemF+30L ha-1 BioF 3.91 22.70 17.23 0
Note: R) Root consisted of fleshy root and adventitous roots, *) Broken rhizome which caused by bacterial wilt and nematode.
The rhizome dimension were classified as small, medium, and large rhizome based on fresh weight per clump (Table 20). As showed in Table 21, all treatment tend to produce small and medium rhizomes, while large rhizome were rarely formed.
Table 20. Classification of rhizome dimension Dimension of
rhizome
Rhizome grade (interval, mean)
Small Medium Large Fresh Weight (g) (18.71-19.61, 19.18) (20.45-39, 28.55) (41.14-63.19, 55.54)
Length (cm) 5.39 6.95 8.18
Width (cm) 3.93 4.71 6.00
Diameter (cm) 1.59 1.6 1.62
[image:47.595.101.523.636.732.2]Table 21. The effect of bio-fertilizer rate on grade of rhizome
Treatment Number of rhizome according to grade
[image:48.595.130.494.254.609.2]Large Medium Small ...clump 2 m-1...
100% ChemF+no BioF 5 4 17
50% ChemF+15L ha-1 BioF 5 8 8
50% Chem+22.5L ha-1 BioF 5 10 11
50% ChemF+30L ha-1 BioF 5 8 10
Table 22. Analysis of different fertilizing standard operasional procedure of K. parviflora per ha
Type of Cost No. of unit Unit Price unit-1 Total ...100% chemical fertilizer... *Income
Yield 1,300 kg 18,000 23,400,000
*Input
Bio-fertilizer 0 liter 0 0
Urea 300 kg 2,300 690,000
SP 36 250 kg 2,300 575,000
KCl 250 kg 12,000 3,000,000
Total cost 4,265,000
...50% chemical fertilizer and 15 L ha-1 bio-fertilizer... *Income
Yield 3,060 kg 18,000 55,080,000
*Input
Bio-fertilizer 15 liter 50,000 750,000
Urea 150 kg 2,300 345,000
SP 36 150 kg 2,300 345,000
KCl 125 kg 12,000 1,500,000
Total cost 2,940,000
CONCLUSION AND SUGGESTION
Conclusion
The conclusion of this research is that the usage of bio-fertilizer could reduce the need of chemical fertilizer (i.e. urea, SP-36, and KCl) up to 50% without significant difference in rhizome yield. Application rate of 15 L ha-1 bio-fertilizer and 50% chemical bio-fertilizer also could promote late-vegetative growth of K. parviflora better than other rate or without bio-fertilizer up to 29 WAP. From economic point of view, the usage of bio-fertilizer can save the cost for buying chemical fertilizer so that the benefit become higher. The result also imply that the usage of bio-fertilizer could suppress disease severity of root-knot caused by nematode in the field.
Suggestion
REFERENCES
Ahmad, R. Z. 2007. Aktivitas enzim kitinase dan protease pada cendawan nematofagus (Duddingtonia flagrans and Saccharomyces cerevisiae). p885-891. In Seminar nasional peternakan dan veteriner 2007. Balai Besar Penelitian Veteriner. Bogor.
Bahagiawati. 2002. Penggunaan Bacillus thuringiensis sebagai bioinsektisida. Bul. A